Synergistic Effect of Temperature and
Pressure on Cement Thickening Time
Samuel S. Mofunlewi#1, Ogbonna Joel*2, Dulu Appah#3, Chikwendu Ubani#4
#
World Bank African Centre of Excellence, Centre for Oilfield Chemicals Research, University of Port Harcourt, Port Harcourt, NIgeria
Abstract : Thickening time of cement have been
carried out on the effect of temperature at a single point of pressure without considering the effect of changes on the pressure profile. Presently, no comprehensive study has been done to demonstrate the combined effect of temperature and pressure on cement slurries. Thickening time tests are conducted in the cementing laboratory using the bottom hole circulating temperature (BHCT) and the cumulative hydrostatic pressure of the fluid in the well at the well depth. However, since temperature and pressure increase with increasing depth of the well, it is important to understand the combined effect of these varying parameters on the thickening time of cement slurries in the annular space between the casing and the formation.
Thickening time tests were conducted in line with API specifications at 80oF and 120oF and varying bottom hole pressures (between 0psi and 20,000psi) using neat cement slurry. A model was developed using the multiple regression method. The model was developed to show the relationship between the thickening time and temperature and pressure. The model can also be used to predict the thickening time of cement slurries with changes in temperature and pressure. Results also show that thickening time of cement slurry reduces as temperature and pressure increases for a particular type of cement slurry. Test results indicate that changes in temperature and pressure significantly affect the thickening time.
Keywords : Temperature, pressure, thickening time, cement
I.INTRODUCTION
Oil well cementing is the process of mixing water, additives and cement to form a slurry and pumping down the slurry through casing to critical points in the annulus around the casing or in the open hole below the casing string. Additives are chemicals that are added to cement systems in order to achieve certain desired qualities depending on downhole conditions. There are certain tests that need to be conducted in the laboratory before a cement slurry can be pumped downhole. Some of the tests are thickening time, compressive strength, viscosity and water content of cement. The reason
for conducting these tests is to ensure cement slurry is placed safely and efficiently at the zones of interest.
Temperature affect the rheological properties of cement slurry, as well as the thickening time and compressive strength. Important features such as bottom hole circulating temperature, yield point and plastic viscosity decline with an increase in temperature. If pressure is not accurately anticipated, the casing and cement sheath may not be able to withstand the pressure from the rock formation and this can lead to a total collapse of the wellbore (Wilcox et-al, 2016).
II.THICKENINGTIME
Thickening time is a measurement of the time during which a cement slurry remains in a fluid state and is capable of being pumped. Thickening time is assessed under simulated downhole conditions using HPHT consistometer that plots the consistency of a slurry over time at the anticipated temperature and pressure conditions as precisely as possible. The end of the thickening time is considered at 50 or 70 Bc for most applications (Oilfield glossary, 2018).
Premature thickening can have disastrous consequences due to loss of circulation in the well. Thickening times that are too long can cause financial losses due to excessive Wait-On-Cement (WOC) times between drilling periods. The test is usually performed at bottom hole circulating temperature (BHCT) and pressure (BHP).
There are some other factors that affect the pumpability of the slurry, but are very difficult to simulate when determining the thickening time of
the slurry. Such factors include fluid
contamination, fluid loss to formation, unforeseen temperature variations and unplanned shutdowns in pumping (Shahriar, 2011). The thickening time is usually controlled by using cement additives known as retarders and accelerators.
Plate 1: HPHT consistometer
III.BOTTOMHOLECIRCULATING
TEMPERATURE
The bottom hole circulating temperature is the temperature of the circulating fluid (air, mud, cement or water) at the bottom of the wellbore after several hours or volume of circulation. That is, BHCT is the temperature of the well while fluid in the well is being circulated. This temperature is lower than the bottom hole static temperature (BHST). BHCT is important in the design of cement slurries for cementing casing because the setting time for cement depends on temperature.
This is the temperature used for most tests of cement in a liquid state. In most cases, the BHCT is lower than the bottom hole static temperature (BHST), but in some cases, such as in deep water or in the arctic, the BHCT may be higher than the BHST (Oilfield glossary, 2018).
Temperature is one of the major factors that affect the hydration of cement. The hydration rate of the cement and the nature, stability and morphology of the hydration products are strongly dependent upon this parameter (Nelson, 1990). As temperature increases, cement slurry hydrates and set faster. It also develops compressive strength faster and thickening time is decreased.
IV.BOTTOMHOLEPRESSURE
There is need to design cement slurry to be able to withstand pressure from the rock formation. If pressure is not accurately evaluated, the casing and cement sheath may not be able to withstand the pressure and this can lead to a total collapse of the
wellbore (Boma et al., 2016). According to Smith
(1989), pressure imposed on a cement slurry by the hydrostatic load of well fluids also reduces the pumpability of cement. In some deep wells, the combination of hydrostatic pressure and surface pressure during cement slurry placement may exceed 20,000psi.
The cement slurry physical state progresses from liquid immediately after its placement in the annular space between casing and formation, transmitting its hydrostatic pressure to a gel after a certain period (known as transition time) under static conditions.
V.SELECTIONOFCEMENTSLURRY
SYSTEMS
Cement slurry systems are selected based on well objectives and requirements. Cementing systems vary in their capability to provide good zonal isolation in changing environments. The traditional approach to cement slurry design has been on the basis that higher compressive strengths result in higher cement sheath quality (Crook, 2001). However, studies have shown that the ability of cement to provide good zonal isolation is better defined by other mechanical properties. Good isolation does not necessarily require high compressive strength. According to Crook et al (2001), the real competence test is whether the cement system in place can provide zonal isolation for the life of the well. The following strengths are applicable from traditional rule of thumb:
i. 5 – 200psi to support casing
ii. 500psi to continue drilling
iii. 1000psi to perforate
iv. At least 2000psi to stimulate and isolate
zone
VI.METHODOLOGY
The methods of testing cement for downhole application are based on performance testing. Although, other standards such as those of the American Standard for Testing Materials (ASTM) and the Construction Specification Institute (CSI) exist, testing methods are usually performed according to American Petroleum Institute (API) specifications, though specifically designed and engineered equipment or tests are also used. The choice of additives and testing criteria is dictated primarily by the specific parameters of the well to be cemented. Performance testing has proven to be the most effective in establishing how a slurry will
behave under specific well conditions
(Petrowiki.org, 2015). In performance testing, thickening time of cement slurries are tested at the
highest simulated bottom hole circulating
temperature and actual bottom hole pressure.
The thickening time tests were conducted separately
at 80oF and 120oF while varying pressures between
0psi and 20,000psi respectively.
VII.PROCEDUREFORCONDUCTINGTHE
THICKENINGTIMETEST
The pressurized consistometer was started and the slurry cup containing the mixed cement slurry was gently placed in the consistometer cup and rotated slowly until the bottom cell cap engages to the drive table. This was done within 5 minutes of preparing the cement slurry. After this, the consistometer motor was turned on and the drive table started rotating at 150rpm. The potentiometer was then placed on the rotating slurry cup. As soon as the potentiometer engaged correctly, an initial consistency reading proportional to the viscosity of the cement slurry was observed. Once this was done, the consistometer head was carefully lowered into the HPHT chamber and spined down to lock.
The gland nut fitting was inspected and the thermocouple was inserted through the port in the center of the consistometer head. The gland nut was tightened by hand, the air exhausted and pressure release valve were closed and the air supply valve opened (allowing air to pass from the reservoir into the consistometer pressure chamber). The chamber was filled with oil and air was observed to be coming out from the gland nut. Following the air from the gland nut was oil. The gland nut was tightened with a wrench as soon as steady oil flow appeared at the connection.
The controller was thereafter programmed using the laboratory calculation sheet to perform the test in line with the design parameters (ramp time, temperature and pressure). The heater switch was turned on and the timer clock reset and the test started. The test was also periodically checked to ensure it was running as programmed.
The controller was stopped at the end of the test. The front door of the consistometer was opened to allow the consistometer cool down. As soon as cooling was achieved, pressure was released from the system. Oil was drained and the consistometer was opened. The potentiometer was then removed and the slurry cup was removed as well. The consistometer head was then returned to the chamber to prevent dust from entering. This was followed by the disassembly of the slurry cup, pouring of the
slurry from the slurry cup and washing of the slurry cup.
VIII.RESULTSANDDISCUSSION
The results of the experiments conducted are presented in the Table below. The Table shows the
results of the tests conducted at 80oF and 120oF
respectively. These tests were conducted by pressures varying between 0psi to 20,000psi.
Results of the tests at 80oF show that the
thickening time (TT) of cement slurry decreases as pressure increases. A similar trend was observed
for the test conducted at 120oF. In addition to this,
comparing the thickening time at specific pressures
for temperatures at 80oF and 120oF shows that the
cement sets faster at 120oF to 80oF. For example,
the thickening time at 80oF and 20,000psi was
40mins at 40BC while the thickening time at 120oF
and 20,000psi is 31mins. These results
demonstrate the effect of temperature and pressure on the thickening time of cement slurry.
IX.TABLE1.0-THICKENINGTIMETESTS
RESULTS
Pressure (psi)
Thickening Time at 70BC (mins)
at 80oF at 120oF
0 225 213
2000 194 176
4000 175 165
6000 147 139
8000 119 109
10000 105 103
12000 91 84
14000 85 76
16000 71 59
18000 57 47
20000 51 41
X.ANALYSISOFRESULTS
The results above were analyzed using the multiple regression model of the SPSS statistical analysis software. Multiple linear regression is a model for demonstrating the relationship between a dependent variable and a collection of
independent variables (predictors). Linear
pressure while the dependent variable is thickening time. Hence, the regression equation is presented below:
Ŷ = βo + β1X1 + β2X2 (1)
Where:
Ŷ = the predicted value of an observation (thickening time)
βo = the Y-intercept (the value of when all X’s = 0)
β1, β2 = the unstandardized regression coefficients
for the predictors
X1, X2 = values of the predictors
The results above were entered into SPSS and after the simulation, the output results were obtained. These results will be discussed one after the other.
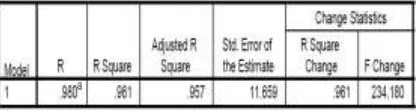
XI.MODELSUMMARY
This model gives the value of the coefficient of
determination, R-square (R2). The R2 will always
lie between 0 and 1, where a higher R2 indicates a
better model fit. Here we can see from the model
that R2=0.961. Since the multiple correlation is
0.961, it means the two variables, temperature and pressure, have a strong relationship with
thickening time. The adjusted R2 tells us that our
model accounts for 95.7% of variance in the predictors (temperature and pressure) in the model.
XII.ANALYSISOFVARIANCE(ANOVA)
The ANOVA table presents the result of the F-test and p-value. This table assesses the overall significance of the model. The F-test helps to determine if the model is a good fit for the data. From the above, the f-test is 234.2 while the p-value is 0. Since the p-value of p is less than 0.0005, it can be concluded that the model is statistically significant. A large f value and a small p value suggests that a predictor variable (temperature or pressure) is having a large impact on the thickening time. The mean square column shows that very much more of the variance is explained by the regression line than by the Residual (31834.475 compare to 135.940). This reinforces the conclusion that the model is good.
XIII.COEFFICIENTSTABLE
The coefficients table gives the beta
coefficients so that one can construct the regression equation. The standardized Beta coefficients give a measure of the contribution of each variable to the model (measured in standard deviation units of the target variable). From the Table below, pressure is contributing 0.976 (97.6%) while temperature is contributing 0.089 (8.9%) to the model. Also, for pressure, the t value of -21.551 and associated sig. of 0.000 (i.e. p < 0.0005) shows that the regression is statistically significant. However, for temperature, the t value of -1.975 and associated sig. value of 0.063 (i.e. p = 0.063) is just above p = 0.05 so one cannot rule out the possibility that the true value of temperature in the equation is zero, although this is unlikely.
The unstandardized coefficients are used in the prediction and interpretation. These are the values that are required for an equation that includes the two predictors - temperature and pressure. For this case, the equation for the regression line will be:
Thickening Time (mins) = 224.3 – 0.008 Pressure
– 0.245 Temperature (2)
Using this equation and given the values of temperature and pressure, it will be possible to come up with a prediction for the thickening time of cement slurries. As an example, assuming temperature is 100 deg F and pressure is 2000psi, the thickening time can be computed to be 183.8mins.
XIV.NORMALITYTEST(MULTIPLE
VARIABLES)OUTPUT
XV.NORMALP-PPLOTOFREGRESSION
STANDARDIZEDRESIDUAL
Another way to look at the distribution of the data is by using the Normal P-P plot. In this study, the points lie along the straight line and show no pattern; therefore, the thickening time data distribution can be concluded as normal.
XVI.CONCLUSIONAND
RECOMMENDATION
Cement systems require special design attention, modified testing procedures and special systems. Accurate data collection is key to a successful job design. Cement tests are done in the cementing laboratory using the pressure and temperature at well total depth. It is also recommended to utilize the maximum temperature in the annular space where the cement slurry is going to be placed during the temperature simulation. Whatever the case might be, it is imperative to understand the combined effect of temperature and pressure on cement slurry during and after placement. This study has been able to demonstrate that thickening time of cement slurry reduces as temperature and pressure increases.
It is recommended that further studies be carried out at a wider temperature range in order to
effectively model the combined effect of
temperature and pressure on the thickening time of cement slurry.
XVII.ACKNOWLEDGEMENT
This research work was supported by the World Bank Africa Centre of Excellence in Oilfield Chemicals Research (ACE-CEFOR), University of Port Harcourt, Nigeria. The authors wish to express their sincere thanks to World Bank for the support.
XVIII.REFERENCES
[1] R. J. Crook, G. Benge, R. Faul and R. R. Jones, Eight Steps to Ensure Successful Cement Jobs, Oil & Gas Journal, Pp. 16-17, 2001.
[2] E. B. Nelson, J. F. Baret, and M. Michaux, Cement Additives And Mechanism Of Action, In: E.B. Nelson (Ed.), Well Cementing, Elsevier Science Publishers, Amsterdam, pp. 3, 37. 1990.
[3] Petrowiki.org, Cement Slurry Design Testing, https://petrowiki.org/Cement_slurry_design_testing, 2015. [4] A. Shariar, Investigation on Rheology of Oil Well Cement
Slurries, Thesis, School of graduate Studies, The University of Western Ontario, pp. 18. 2011.
[5] Schlumberger, High Temperature High Pressure (HPHT), http://www.glossary.oilfield.slb.com/Terms/h/hpht.aspx. [6] T. R. Smith, and R. J. Crook, Investigation of Cement
Preflushes for a KCl-Polymer Mud, presented at the 33rd Annual Technical Meeting of the Petroleum Society of CIM, Calgary, 1982.