www.orientjchem.org
An International Open Free Access, Peer Reviewed Research Journal
2018, Vol. 34, No.(5): Pg. 2435-2439
This is an Open Access article licensed under a Creative Commons Attribution-Non Commercial-Share Alike 4.0 International License (https://creativecommons.org/licenses/by-nc-sa/4.0/), which permits unrestricted Non Commercial use, distribution and reproduction in any medium, provided the original work is properly cited.
Data on the Microstructure and Passivation Behavior for Austenitic
nickel-chromium (NO7718) and Nickel-chromium-aluminum-iron
(NO7208) Nickel alloys in Corrosive media
ROLAND TOLULOPE LOTO
Department of Mechanical Engineering, Covenant University, Ota, Ogun State, Nigeria. *Corresponding author E-mail: tolu.loto@gmail.com
http://dx.doi.org/10.13005/ojc/340527
(Received: June 21, 2018; Accepted: August 26, 2018)
ABSTRACT
Potentiodynamic polarization data for nickel alloys N07718 and N07208 in 2M H2SO4 solution
at 0% - 5% NaCl concentrations are presented in tabular form showing the qualitative relationship between the corrosion resistance, passivation behavior and interfacial redox reactions of the alloys with the increase in chloride ion concentration. Tafel plots from the polarization test are presented to show the anodic-cathodic transition curves with respect to variable applied potential and scan rate. Data on open circuit potential measurement for the 1200s showed the active-passive behavior of both alloys and their thermodynamic stability in the acid solution. Optical micro-analytical images of the alloys before corrosion and at 0%, 0.5% and 5% NaCl after corrosion are presented for morphological and comparative analysis.
Keywords: Corrosion, Pitting, Passivation, Steel.
INTRODUCTION
Austenitic nickel-chromium (NO7718) and nickel-chromium-aluminum-iron (NO7208) alloys are wrought, gamma-prime strengthened and high-performance alloys with excellent attributes including good mechanical strength, resistance to thermal creep deformation, excellent surface stability, and very high resistance to corrosion. As a result they have extensive applications in extreme environments such as high temperature structural applications in aero and industrial gas turbine engines, compressor, combustor, industrial piping and vessels, rocket motors and thrust reversers, nuclear fuel element spacers, hot extrusion tooling, high strength bolting,
down hole shafting and constructional structures where they are exposed majorly to pitting corrosion. The corrosion resistance of these alloys results from the formation of a thin passive film, whose durability is the product of the metallurgical constituents of the alloys and anionc attack from their environment of application. Breakdown of the passive film in the presence of halides and the resulting localized corrosion is one of the important factors responsible for failure of this alloys1-5.
EXPERIMENTAL METHODS
have nominal (wt.%) composition shown in Table 1. The super-alloy specimens were machined and sectioned to dimensions (width and length) of 0.4 cm by 1 cm, after which grinded with silicon carbide papers (80, 320, 600, 800 and 1000 grit). They were subsequently cleansed with distilled water and acetone, and kept in a desiccator for potentiodynamic polarization test and open circuit
potential measurement according to ASTM G1 - 036. Recrystallized NaCl obtained from Titan Biotech, India was prepared in volumetric concentrations of 0%, 0.5%, 1%, 1.5%, 2%, 2.5%, 3%, 3.5%, 4%, 4.5% and 5% in 200 mL of 2M H2SO4 solution, prepared from analar grade of H2SO4 acid (98%)
with deionized water.
Table 1: Nominal Composition (wt. %) of N07718 and N07208
Element Symbol Cu Si Ni Cr Mn P S C Co Al Ti Mo Fe
% Composition (N07718) 0.3 0.35 51 18 0.35 0.04 0.05 0.08 0.8 0.3 1.1 3 24.72 % Composition (N07208) - 0.15 56 20 0.3 - - 0.06 10 1.5 2.1 8.5 1.5
Polarization tests were performed at 30OC
with Digi-Ivy 2311 electrochemical workstation attached to a triple electrode system (working, counter and reference electrodes) within a glass cell containing 200 mL of the test electrolyte with. UNS N07718 and N07208 sample electrodes mounted in acrylic resin with exposed surface areas of 0.4cm2
were prepared according to ASTM G59-97(2014)7.
Tafel plots were obtained at a scan rate of 0.0015V/s between potentials of −0.75V and +1.5V according to ASTM G102-89(2015)8. Corrosion rate (d) was
calculated from the formular;
(1)
Jcr is the current density in A/cm2, D is
the density in g/cm3; E
qv is the sample equivalent
weight in grams. 0.00327 is a constant for corrosion rate calculation in mm/y9. Open circuit potential
measurement (OCP) were obtained at a step potential of 0.05V/s using acrylic mounted UNS N07718 and N07208 sample electrodes (exposed surface of 0.4 cm2) and Ag/AgCl reference electrodes
attached to Digi-Ivy 2311 potentiostat according to ASTM G69 – 12(2012)10. The working electrodes
samples were fully immersed in 200 ml of the test media at NaCl concentrations of 0%, 0.5% and 5% for 1200s. Optical images of UNS N07718 and N07208 samples before, and after corrosion at 0%, 0.5% and 5% NaCl were obtained and analysed after polarization test with Omax trinocular through the aid of Toup Cam analytical software.
RESULTS AND DISCUSSION
Potentiodynamic polarization studies
The anodic-cathodic polarization plots for NO7718 and NO7208 alloys in 2M H2SO4/ 0% - 5%
Table 2: Potentiodynamic polarization data for NO7718 in 2M H2SO4/0% - 5% NaCl concentration
Sample NaCl Corrosion Corrosion Corrosion Current Corrosion Polarization Cathodic Anodic
Conc. Rate Current Density Potential Resistance, Tafel Tafel
(%) (mm/y) (A) (A/cm2) (V) R
p Slope (Bc) Slope (Ba)
A 0 2.44 9.34E-05 2.33E-04 -0.080 275.20 -9.660 -3.867
B 0.5 2.07 7.91E-05 1.98E-04 -0.108 324.80 -9.718 -1.684
C 1 1.63 6.23E-05 1.56E-04 -0.108 412.40 -9.684 2.226
D 1.5 1.48 5.65E-05 1.41E-04 -0.081 455.00 -11.770 5.819
E 2 1.03 3.93E-05 9.82E-05 -0.092 654.20 -9.372 6.374
F 2.5 0.99 3.78E-05 9.45E-05 -0.090 884.30 -11.570 7.822
G 3 0.94 3.59E-05 8.98E-05 -0.116 888.60 -9.633 17.670
H 3.5 0.89 3.41E-05 8.52E-05 -0.134 754.30 -7.673 21.150
I 4 0.89 3.42E-05 8.54E-05 -0.125 752.10 -10.180 17.190
J 4.5 0.87 3.34E-05 8.35E-05 -0.165 760.80 -10.630 18.447
K 5 0.87 3.33E-05 8.33E-05 -0.105 771.10 -10.020 19.900
Table 3: Potentiodynamic polarization data for NO7208 in 2M H2SO4/ 0% - 5% NaCl concentration
Sample NaCl Corrosion Corrosion Corrosion Current Corrosion Polarization Cathodic Anodic Conc. Rate Current Density Potential Resistance, Tafel Tafel
(%) (mm/y) (A) (A/cm2) (V) R
p Slope (Bc)Slope (Ba)
A 0 1.02 3.97E-05 9.93E-05 -0.009 646.90 -8.112 -4.392
B 0.5 0.47 1.84E-05 4.59E-05 -0.064 1400.00 -8.507 -2.026
C 1 0.35 1.36E-05 3.41E-05 -0.094 1833.00 -10.080 0.578
D 1.5 0.60 2.33E-05 5.81E-05 -0.111 1105.00 -8.126 1.467
E 2 0.52 2.01E-05 5.02E-05 -0.104 1280.00 -10.020 0.063
F 2.5 0.38 1.47E-05 3.68E-05 -0.123 1744.00 -10.070 4.147
G 3 0.30 1.18E-05 2.95E-05 -0.096 2179.00 -10.030 8.595
H 3.5 0.25 9.60E-06 2.40E-05 -0.136 2676.00 -10.030 6.002
I 4 0.43 1.69E-05 4.22E-05 -0.108 1522.00 -8.503 2.509
J 4.5 0.40 1.54E-05 3.85E-05 -0.160 1667.00 -9.716 3.312
K 5 0.29 1.14E-05 2.86E-05 -0.083 2250.00 -10.120 7.816
(a)
Fig. 1. Anodic-cathodic polarization plots of the nickel alloys in 2M H2SO4/0% - 5% NaCl concentration (a) NO7718, (b) NO7208
Open circuit potential measurement
The OCP plots of corrosion potential versus exposure time for NO7718 and NO7208 nickel alloys Fig. 2(a) and (b) at 0% NaCl without applied potential started at -0.058V and -0.001V (0s). The plot for NO7718 increase steeply in the anodic direction from cathodic potentials till 1200s, whereas the plot for NO7208 increased steeply within the passive state for 100s to 0.080V after which there was a mild increase till about 800s at 0.043V. Beyond this point the anodic shift in corrosion potential for NO7208 increased steeply till 1200s. At 0.5% NaCl, NO7718 showed relative stability till the end of the
exposure hours whereas NO7208 progressively increased to 0.030V at 1200s. Variation in NO7718 OCP potentials at 5% NaCl concentration shows a significant cathodic shift starting at -0.154V at 0s compared to -0.058V and -0.108V at 0% and 0.5% NaCl concentration. No cathodic shift was observed for NO7208 at 5% NaCl due to its similar potential variation with at 0.5% NaCl till 400s after which relatively stable potential variation was observed. The OCP results shows NO7718 is more electronegative, thus thermodynamically stable at more active potentials than NO7208 whose OCP values are in the passive state due its thermodynamic stability at lower tendencies to corrode.
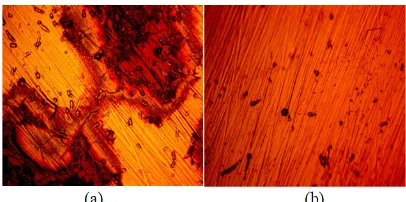
Micro-analytical studies
Micro-analytical images of NO7718 and NO7208 surface morphology before corrosion, and after corrosion at 0%, 0.5% and 5% NaCl concentration are shown from Fig. 3(a) to 6(b). Changes in NO7208 morphology tends to be mild and in effect negligible with respect to its corrosion resistance and morphological deterioration which is in agreement with the data from potentiodynamic polarization. The optical images of NO7718 after corrosion showed a slightly etched morphology with visible superficial dark surface film at major portions of the alloy.
Fig. 3. Micro-analytical images of nickel alloy specimens at mag. x40 from 2 M H2SO4 before corrosion (a) NO7718 and (b) NO7208
Fig. 4. Micro-analytical images of nickel alloy specimens at mag. x40 from 2 M H2SO4/0% NaCl corrosion (a) NO7718
and (b) NO7208
Fig. 5. Micro-analytical images of nickel alloy specimens at mag. x40 from 2 M H2SO4/0.5% NaCl corrosion (a) NO7718
and (d) NO7208
Fig. 2. Plot of corrosion potential versus exposure time for nickel alloy specimens 2 M H2SO4/0% - 5% NaCl concentration (a) NO7718, (b) NO7208
Fig. 6. Micro-analytical images of nickel alloy specimens at mag. x40 from 2 M H2SO4/5% NaCl corrosion (a) NO7718
and (d) NO7208
CONCLUSION
NO7208 proves to be more resistant to corrosion compared to NO7718 with respect to increase in NaCl concentration. NO7718 shows relatively weak resistance to metastable pitting
causing delayed passivation of the alloy in the acid chloride media while NO7208 displayed strong resistance to pitting at the transpassive region due to its higher nickel and molybdenum. This observation is confirmed from the higher anodic Tafel slopes of NO7718. The OCP results shows NO7718 is more electronegative, thus thermodynamically stable at more active potentials than NO7208 whose OCP values are in the passive state due its thermodynamic stability at lower tendencies to corrode. Optical microscopic studies shows both alloys are highly resistant to pit formation however the presence of superficial brown oxide occurred on NO7718.
ACKNOWLEDGEMENT
The Author Acknowledges Covenant University Ota, Ogun State, Nigeria for the sponsorship and provision of research facilities for this project.
REFERENCES
1. McCafferty, E. Corros. Sci., 2003, 45, 1421-1438.
2. Abdel Rehim, S.S.; Hassan, H.H.; Amin, M.A. Corros. Sci., 2004, 46, 1921-1938.
3. Loto, R.T.; Loto, C.A. J Fail. Anal. and Preven.,
2017, 17(4), 672–679.
4. Loto, R.T.; Loto, C.A. J. Mater. Res. Technol., 2017. doi.org/10.1016/j.jmrt., 2017, 07, 004.
5. Loto, R.T. J. Mater. Environ. Sci., 2013, 4(4),
448-459.
6. ASTM G1 – 03. Standard Practice for Preparing, Cleaning, and Evaluating Corrosion Test Specimens, 2011. http://www.astm.org/ Standards/G1.
7. ASTM G59 – 97 (2014). Standard Test Method
for Conducting Potentiodynamic Polarization Resistance Measurements. http://www.astm. org/Standards/G31.
8. ASTM G102 – 89 (2015)e1. Standard Practice for Calculation of Corrosion Rates and Related Information from Electrochemical Measurements. http://www.astm.org/ Standards/G31.
9. Choi, Y.; Nesic, S.; Ling, S. Electrochim. Acta.,
2011, 56(4), 1752-1760.