www.nat-hazards-earth-syst-sci.net/12/1/2012/ doi:10.5194/nhess-12-1-2012
© Author(s) 2012. CC Attribution 3.0 License.
and Earth
System Sciences
Orientation effects of horizontal seismic components on longitudinal
reinforcement in R/C frame elements
K. G. Kostinakis, A. M. Athanatopoulou, and I. E. Avramidis
Aristotle University of Thessaloniki, Thessaloniki, Greece Correspondence to: A. M. Athanatopoulou ([email protected])
Received: 28 February 2011 – Revised: 4 October 2011 – Accepted: 31 October 2011 – Published: 2 January 2012
Abstract. The present paper investigates the influence of
the orientation of recorded horizontal ground motion com-ponents on the longitudinal reinforcement of R/C frame ele-ments within the context of linear response history analysis. For this purpose, three single-story buildings are analyzed and designed for 13 recorded bi-directional ground motions applied along the horizontal structural axes. The analysis and design is performed for several orientations of the recording angle of the horizontal seismic components. For each ori-entation the longitudinal reinforcement at all critical cross sections is calculated using four methods of selecting the set of internal forces needed to compute the required reinforce-ment. The results show that the reinforcement calculated by three of the applied methods is significantly affected by the orientation of the recording angle of ground motion, while the fourth one leads to results which are independent of the orientation of the recording angle.
1 Introduction
Modern seismic codes (ASCE 41-06, EAK 2003, FEMA 356, FEMA P-750) suggest linear time history analysis as one of the methods that can be used for the seismic analy-sis and design of R/C structures. According to this method, a spatial model of the structure is analyzed using simultane-ously imposed consistent pairs of earthquake records along the two horizontal structural axes (with a few exceptions, the vertical component of the ground motion is allowed to be ig-nored as its influence on seismic response is considered neg-ligible). Alternatively, the structure is analyzed separately for each horizontal component, applied along each structural axis, and then the action effects are combined by the percent-age (30 %) combination rule.
In most strong-motion databases, the horizontal compo-nents of the ground motion are given along the orientation they were recorded for. Thus, the orientation of the recorded
seismic components is predetermined by the orientation of the recording instrument, which is in general arbitrary (Beyer and Bommer, 2007). However, the horizontal acceleration time histories are changed when they are rotated around the vertical axis or when the orientation of the sensor is changed. It has been shown (Kostinakis et al., 2009) that the struc-tural response (i.e. axial stress at columns, bending moments at beams) is strongly affected by the recording angle of the ground motion (i.e. the orientation of the recording instru-ment) and the recording angle that yields the maximum re-sponse does not coincide with the orientation the accelero-grams have recorded if the structural response is computed for accelerograms applied along the structural axes.
Concerning the design value of a response parameter com-puted by time history analysis, all seismic codes suggest that the maximum value of the response to the individual pairs is used for design if 3 pairs of accelerograms are used. If the response is computed for 7 or more records, the average of the response values to the individual records is used for design purposes. However, the codes do not clarify how we can select the sets of internal forces (response parameters) in the case that more than one response parameter is needed in order to determine the required reinforcement (e.g. the lon-gitudinal reinforcement at a column of a R/C building).
The purpose of the present paper is to investigate the influ-ence of the orientation of recorded horizontal ground motion components on the longitudinal reinforcement of R/C frame elements, within the framework of linear response history analysis. As seismic codes do not clearly specify how to se-lect the set of internal forces needed to compute the columns’ longitudinal reinforcement, four different methods of selec-tion are applied. The first method, which is proposed by the authors, utilizes the simultaneous internal forces correspond-ing to maximum normal stresses over all seismic incident an-gles in every relevant cross section. Furthermore, three other methods of selecting the sectional forces, which, according to authors’ opinion are compatible with code provisions, are
25
1
2
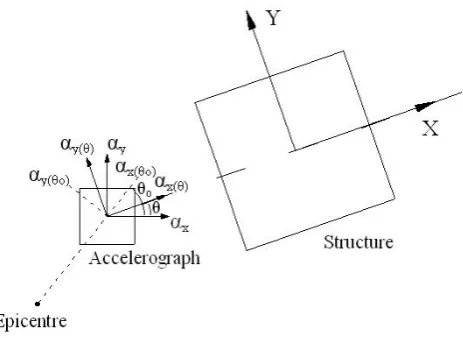
Figure 1. Recording angle of the ground motion and orientation of building structural axes.
3
Fig. 1. Recording angle of the ground motion and orientation of building structural axes.
used. These three methods utilize the internal forces pro-duced by accelerograms applied along the structural axes as codes specify. The first one utilizes the maximum, non-simultaneous values of internal forces, the second one the maximum values produced by 30 % rule, and the third one the simultaneous values of internal forces corresponding to maximum normal stresses (see Sect. 4) for only one orien-tation of accelerograms. Three single-story buildings sub-jected to 13 strong earthquake ground motions are analyzed and designed. The seismic motion is represented by: (i) the two horizontal recorded components; (ii) the recorded com-ponents transformed to other sets of axes forming an angle
θ=30◦, 60◦,. . . ,360◦with respect to the initial ones and (iii) the recorded accelerograms transformed to the principal di-rections of the ground motion. For all these cases the lon-gitudinal reinforcement at all critical cross sections is calcu-lated using the four methods. The analyses results show that the reinforcement calculated by three of the applied meth-ods is significantly affected by the orientation of the recorded ground motion components, while the fourth method leads to results which do not depend on the orientation of the seismic input.
2 Principal directions of horizontal seismic components
In most strong-motion databases, the horizontal components of the ground motion are given along the orientation they were recorded for. Thus, the orientation of the recorded seis-mic components is predetermined by the orientation of the recording instrument (accelerograph), which is in general ar-bitrary (Fig. 1).
Letαx(t) andαy(t) represent the recorded ground acceler-ation time histories at the position of the accelerograph along the axes x and y, respectively. The same ground motion can be represented by componentsαx(θ )(t) andαy(θ )(t) along
an-other set of horizontal axes, which is defined by the angle
θ with regard to the accelerograph axes x and y (Fig. 1). In other words, if the accelerograph had another orientation (e.g. x(θ ), y(θ )) it would record the acceleration time his-toriesαx(θ ) andαy(θ ). These components can be computed (Penzien and Watabe, 1975) with the aid ofαx andαy by using Eq. (1):
αx(θ )(t )
αy(θ )(t )
=
cosθ sinθ
−sinθcosθ
·
αx(t )
αy(t )
(1) whereαx(t), αy(t) are the recorded horizontal acceleration time histories along the axes x and y and αx(θ )(t), αy(θ )(t) are the components of the transformed record when rotated counterclockwise by an angleθ(Fig. 1). In general, the two componentsαx,αy or αx(θ ),αy(θ )are correlated. The cor-relation factor ρ is given (Penzien and Watabe, 1975) by Eq. (2):
ρ= σxy
(σxxσyy)1/2
,withσij= 1
s
s
Z
0
αi(t )·αj(t )dt;i,j=x,y (2)
whereσxx, σyy are quadratic intensities ofαx(t) and αy(t) respectively; σxy is the corresponding cross-term; s is the duration of the motion.
There is, however, a specific set of horizontal orthogonal axes, defined by the angleθ0(Fig. 1), along which the
cor-relation coefficientρbetween the horizontal components of the ground motion is zero (Penzien and Watabe, 1975). The axes specified by angleθ0represent the principal directions
of the ground motion. The angleθ0is computed (Penzien
and Watabe, 1975) by Eq. (3): tan2θ0=
2σxy
σxx−σyy
. (3)
3 Maximum response under bi-directional excitation
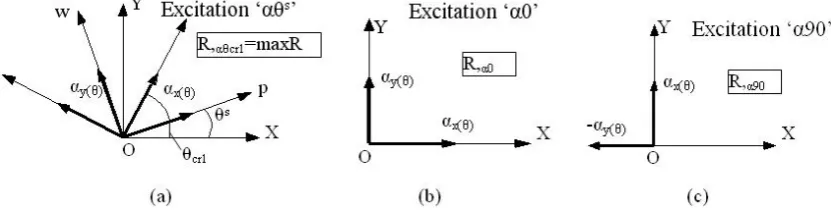
The earthquake-induced translational motion at a specific point of the ground is recorded along two horizontal direc-tions and one vertical. However, with a few exceptions, the vertical component of the ground motion is allowed to be ignored as its influence on seismic response is consid-ered negligible. Assume a structure which is subjected to bi-directional horizontal seismic motion represented by the recorded accelerograms αx(θ )(t) and αy(θ )(t) along the or-thogonal axes p and w. As the direction of the seismic mo-tion is unknown, the axes p and w can form any angleθswith respect to the structural axes X and Y, respectively (Fig. 2a). Clearly, the structural response is a function of the seismic in-cident angleθs. Each response parameterRattains its max-imum value maxR for a specific seismic incident angleθcr1
(Fig. 2a). The maximum value maxR and the corresponding critical angleθcr1are computed according to the following
procedure (Athanatopoulou, 2005):
26
1
2
Figure 2. Excitations ‘
αθ
s’, ‘
α
0’and ‘
α
90’.
3
Fig. 2. Excitations “αθs”, “α0” and “α90”.
– Compute the response due to excitation “α0” (Fig. 2b): The accelerogramsαx(θ )(t) andαy(θ )(t) are applied si-multaneously along the axes X and Y, respectively, i.e. the angle of seismic incidence isθs=0◦. A typical response quantity is denoted asR,α0.
– Compute the response due to excitation “α90” (Fig. 2c): The accelerogramsαx(θ )(t) andαy(θ )(t) are applied si-multaneously along the axes Y and X, respectively, i.e. the angle of seismic incidence isθs= 90◦. A typ-ical response quantity is denoted asR,α90.
– The maximum value of a response parameter over all
seismic incident angles is given as a function of time by Eq. (4) (Athanatopoulou, 2005):
R0(t )= [R,2α0(t )+R,2α90(t )]1/2. (4)
The plot of the function ±R0(t) provides the
maxi-mum/minimum value of the required response parameter as well as the time instant tcrat which this maximum/minimum
occurs (Fig. 3):
maxR= +R0(tcr), minR= −R0(tcr). (5)
The corresponding critical anglesθcr1(maximum value) and θcr2(minimum value) are given by Eq. (6):
θcr1=tan−1
R,
α90(tcr) R,α0(tcr)
,θcr2=θcr1−π . (6)
It must be noted that the maximum value maxR is computed without the previous determination of angleθcr1. Moreover,
the value of any response parameterRdue to seismic motion “αθs” (Fig. 2a) can be computed by the following equation (Athanatopoulou, 2005):
R,αθs(t )=R,α0(t )·cosθs+R,α90(t )·sinθs. (7)
4 Methods of selecting the sectional forces
In the present section, four methods of selecting the set of internal forces needed for the calculation of the longitudinal
27 1
2
Figure 3. Responses R0(t) and –R0(t).
3
Fig. 3. Responses R0(t) and –R0(t).
1
2
Figure 4. Local reference system of a cross section showing internal forces and normal
3
stresses.
4
Fig. 4. Local reference system of a cross section showing internal forces and normal stresses.
reinforcement in concrete frame elements within the context of linear response history analysis are presented. The first method is proposed by the authors since it is considered as the most rational. According to this method, the maximum axial stresses at any relevant cross section due to any incident angle of the ground motion are used in order to determine the combinations of the sectional forces required for the design of the structural elements. The axial stresses have been used in the past in order to determine the simultaneous internal
Table 1. Design combinations for method MSex.
maxσA N,maxσA Mξ,maxσA Mη,maxσA
minσA N,minσA Mξ,minσA Mη,minσA
maxσB N,maxσB Mξ,maxσB Mη,maxσB
minσB N,minσB Mξ,minσB Mη,minσB
maxσC N,maxσC Mξ,maxσC Mη,maxσC
minσC N,minσC Mξ,minσC Mη,minσC
maxσD N,maxσD Mξ,maxσD Mη,maxσD
minσD N,minσD Mξ,minσD Mη,minσD
forces needed for the design of R/C structures within the context of the response spectrum method (Gupta and Singh, 1977; Anastassiadis, 1993; Anastassiadis et al., 2002), since they were considered as the only quantity that adequately captures the response of a frame section under the simulta-neous action of axial force and bending moments.
In an attempt to interpret the seismic code provisions, three other methods of selecting the sectional internal forces are used. In the following subsections, the four methods of se-lecting the sectional forces in R/C frame elements are pre-sented.
4.1 Method of extreme stresses (MSex)
This method (denoted in the following as MSex)is proposed
by the authors and is based on the simultaneous values of in-ternal forces corresponding to the maximum/minimum value of normal stresses occurred at a frame section for any an-gle of seismic incidence (Kostinakis et al., 2011). Accord-ing to this method two response history analyses, under bi-directional excitation for incident angles θs=0◦ (Fig. 2b)
and θs=90◦ (Fig. 2c), are performed. The time histories of the response quantities N,α0(t),Mξ,α0(t) and Mη,α0(t) as
well as of N,α90(t),Mξ,α90(t),Mη,α90(t) at any relevant cross
section are computed. Then, the time histories of the nor-mal stresses (σA,α0(t), σB,α0(t), σC,α0(t), σD,α0(t) andσA, α90(t),σB,α90(t),σC,α90(t),σD,α90(t)) at the four corners A, B,
C and D of a rectangular cross section are calculated (Fig. 4). Finally, using Eqs. (4), (5) and (6), the maximum and min-imum values of the stresses, the associated critical incident angles θcr1 andθcr2, as well as the time instant tcr are
de-termined. The sectional forces corresponding to these max-imum and minmax-imum values of normal stresses (determined with the aid of Eq. 7) are used for design purposes. For the four corners of a rectangular cross section, a total number of eight unfavourable combinations results.
In Table 1 the eight unfavorable combinations produced by the proposed method are presented (the term after comma denotes corresponding to). These are the most unfavourable combinations of internal forces due to seismic loads. Then the effects of the vertical and the seismic loads are added and the final unfavorable design combinations of the internal
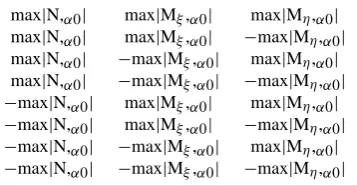
Table 2. Design combinations for method MFabs0.
max|N,α0| max|Mξ,α0| max|Mη,α0|
max|N,α0| max|Mξ,α0| −max|Mη,α0|
max|N,α0| −max|Mξ,α0| max|Mη,α0|
max|N,α0| −max|Mξ,α0| −max|Mη,α0|
−max|N,α0| max|Mξ,α0| max|Mη,α0|
−max|N,α0| max|Mξ,α0| −max|Mη,α0|
−max|N,α0| −max|Mξ,α0| max|Mη,α0|
−max|N,α0| −max|Mξ,α0| −max|Mη,α0|
forces are obtained. These combinations are used for the cal-culation of the required longitudinal reinforcement. Finally, the maximum value of the 8 reinforcing steel areas produced by the sets of internal forces presented in Table 1 is selected as the required one according to the MSexmethod.
4.2 Method of maximum absolute forces for angleθs=0◦ (MFabs0)
According to this method (denoted in the following as MFabs0), the acceleration loadsαx(θ )(t) andαy(θ )(t) are ap-plied simultaneously along the structural axes X and Y, respectively (excitation “α0”) (Fig. 2b) as codes specify. The maximum absolute values of the response parameters N,α0(t), Mξ,α0(t) and Mη,α0(t) are used for design purposes.
The sign of each parameter can be positive or negative. Any combination of these values can be considered as an unfavourable combination of the sectional internal forces. Hence, the eight unfavourable combinations of sectional in-ternal forces presented in Table 2 are produced. These are the most unfavourable combinations of internal forces due to seismic loads. Then, the effects of the vertical and the seis-mic loads are added and the final unfavourable design com-binations of the internal forces are obtained. These combina-tions are used for the calculation of the required longitudinal reinforcement. Finally, the maximum value of the 8 reinforc-ing steel areas produced by this method (MFabs0) is selected
as the required one on the basis of MFabs0 method.
4.3 Method of 30 % rule (M30)
According to this method, two response history analyses, for uni-directional inputs αx(θ )(t) and αy(θ )(t) along the struc-tural axes X and ϒ, respectively, are performed. The time histories of the response quantities due to each uni-directional excitation N,x(t), Mξ,x(t) and Mη,x(t), as well as N,y(t), Mξ,y(t), Mη,y(t) (the index after comma denotes due to excitation) at any relevant cross section are computed and their maximum absolute values are determined. Then the 30 % directional combination rule is applied in order to compute the maximum response. The sets of internal forces
for design purposes according to this method for any relevant cross section are presented in Table 3.
These are the most unfavorable combinations of inter-nal forces due to seismic loads. Then the effects of the vertical and the seismic loads are added and the final un-favourable design combinations of the internal forces are ob-tained. These combinations are used for the calculation of the required longitudinal reinforcement. Finally, the maxi-mum value of the 8 reinforcing steel areas produced by the M30 method is selected as the required one for the method under consideration.
4.4 Method of extreme stresses for angleθs=0◦(MSex0)
According to this method (denoted in the following as MSex0), the acceleration loadsαx(θ )(t) andαy(θ )(t) are ap-plied simultaneously along the structural axes X and Y, re-spectively (excitation “α0”) (Fig. 2b), as codes specify, and the time histories of the normal stressesσA,α0(t), σB,α0(t), σC,α0(t), σD,α0(t) at the four corners A, B, C, and D of a
rectangular cross section are computed (Fig. 4). Then, the maximum and minimum values of the stresses as well as the corresponding time instants t1 and t2 are determined. The
sectional forces N,α0(ti), Mξ,α0(ti), and Mη,α0(ti)(i=1,2), corresponding to maximum and minimum values of the nor-mal stresses, are considered for design purposes. Two un-favourable combinations of internal forces for each corner of a rectangular section are produced (one for the maximum ax-ial stress and one for the minimum axax-ial stress). Hence, for the four corners of the considered section, the eight unfavor-able combinations shown in Tunfavor-able 4 are produced. These are the unfavorable combinations due to seismic loads. Then the effects of the vertical and the seismic loads are added and the final unfavorable design combinations of the internal forces are obtained. These combinations are used for the calcula-tion of the required longitudinal reinforcement on the basis of MSex0 method. Finally, the maximum value of the 8
rein-forcing steel areas produced by MSex0 method is selected as
the required one for this method.
5 Structural models
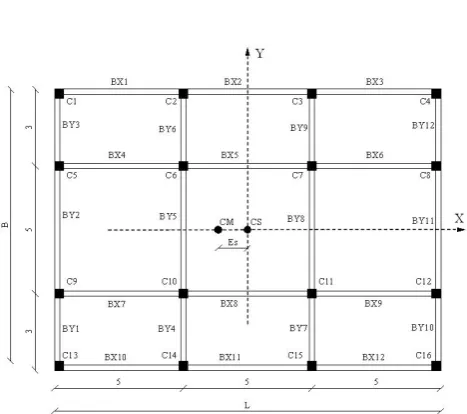
Three structural models are considered in this study. Each model represents a single-story, reinforced, concrete build-ing. The deck, rectangular in shape (L = 15 m, B = 11 m), is considered to be absolutely rigid in-plan and it is supported by four parallel plane frames in each direction (Fig. 5). The height of the story is 4 m. The concrete strength and the yield strength of the reinforcing steel are 20 MPa and 500 MPa, respectively. The modulus of elasticity is taken equal to E = 29 GPa and the damping ratio is assumed to beζ= 5 % for all vibration modes.
The cross sectional dimensions of beams and columns are 20/50(cm) and 35/35(cm), respectively. The first model is
a building with zero eccentricity (Es= 0, Es is the structural
eccentricity). For each one of the other two models, it is con-sidered that the Mass Centre CM is located on the X-axis at a distance Esfrom the Centre of Stiffness CS. Regarding the
mass eccentricity, two values were chosen: es= Es/L = 0.15
and es= Es/L = 0.30.
6 Ground motions
An ensemble of 13 pairs of horizontal ground motion records obtained from the PEER strong motion database (http://peer. berkeley.edu/smcat/) has been used as input ground motion for the analyses and design of the buildings presented in the previous section. The ground motions, which are chosen with the aid of the Appendix C of FEMA 440, have magni-tudes (Ms) between 5.7 and 7.4 and are not characterized by
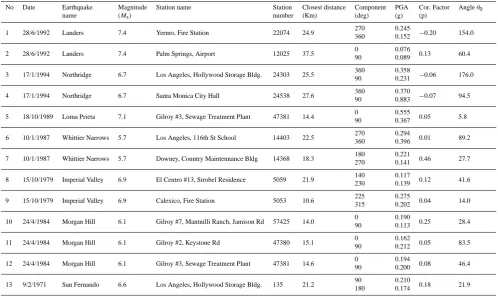
forward-directivity effects. The motions are recorded on Soil Type B according to the classification of the Greek Seismic Code (soil type D of FEMA 356). The input ground motions are shown in Table 5 along with the critical angle of ground motion (with regard to the recorded axes) and the correlation factor of the recorded components.
The accelerograms were scaled so as to match the de-sign spectrum of the Greek Seismic Code (EAK 2003) for Peak Ground Acceleration PGA = 0.36 g and behavior factor q = 3.5 according to the procedure suggested by ASCE 41-06. That is, each pair of accelerograms was scaled such that the SRSS of the 5 %-damped site-specific spectrum of the scaled horizontal components does not fall below 1.3 times the 5 %-damped design spectrum for periods between 0.2 T and 1.5 T (where T is the fundamental period of the build-ing).
7 Comparative assessment of numerical results
Each one of the three models considered in the present study was analyzed using the SAP2000 for the vertical loads as well as the seismic loads. The seismic analysis was per-formed by linear time history analysis using the two hori-zontal components of the ground motions shown in Table 5. Each ground motion was represented by: (i) the two hori-zontal recorded components; (ii) the recorded components transformed to other sets of axes forming an angle θ=30◦, 60◦,. . . ,360◦ with respect to the initial ones and (iii) the
recorded components transformed to the principal directions of the ground motion. For all these cases, the two horizon-tal accelerograms were imposed simultaneously along the structural axes and the longitudinal reinforcement at all crit-ical cross sections was calculated using the four aforemen-tioned methods. The required reinforcement was computed according to the Greek Code for the Design and Construction of Concrete Works. The constitutive laws adopted for steel and concrete are those suggested by the Eurocode 2 and by
Table 3. Design combinations for method M30.
max|N,x|+0.3max|N,y| max|Mξ,x|+0.3max|Mξ,y| max|Mη,x|+0.3max|Mη,y|
max|N,x|−0.3max|N,y| max|Mξ,x|−0.3max|Mξ,y| max|Mη,x|−0.3max|Mη,y|
–max|N,x|+0.3max|N,y| –max|Mξ,x|+0.3max|Mξ,y| –max|Mη,x|+0.3max|Mη,y|
–max|N,x|–0.3max|N,y| –max|Mξ,x|−0.3max|Mξ,y| –max|Mη,x|−0.3max|Mη,y|
0.3max|N,x|+max|N,y| 0.3max|Mξ,x|+max|Mξ,y| 0.3max|Mη,x|+max|Mη,y|
0.3max|N,x|-max|N,y| 0.3max|Mξ,x|−max|Mξ,y| 0.3max|Mη,x|−max|Mη,y|
–0.3max|N,x|+max|N,y| –0.3max|Mξ,x|+max|Mξ,y| –0.3max|Mη,x|+max|Mη,y|
–0.3max|N,x|-max|N,y| –0.3max|Mξ,x|−max|Mξ,y| –0.3max|Mη,x|−max|Mη,y|
Table 4. Design combinations for method MSex0.
maxσA,α0 N,maxσA,α0 Mξ,maxσA,α0 Mη,maxσA,α0
minσA,α0 N,minσA,α0 Mξ,minσA,α0 Mη,minσA,α0
maxσB,α0 N,maxσB,α0 Mξ,maxσB,α0 Mη,maxσB,α0
minσB,α0 N,minσB,α0 Mξ,minσB,α0 Mη,minσB,α0
maxσC,α0 N,maxσC,α0 Mξ,maxσC,α0 Mη,maxσC,α0
minσC,α0 N,minσC,α0 Mξ,minσC,α0 Mη,minσC,α0
maxσD,α0 N,maxσD,α0 Mξ,maxσD,α0 Mη,maxσD,α0
minσD,α0 N,minσD,α0 Mξ,minσD,α0 Mη,minσD,α0
29 1
Figure 5. Structural model (CM: Mass Centre; CS: Centre of Stiffness). 2
Fig. 5. Structural model (CM: Mass Centre; CS: Centre of Stiffness).
CEB-FIB. The axial load-bending moment interaction dia-grams are those constructed by CEB.
Figure 6a shows the variation of the reinforcing steel ra-tio in column C13 bottom (Fig. 5) of the mass eccentric system (es= 0.30) under earthquake record No. 7 with
re-spect to the recording angle. The black vertical line indi-cates the principal directions of the ground motion. It is ev-ident from this figure that the reinforcement is dependent on the recording angle when methods MSex0, MFabs0, and M30
are used. However, note that the required reinforcement is not influenced by the orientation of the recorded ground mo-tion when method MSex is used because this method uses
the maximum stresses over all incident angles while the rest three methods are based on response values produced by one orientation of seismic motion according to code provisions. As a consequence, method MSexproduces results which are
independent of the orientation of ground motion reference axes. The reinforcing steel ratio varies between 16.48 ‰ and 31.43, ‰ for method MSex0, between 20.63 ‰ and 35.62 ‰
for method MFabs0, as well as between 18.00 ‰ and 31.77 ‰
for method M30. Another significant observation is that both angleθ= 0◦ and the angle corresponding to the prin-cipal directions of ground motion lead to much smaller re-inforcement than the required rere-inforcement determined for other recording angles. Thus, the application of the accelero-grams along the structural axes with the orientation they were recorded for, which in general is arbitrary, can significantly underestimate seismic demands.
In order to better quantify the differences among the results produced for the 12 examined orientations of the recorded ground motion, the relative variation of the rein-forcing steel area for angle (θ: 0◦, 30◦,. . . , 330◦)with regard to angleθ= 0◦is defined as:
RVθ=
As,θ−As,0 As,0
·100(%). (8)
whereAs,θorAs,0: the required reinforcement for recording
angleθor (0◦).
The plot of RVθ( %) for column C13 (bottom) of the mass eccentric system (es=0.30) is shown in Fig. 6b. The RVθ for method MSexis not presented in the figure, since the required
reinforcement for this method is independent of the orienta-tion of the ground moorienta-tion. The maximum values of RVθ for
Table 5. Ground motions recorded on soil type B according to Greek Seismic Code.
No Date Earthquake Magnitude Station name Station Closest distance Component PGA Cor. Factor Angleθ0
name (Ms) number (Km) (deg) (g) (p)
1 28/6/1992 Landers 7.4 Yermo, Fire Station 22074 24.9 270360 0.2450.152 −0.20 154.0
2 28/6/1992 Landers 7.4 Palm Springs, Airport 12025 37.5 0 0.076 0.13 60.4
90 0.089
3 17/1/1994 Northridge 6.7 Los Angeles, Hollywood Storage Bldg. 24303 25.5 36090 0.3580.231 −0.06 176.0
4 17/1/1994 Northridge 6.7 Santa Monica City Hall 24538 27.6 360 0.370 −0.07 94.5
90 0.883
5 18/10/1989 Loma Prieta 7.1 Gilroy #3, Sewage Treatment Plant 47381 14.4 090 0.5550.367 0.05 5.8
6 10/1/1987 Whittier Narrows 5.7 Los Angeles, 116th St School 14403 22.5 270 0.294 0.01 89.2
360 0.396
7 10/1/1987 Whittier Narrows 5.7 Downey, Country Maintennance Bldg 14368 18.3 180270 0.2210.141 0.46 27.7
8 15/10/1979 Imperial Valley 6.9 El Centro #13, Strobel Residence 5059 21.9 140 0.117 0.12 41.6
230 0.139
9 15/10/1979 Imperial Valley 6.9 Calexico, Fire Station 5053 10.6 225315 0.2750.202 0.04 14.0
10 24/4/1984 Morgan Hill 6.1 Gilroy #7, Mantnilli Ranch, Jamison Rd 57425 14.0 0 0.190 0.25 28.4
90 0.113
11 24/4/1984 Morgan Hill 6.1 Gilroy #2, Keystone Rd 47380 15.1 090 0.1620.212 0.05 83.5
12 24/4/1984 Morgan Hill 6.1 Gilroy #3, Sewage Treatment Plant 47381 14.6 0 0.194 0.08 46.4
90 0.200
13 9/2/1971 San Fernando 6.6 Los Angeles, Hollywood Storage Bldg. 135 21.2 90180 0.2100.174 0.18 21.9
(a) (b)
Fig. 6. Influence of the orientation of recorded ground motion (a) on the reinforcing steel ratios (ρ) and (b) on the RVθ (%) for column C13
(bottom) of the mass eccentric system (es=0.30) under earthquake record No. 7.
methods MSex0, MFabs0, and M30 are 90.7 %, 72.7 % and
76.5 %, respectively (Fig. 6b).
The reinforcing steel ratio and the RVθ for beam BY1top, left end (Fig. 5) of the building with zero eccentricity un-der earthquake No. 7 are presented in Fig. 7. We can see that the required reinforcement is strongly dependent on the recording angle when methods MSex0, MFabs0, and M30 are
used. As mentioned before, method MSex leads to results
which are not affected by the orientation of the ground mo-tion. It must be noted that, due to the building’s symmetry,
method MFabs0 produces the same results with method M30
for all the beams of the building with zero eccentricity as well as for the parallel to Y-axis beams of the mass eccen-tric systems. The reinforcing steel ratio varies from 2.59 ‰ to 7.92 ‰ for method MSex0 and from 3.29 ‰ to 7.92 ‰
for methods MFabs0 and M30. Of particular interest is the
fact that both angleθ= 0◦and the angle corresponding to the principal directions of ground motion can significantly un-derestimate the reinforcement with regard to the required one produced for other recording angles (Fig. 7a). The maximum
(a) (b)
Fig. 7. Influence of the orientation of recorded ground motion (a) on the reinforcing steel ratios (ρ)and (b) on the RVθ(%) for beam BY1top (left joint) of the building with zero eccentricity under earthquake record No. 7.
values of RVθ for methods MSex0, MFabs0 and M30 are
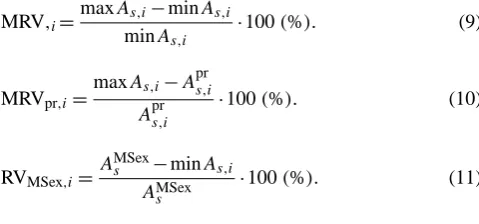
206.1 %, 140.6 % and 140.6 %, respectively (Fig. 7b). Furthermore, to facilitate comparisons, the Maximum Rel-ative Variation MRV, the Maximum RelRel-ative Variation with regard to the principal directions (MRVpr) and the Relative
Variation with regard to method MSex (RVMSex) for every
structural element and earthquake record are introduced: MRV,i=
maxAs,i−minAs,i minAs,i
·100(%). (9)
MRVpr,i=
maxAs,i−A pr s,i
Aprs,i ·100(%). (10)
RVMSex,i=
AMSexs −minAs,i
AMSex s
·100(%). (11)
where i: method MFabs0, M30 or MSex0; maxAs,i and minAs,i: the maximum and the minimum reinforcement pro-duced by method i for any recording angleθ, respectively. Moreover, Aprs,i and AMSexs are the reinforcement produced by method i using the principal components of the ground motion and the reinforcement produced by the method MSex,
respectively.
Tables 6, 7 and 8 present the average values of MRV,MRVprand RVMSexfor all the earthquake records
con-sidered. The results are tabulated separately for each method (MFabs0, M30 and MSex0) used and each examined building.
We can see (Table 6) that the average MRV can attain large values (up to 141.43 % for beam BY6top (right joint) and 108.75 % for column C12 (top)) depending on the struc-tural element, the mass eccentricity of the building and the method used. Of particular interest is the fact that the MRV of the majority of the beams is much larger than that of the columns for the building with zero eccentricity. The above observation is valid for the 13 earthquakes and the 3 methods (MFabs0, M30, MSex0) used to determine the required
rein-forcement. However, with increasing the mass eccentricity of the building, columns’ MRV tend to become larger than beams’ MRV, as the values of MRV for beams and columns
exhibit opposite trends (beams’ MRV decrease and columns’ MRV increase).
Another significant observation is that, concerning the beams, method MSex0 leads to the largest values of the MRV,
whereas it is not clear which is the method that produces the smallest MRV, since it depends on the mass eccentric-ity of the building, the structural element and the earthquake. With regard to columns, method MFabs0 seems to produce
the smallest values of MRV for the majority of the cross sections, while method MSex0 leads to the largest values of
MRV for the mass eccentric systems.
Table 6 clearly indicates that the required reinforcement is strongly affected by the orientation of the recorded ground motion when methods MFabs0, M30 and MSex0 are used to
select the set of internal forces needed to determine the re-quired reinforcement.
We can see (Table 7) that the average value of MRVpr
cor-responding to beams BX1 and BX7 is much smaller than that of beams BY6 and BY12. The same behavior pattern is ob-served for the vast majority of the beams which are parallel to the X structural axis regardless of the building’s mass ec-centricity. Moreover, Table 7 indicates that columns’ MRVpr
tend to increase as the mass eccentricity of the building in-creases regardless of the method used to determine the re-quired reinforcement. The opposite trend is exhibited by the beams which are parallel to the Y structural axis.
Comparing the three methods which produce reinforce-ment that depends on recording angle (MSex0, MFabs0 and
M30), it can be concluded that regarding the beams, method MSex0 produces the largest while method M30 the
small-est values of MRVpr. Regarding the columns, method MSex0
seems to produce the largest values of MRVprfor the vast
ma-jority of the columns. We should recall that large MRVpr
val-ues indicate that the principal components of ground motion applied along the structural axes produce smaller reinforce-ment than the maximum one over all incident angles.
From Table 8 it can be deduced that the ratio RVMSex
at-tains positive values for the vast majority of the structural elements (the only exception concerns the reinforcement of the columns of the building with zero eccentricity produced
Table 6. Average values of MRV(%) for all the earthquake records considered.
Section es=0 es=0.15 es=0.30
MFabs0 M30 MSex0 MFabs0 M30 MSex0 MFabs0 M30 MSex0
BX1(left) 100.74 100.74 128.29 75.84 67.54 104.80 61.38 65.51 86.14
BX1(right) 68.82 68.82 84.97 54.29 48.78 72.34 44.30 47.22 60.35
BX7(left) 96.52 96.52 121.66 84.97 81.58 116.96 72.75 80.07 95.64
BX7(right) 57.72 57.72 69.97 51.54 49.88 66.33 45.14 48.66 56.45
BY6(left) 71.65 71.65 87.94 56.73 56.73 74.90 47.22 47.22 59.40
BY6(right) 110.91 110.91 141.43 86.73 86.73 122.54 73.30 73.30 96.07
BY12(left) 80.60 80.60 100.20 49.75 49.75 62.61 36.72 36.72 45.24
BY12(right) 110.33 110.33 140.85 81.72 81.72 106.20 69.62 69.62 89.34
C1(bottom) 13.00 25.07 22.34 36.66 51.92 72.01 51.28 60.80 85.48
C1(top) 13.45 24.17 29.16 37.01 50.82 77.79 51.04 58.22 88.96
C12(bottom) 13.70 25.57 27.24 54.86 74.64 90.55 65.25 89.07 108.64
C12(top) 15.39 31.22 38.19 48.32 69.52 89.68 57.88 83.35 108.75
Table 7. Average values of MRVpr(%) for all the earthquake records considered.
Section es=0 es=0.15 es=0.30
MFabs0 M30 MSex0 MFabs0 M30 MSex0 MFabs0 M30 MSex0
BX1(left) 7.83 7.83 17.39 12.59 6.72 19.09 19.03 7.83 23.74
BX1(right) 5.86 5.86 10.04 9.70 5.11 18.13 14.36 5.92 17.39
BX7(left) 7.73 7.73 17.20 7.73 7.16 18.09 8.90 7.46 19.79
BX7(right) 5.23 5.23 8.89 5.26 4.87 8.62 5.98 5.01 10.02
BY6(left) 63.05 63.05 69.42 51.09 51.09 54.35 40.66 40.66 46.11
BY6(right) 96.66 96.66 112.19 78.57 78.57 108.00 63.81 63.81 73.69
BY12(left) 70.66 70.66 78.23 40.57 40.57 48.52 29.26 29.26 30.53
BY12(right) 96.01 96.01 111.50 67.20 67.20 75.22 55.07 55.07 65.53
C1(bottom) 7.07 7.40 14.91 25.07 43.34 46.76 37.37 43.75 60.33
C1(top) 8.16 6.29 19.96 25.97 42.49 49.51 37.68 42.38 63.30
C12(bottom) 8.20 7.03 19.48 9.36 7.71 8.80 9.32 8.06 13.42
C12(top) 10.65 17.06 26.03 8.82 7.43 9.47 8.60 7.76 15.54
Table 8. Average values of RVMSex(%) for all the earthquake records considered.
Section es=0 es=0.15 es=0.30
MFabs0 M30 MSex0 MFabs0 M30 MSex0 MFabs0 M30 MSex0
BX1(left) 47.22 47.22 53.28 41.98 36.63 49.40 37.61 36.57 45.60
BX1(right) 39.12 39.12 44.29 34.51 30.14 40.85 30.62 29.79 37.35
BX7(left) 46.48 46.48 52.27 43.79 42.29 50.85 40.38 41.41 46.56
BX7(right) 35.54 35.54 40.09 33.10 31.91 38.58 30.33 31.14 34.98
BY6(left) 40.39 40.39 45.35 35.23 35.23 41.34 30.41 30.41 35.54
BY6(right) 49.82 49.82 55.75 44.20 44.20 51.64 39.03 39.03 45.50
BY12(left) 25.70 25.70 30.18 31.87 31.87 37.67 42.89 42.89 48.23
BY12(right) 38.13 38.13 44.88 41.69 41.69 49.31 49.66 49.66 55.63
C1(bottom) −5.73 26.87 18.97 19.26 35.02 41.18 23.92 36.81 44.05
C1(top) −5.96 25.19 23.01 19.19 33.05 43.10 23.51 34.58 45.03
C12(bottom) −6.21 27.43 21.95 20.03 36.90 43.38 29.74 41.08 48.74
C12(top) −5.29 27.28 27.94 16.00 38.80 43.59 25.69 42.69 48.89
by method MFabs0). This means that the reinforcement
pro-duced by accelerograms applied along the structural axes can be much smaller than the one produced by accelerograms ap-plied along the axes which cause maximum response for the specific element and earthquake motion. The minimum re-inforcement produced by methods MFabs0, M30 and MSex0
can be much smaller (up to 55.75 % for beam BY6top (right joint) and 48.89 % for column C12 (top)) than the reinforce-ment determined by method MSex. Concerning the beams,
Table 8 indicates that method MSex0 produces the largest
values of RVMSex. Furthermore, note that method MFabs0
produces the smallest values of RVMSexfor all the columns
of the three buildings investigated and that the values of the columns’ RVMSexfor the three methods used tend to increase
as the mass eccentricity of the building increases. It is impor-tant to notice that the above observations are valid for the vast majority of the cross sections and earthquakes considered.
8 Conclusions
In the present paper, the influence of the orientation of recorded horizontal ground motion components on reinforce-ment of R/C frame elereinforce-ments has been investigated within the framework of linear response history analysis. As ex-isting seismic codes do not clearly specify how to select the set of internal forces for which the sections’ longitudinal re-inforcement should be calculated, four different methods of selection were applied. The comparative study of the results produced by the analysis and design of three illustrative ex-amples, leads to the following conclusions:
– The reinforcement is strongly dependent on the
ori-entation of the ground motion when methods MSex0,
MFabs0, and M30 are used for selecting the set of
sec-tional forces.
– For the majority of structural elements, the application
of the uncorrelated components of the ground motion along the structural axes of the building can signifi-cantly underestimate the reinforcement with regard to the reinforcement produced for other recording angles if methods MSex0, MFabs0, and M30 are used.
– The influence of the recording angle on the columns’
required reinforcement tends to be stronger as the mass eccentricity of the building increases. However, the opposite trend is exhibited by the vast majority of the beams of the studied buildings.
– Method MSex leads to results that are not influenced
by the orientation of the recorded ground motion. This method requires the results of two bi-directional time history analyses and can be easily implemented in ex-isting software.
Edited by: M. E. Contadakis
Reviewed by: A. Liolios and another anonymous referee
References
American Society of Civil Engineers (ASCE): Seismic Rehabilita-tion of Existing Buildings, ASCE 41-06, 2009.
Anastassiadis, K.: Directions sismiques de’favorables et combi-naisons de’favorables des effort, Annales d l’ I.T.B.T.P 512 (Mars/Avril), 83–99, 1993.
Anastasiadis, K., Avramidis, I., and Panetsos, P.: Concurrent design forces in structures under three-component orthotropic seismic excitation, Earthq. Spectra, 18, 1–17, 2002.
Athanatopoulou, A. M.: Critical orientation of three correlated seis-mic components, Eng. Struct., 27, 301–312, 2005.
Beyer, K. and Bommer, J. J.: Selection and scaling of real accelero-grams for bi-directional loading: A review of current practice and code provisions, J. Earthq. Eng., 11, 13–45, 2007.
CEB-FIP: Manual on bending and compression–Design of sections under axial action effects at the ultimate limit state, CEB Bulletin d’Information, No. 141, Lausanne, Switzerland, 1982.
CEN 1991, Eurocode 2: Design of concrete structures. 1: General rule and rules for buildings, ENV 1992-1-1, Brussels, 1991. EAK 2003: Greek Code for Earthquake Resistant Design of
Struc-tures, Ministry of Environment, Planning and Public Works, Greece, 2003.
EKOS 2000: Greek Code for the Design and Construction of Con-crete Works, Greek Ministry of Environment, Planning and Pub-lic Works, Greece, 2000.
Federal Emergency Management Agency (FEMA): Prestandard and commentary for the seismic rehabilitation of buildings, FEMA 356, Washington, DC, 2000.
Federal Emergency Management Agency (FEMA): Improvement of nonlinear static seismic analysis procedures, FEMA 440, Washington, DC, 2004.
Federal Emergency Management Agency (FEMA): Recommended seismic provisions for new buildings and other structures, FEMA P-750 (NEHRP), Washington, DC, 2009.
Gupta, A. K. and Singh, M. P.: Design of column sections subjected to three components of earthquake, Nucl. Eng. Des., 41, 129– 133, 1977.
Kostinakis, K. G., Athanatopoulou, A. M., and Avramidis, I. E.: Selection of sectional forces for designing r/c frames analysed by time history analysis, Beijing, China, in Proceedings of 14th World Conference on Earthquake Engineering, paper 08-02-0010, 2008.
Kostinakis K. G., Athanatopoulou A. M., and Avramidis I. E.: Influ-ence of the orientation of seismic records on structural response, Bangkok, Thailand, Proceedings of IABSE Symposium, paper 051-02-01, 2009.
Kostinakis, K. G., Athanatopoulou, A. M., and Avramidis, I. E.: Sectional forces for seismic design of R/C frames by linear time history analysis and application to 3-D single-story buildings, Soil Dyn. Earthq. Eng., 31, 318–333, 2011.
Pacific Earthquake Engineering Research Center (PEER): Strong Motion Database, http://peer.berkeley.edu/smcat/, 2003. Penzien, J. and Watane, M.: Characteristics of 3-D Earthquake
Ground Motions, Earthquake Eng. Struct. Dyn., 3, 365–373, 1975.
SAP2000: Computers and Structures Inc, CSI, Berkeley, 1998.