Nat. Hazards Earth Syst. Sci., 9, 967–977, 2009 www.nat-hazards-earth-syst-sci.net/9/967/2009/ © Author(s) 2009. This work is distributed under the Creative Commons Attribution 3.0 License.
Natural Hazards
and Earth
System Sciences
Application of ANN to evaluate effective parameters affecting
failure load and displacement of RC buildings
M. Hakan Arslan
Selcuk University, Engineering and Architecture Faculty, Department of Civil Engineering, Konya, Turkey Received: 23 February 2009 – Revised: 20 May 2009 – Accepted: 19 June 2009 – Published: 25 June 2009
Abstract. This study investigated the efficiency of an ar-tificial neural network (ANN) in predicting and determin-ing failure load and failure displacement of multi story re-inforced concrete (RC) buildings. The study modeled a RC building with four stories and three bays, with a load bearing system composed of columns and beams. Non-linear static pushover analysis of the key parameters in change defined in Turkish Earthquake Code (TEC-2007) for columns and beams was carried out and the capacity curves, failure loads and displacements were obtained. Totally 720 RC buildings were analyzed according to the change intervals of the pa-rameters chosen. The input papa-rameters were selected as lon-gitudinal bar ratio (ρ`)of columns, transverse reinforcement ratio (Asw/sc), axial load level (N/No), column and beam cross section, strength of concrete (fc)and the compression bar ratio (ρ0/ρ)on the beam supports. Data from the nonlin-ear analysis were assessed with ANN in terms of failure load and failure displacement. For all outputs, ANN was trained and tested using of 11 back-propagation methods. All of the ANN models were found to perform well for both failure loads and displacements. The analyses also indicated that a considerable portion of existing RC building stock in Turkey may not meet the safety standards of the Turkish Earthquake Code (TEC-2007).
1 Introduction
Within developing countries, earthquakes have been the most significant reported cause of failure of RC buildings during the last 30 years, resulting in the greatest losses of life and
ply the result of flawed construction technology but of inade-quate inspection and lack of information during the construc-tion phase.
Turkey has experienced serious loss of life and property after each large scale earthquake, not only because more than 70% of its’ building stock is of RC construction, but also be-cause of its’ location on the Northern Anatolian Fault which is one of the world’s most active seismic zones. The Kocaeli earthquake of 1999 caused more than 20 000 fatalities, left 45 000 injured or homeless and caused damage or total col-lapse in 350 000 buildings. It is critically important to assess the probable performance, failure load and failure displace-ment of existing RC buildings and to decide on a strategy for strengthening these building, if required, in order to re-duce the damage and collapses that may occur after proba-ble earthquakes. Due to this requirement, the Turkish Earth-quake Code (TEC-2007) was revised in 2007 in line with the codes developed by the US Federal Earthquake Management Agency (FEMA 356 [8]; FEMA 440 [9]), which are regarded as the global benchmark for evaluating the design and struc-tural performance of building stock for earthquake events.
968 M. Hakan Arslan: Application of ANN to evaluate effective parameters
19
List of Figures
Figure 1.
A Seriously Damaged RC Building in Marmara Region
Figure 2.
Load-Displacement Curve and Performance Levels of a Structure
Figure 3.
Component Damage Levels
Figure 4.
Typical Load-Displacement Relationship for RC Structures
Figure 5.
Plan View of Sample Building
Figure 6.
Selected Interior Frame
Figure 7.
Capacity Curves of the Type-1 and Type-720
Figure 8.
Feed Forward Multilayer Network Consisting of an Input Layer, a Hidden
Layer and an Output Layer.
Figure 9.
Comparison of Pushover and ANN Results for Failure Load (V
failure) of RC
Structures
Figure 10.
Comparison of Pushover and ANN Results for Failure Displacement (
δ
failure)of
RC Structures
Figure 1.
A Seriously Damaged RC Building in Marmara Region
Figure 2.
Load-Displacement Curve and
Performance Levels of a Structure
Figure 3.
Component Damage Levels
Fig. 1. A seriously damaged RC building in Marmara region.
structural elements that form the load bearing system such as columns, beams and shear walls. Thus, a general assessment can be provided for the element, each storey and the complete load bearing system. Parallel to FEMA-356, TEC-2007 also assesses levels of damage for the columns and beams accord-ing to the parameters specified in Table 1.
The objective of this study is (1) to determine failure load and failure displacement of multi-storey RC buildings in which the load bearing system is formed only by columns and beams (2) to investigate the usability of artificial neu-ral network (ANN) models in predicting the failure load and failure displacement of RC buildings. (3) Such buildings are reported to be the type most at risk of serious earthquake damage, according to the column and beam parameters spec-ified in the TEC-2007, FEMA-356 and other building codes [13–14]. The research further aims to analyze the extent to which these parameters explain and predict failure load and failure displacement.
For these aims, first of all a database was created by us-ing non-linear static pushover analysis of RC buildus-ings. 720 frames were analyzed according to the change intervals of the parameters chosen (given in Table 1). Failure load and failure displacement of each of the frames has been calcu-lated using capacity curves (lateral load-lateral displacement curves) obtained by pushover analysis. After obtaining fail-ure load and failfail-ure displacement values of each frame, the results of the analyses have been investigated and verified by a mathematical model controlling with the assistance of 11 different artificial neural network (ANN) algorithms.
2 Methodology for failure load and failure displacement evaluation
Within Seismic Codes, the earthquake safety of exist-ing RC buildexist-ings is determined based on the concept of performance-based design. Generally this takes the form of desired performance outcomes, such as withstanding minor earthquakes undamaged; withstanding medium-scale
earth-19
List of Figures
Figure 1.
A Seriously Damaged RC Building in Marmara Region
Figure 2.
Load-Displacement Curve and Performance Levels of a Structure
Figure 3.
Component Damage Levels
Figure 4.
Typical Load-Displacement Relationship for RC Structures
Figure 5.
Plan View of Sample Building
Figure 6.
Selected Interior Frame
Figure 7.
Capacity Curves of the Type-1 and Type-720
Figure 8.
Feed Forward Multilayer Network Consisting of an Input Layer, a Hidden
Layer and an Output Layer.
Figure 9.
Comparison of Pushover and ANN Results for Failure Load (V
failure) of RC
Structures
Figure 10.
Comparison of Pushover and ANN Results for Failure Displacement (
δ
failure)of
RC Structures
Figure 1.
A Seriously Damaged RC Building in Marmara Region
Figure 2.
Load-Displacement Curve and
Performance Levels of a Structure
Figure 3.
Component Damage Levels
Fig. 2. Load-displacement curve and performance levels of astruc-ture.
quakes with limited damage and; withstanding large-scale earthquakes without total collapse. The critical outcome is the prevention of total structural collapse. This means that the upper level withstands total collapse (CP); The sub level, for the crucial structures, may be slightly damaged but re-mains fit for immediate occupancy (IO). Between the sub and upper levels there is Life Safety (LS) level situation. Multiple performance objectives for these levels, including the seismic transformation periods, have been specified in Table 2.
Seismic performance of the load bearing system is de-fined as the sum of seismic damage levels of the structural elements (beam, column, etc.) which form the load bear-ing system. The damage level of the elements of the load bearing system differs according to the method of analysis. In common with FEMA 356, the Turkish Earthquake Code (TEC-2007) states that the seismic performance of build-ings can be determined using linear or nonlinear analysis. The design engineer is free to utilize either linear or non-linear analysis approaches. The seismic codes also include a number of analysis methods, such as “incremental equiv-alent seismic load method”, “incremental mode superposi-tion method” and “analysis method in time domain” which are suitable to be used for both approaches. In the present study, the structures were evaluated using nonlinear analysis with the incremental equivalent seismic load method (static pushover analysis method).
M. Hakan Arslan: Application of ANN to evaluate effective parameters 969
Table 1. Parameters required for damage prediction in RC structural elements.
Type of element Parameters Damage occures
Beams
– Transverse reinforcement
– Amount of compression bars at the
support
– Longitudinal reinforcement ratio – Dimensions
– Concrete compressive strength
22
List of Tables
Table 1. Parameters Required for Damage Prediction in RC Structural Elements Table 2. Required Seismic Performance Levels for Design Earthquakes (EQ) Table 3. Cross Sectional Damage Levels
Table 4. Structure Performance Based on Damage Table 5. Range of Parameters Used
Table 6. Features Based on Related Parameters of Two Sample RC Frames
Table 7. Failure Point and Global Displacement Drift Capacities (%) of the Sample Buildings Obtained
Table 8. Data Range
Table 9. The Network Training Parameters
Table 10. Back Propagation Training Algorithms Used in NN Training
Table 11. Performance of Back-Propagation Methods for Values of Failure Point of the Structures (Vfailure)
Table 12. Performance of Back-Propagation Methods for Values of Failure Point of the Structures (δfailure)
Table 1. Parameters Required for Damage Prediction in RC Structural Elements Type of
element Parameters Damage occures
Beams
• Transverse reinforcement • Amount of compression bars at the
support
• Longitudinal reinforcement ratio • Dimensions
• Concrete compressive strength
Columns
• Axial load level • Transverse reinforcement • Dimensions
• Concrete compressive strength
Columns
– Axial load level
– Transverse reinforcement – Dimensions
– Concrete compressive strength
22
List of Tables
Table 1. Parameters Required for Damage Prediction in RC Structural Elements Table 2. Required Seismic Performance Levels for Design Earthquakes (EQ) Table 3. Cross Sectional Damage Levels
Table 4. Structure Performance Based on Damage Table 5. Range of Parameters Used
Table 6. Features Based on Related Parameters of Two Sample RC Frames
Table 7. Failure Point and Global Displacement Drift Capacities (%) of the Sample Buildings Obtained
Table 8. Data Range
Table 9. The Network Training Parameters
Table 10. Back Propagation Training Algorithms Used in NN Training
Table 11. Performance of Back-Propagation Methods for Values of Failure Point of the Structures (Vfailure)
Table 12. Performance of Back-Propagation Methods for Values of Failure Point of the Structures (δfailure)
Table 1. Parameters Required for Damage Prediction in RC Structural Elements Type of
element Parameters Damage occures
Beams
• Transverse reinforcement
• Amount of compression bars at the support
• Longitudinal reinforcement ratio
• Dimensions
• Concrete compressive strength
Columns
• Axial load level
• Transverse reinforcement
• Dimensions
• Concrete compressive strength
Table 2. Required seismic performance levels for design earthquakes (EQ).
Purpose of structure and class of buildings
Exceeding probability of EQ
50 years 50% 50 years 10% 50 years 2%
Average return period
75 year 475 year 2500 year
Buildings to be utilized after the EQ – IO LS Intensively and long-term occupied buildings – IO LS Intensively and short-term occupied buildings IO LS – Buildings containing hazardous materials – IO CP
Other buildings LS –
As a part of the static pushover analysis, it is necessary to define the cross-sectional damage level according to the deformation of each of the structural elements in order to determine the global performance of the load bearing system (Tables 3–4). In the Table 3, according to the TEC-2007, the cross sectional damage types are given. Based on these damage levels, the structural performance can be obtained as given in Table 4.
2.1 Calculating failure load and failure displacement – In order to obtain lateral load – lateral top
displace-ment curve of the sample building, static pushover anal-ysis method is selected. For this purpose, researchers and engineers use linear and nonlinear dynamic anal-ysis programs such as DRAIN, IDARC and SAP2000 [15–17].
List of Figures
Figure 1.
A Seriously Damaged RC Building in Marmara Region
Figure 2.
Load-Displacement Curve and Performance Levels of a Structure
Figure 3.
Component Damage Levels
Figure 4.
Typical Load-Displacement Relationship for RC Structures
Figure 5.
Plan View of Sample Building
Figure 6.
Selected Interior Frame
Figure 7.
Capacity Curves of the Type-1 and Type-720
Figure 8.
Feed Forward Multilayer Network Consisting of an Input Layer, a Hidden
Layer and an Output Layer.
Figure 9.
Comparison of Pushover and ANN Results for Failure Load (V
failure) of RC
Structures
Figure 10.
Comparison of Pushover and ANN Results for Failure Displacement (δ
failure)of
RC Structures
Figure 1.
A Seriously Damaged RC Building in Marmara Region
Figure 2.
Load-Displacement Curve and
Performance Levels of a Structure
Fig. 3. Component damage levels.Figure 3.
Component Damage Levels
970 M. Hakan Arslan: Application of ANN to evaluate effective parameters
Table 3. Cross sectional damage levels.
Cross-sectional damage level Maximum strain for concrete (εc) Maximum strain for steel (εs)
Slight Damage (SD) 0.0035 0.010
Moderate Damage (MD) 0.0035+0.01 ρs
ρsm
≤0.0135 0.040
Heavy Damage (HD) 0.004+0.014
ρs
ρsm
≤0.018 0.060
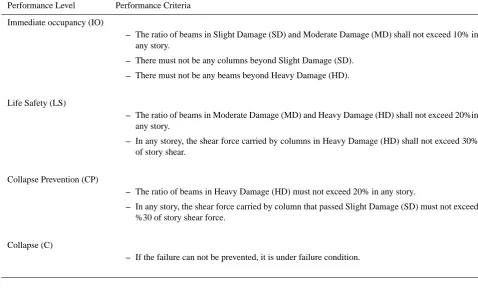
Table 4. Structure performance based on damage.
Performance Level Performance Criteria
Immediate occupancy (IO)
– The ratio of beams in Slight Damage (SD) and Moderate Damage (MD) shall not exceed 10% in
any story.
– There must not be any columns beyond Slight Damage (SD). – There must not be any beams beyond Heavy Damage (HD).
Life Safety (LS)
– The ratio of beams in Moderate Damage (MD) and Heavy Damage (HD) shall not exceed 20%in
any story.
– In any storey, the shear force carried by columns in Heavy Damage (HD) shall not exceed 30%
of story shear.
Collapse Prevention (CP)
– The ratio of beams in Heavy Damage (HD) must not exceed 20% in any story.
– In any story, the shear force carried by column that passed Slight Damage (SD) must not exceed
%30 of story shear force.
Collapse (C)
– If the failure can not be prevented, it is under failure condition.
– Beam and column elements are modeled as nonlinear frame elements with lumped plasticity by defining plas-tic hinges at both ends of the beams and columns. – To define plastic hinge properties, moment-curvature
analyses are carried out taking section properties and axial load level for every column and beams into ac-count.
– The input required for the above mentioned programs is moment-rotation instead of moment curvature there-fore transformation is needed. Transformations of bi-linear diagrams M−ϕ (Moment-curvature) which are obtained in aforementioned procedure, in bilinear dia-gramsM−φ(Moment-rotations) implements (Eq. 1).
θ`p = `p
Z
o
ϕdx (1)
In this step, a suitable plastic hinge length`p is used to obtain ultimate rotation values from the ultimate curvatures. In the literature several`plength are proposed [18–23] In the structural modeling, Eq. (2) was used for the plastic hinge length definition. This equation is also used in TEC-2007 and FEMA-356. In Eq. (2), H is the column and beam section depth.
`p=0.5H (2)
M. Hakan Arslan: Application of ANN to evaluate effective parameters 971
20
Figure 4.
Typical Load-Displacement Relationship for RC Structures
Figure 5.
Plan View of Sample Building
Figure 6.
Selected Interior Frame
Figure 7.
Capacity Curves of the Type-1 and Type-720
Fig. 4. Typical load-displacement relationship for RC structures.
axial loaded columns (columns under compression failure)
EIef=0.8EIg.
– After completing plastic hinge length and effective flex-ural stiffness values, the gravity loads are applied on the systems. The pushover analysis takes from the gravity loads and a monotonically increasing pattern of lateral static forces. The first mode shape (inverted triangular) has been selected for loading as general. In the analysis,
P−1effects were taken into account. – Fyandδyare defined graphically (see Fig. 4).
– The areas under the original and idealizing curve are approximately equal.
– Since the original pushover curve is known from analyt-ical data, the two curves cross at a force equal to about 60 per cent of the yield strength (0.6Fy).
– The failure displacement is there where the slump 25% of the strength is appeared.
3 Brief description of the selected sample RC structures In this study, a 4 story reinforced concrete frame building was selected. The selected building was typical beam-column RC frame building with no shear wall. The 4 story frame build-ing was 12 m by 12 m in plan. It has 3@4 m bays along X di-rection and 4@3 m bays along Y didi-rection (Figs. 5–6). Typi-cal floor height was 3.0 m. The column and beam dimensions used in this study were typical frame element proportions in practice. The building doesn’t have any vertical irregularities as soft story, short column, heavy overhangs etc.
At every story, column and beam dimensions were the same. All columns were selected as 400 mm×400 mm and 500 mm×500 mm. All beams had 200×500 mm and 250×600 mm cross section. In practice, especially in Turkey, while column dimensioned are generally changed from one story to another, beam dimensions remained the same. In
20
Figure 4.
Typical Load-Displacement Relationship for RC Structures
Figure 5.
Plan View of Sample Building
Figure 6.
Selected Interior Frame
Figure 7.
Capacity Curves of the Type-1 and Type-720
Fig. 5. Plan view of sample building.
Figure 4.
Typical Load-Displacement Relationship for RC Structures
Figure 5.
Plan View of Sample Building
Figure 6.
Selected Interior Frame
Figure 7.
Capacity Curves of the Type-1 and Type-720
Fig. 6. Selected interior frame.
this study, the column section changes were neglected be-tween the stories. The parameters investigated within the scope of this study were (1) concrete strength, (2) amount of column’s longitudinal reinforcement, (3) amount of trans-verse reinforcement at the confinement zone for beam and column, (4) axial load level on the column, (5) dimensions of column and beam and (6) amount of compression bars at the support section of beams. Table 5 summarizes the range
972 M. Hakan Arslan: Application of ANN to evaluate effective parameters
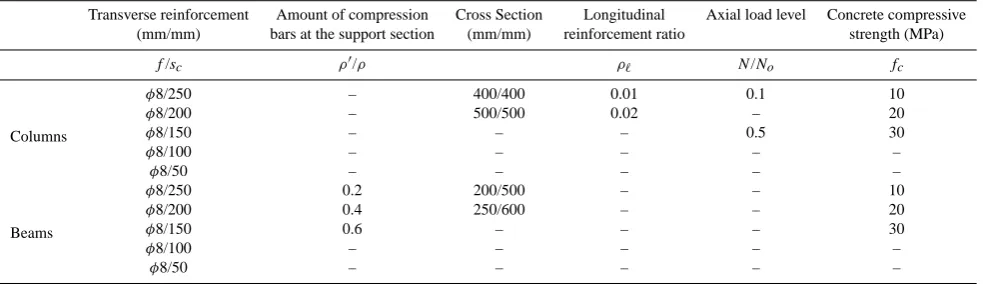
Table 5. Range of parameters used.
Transverse reinforcement Amount of compression Cross Section Longitudinal Axial load level Concrete compressive
(mm/mm) bars at the support section (mm/mm) reinforcement ratio strength (MPa)
f/sc ρ0/ρ ρ` N/No fc
Columns
φ8/250 – 400/400 0.01 0.1 10
φ8/200 – 500/500 0.02 – 20
φ8/150 – – – 0.5 30
φ8/100 – – – – –
φ8/50 – – – – –
Beams
φ8/250 0.2 200/500 – – 10
φ8/200 0.4 250/600 – – 20
φ8/150 0.6 – – – 30
φ8/100 – – – – –
φ8/50 – – – – –
of the parameters used in the structural and cross sectional analyses. According to the Table 5;
– The longitudinal reinforcement ratio of the columns varies between 1% and 2%. In the codes [10, 13–14], the longitudinal rebar ratio (ρl)ranges between 1%–4%, generally. Selection of low steel ratio is encouraged be-cause; low steel ratio is an amplification of larger cross section. The use of larger cross section effects lateral stiffness to increase.
– The proportion of compression bars and tensile bar of the beams’ support varies between 0.2 and 0.6. In order to obtain adequate ductility at the end of beam, codes stipulate the requirement minimum compression bar’s (bottom bar) ratio as 30 % of tension bar’s (top bar). – Axial load ratio ranges between 0.1 and 0.5 for columns.
In the codes, the axial load level of column changes in this gap. Maximum value of this level given in the codes ranges from 0.50 to 0.65. The reason for this is to satisfy minimum rigidity, decrease the axial load level, and thus increase in ductility.
– Transverse reinforcement spacing in critical region is selected as 50∼250 mm. In all codes including TEC-2007, transverse bars spacing and special seismic hooks is important to obtain plastic hinge formation and high ductility. According to author observation after the earthquakes, especially in Turkey, the spacing of trans-verse ties is typically 200–250 mm uniform along the clear height of the column and beam. The wide spacing of the ties resulted in shear failures buckling of longitu-dinal rebar and poor confinement of the core concrete. – Concrete strength parameter is selected as 10, 20 and
30 MPa. In the all codes, it is stipulated that the mini-mum characteristic strength of concrete must be 20 MPa for structures which will be built on earthquake prone regions. Poor quality of material may have been one
of the main factors that caused the collapse of many structures. Damage due to poor quality of material was reported many of other country’s earthquakes [24– 26]. Lack of anchorage of beams and insufficient splice lengths is secondary affected by low quality level of concrete.
4 Database of evaluated RC buildings
In the study, the grouping of the RC buildings, of which eval-uation has been performed, has been made according to the parameters specified in Table 5. As can be seen from the ta-ble, 720 frame types have been arranged according to their performance characteristics. Among these frames the lowest performance level in terms of section, reinforcement and ma-terial is designated as Type-1, and the highest performance in respect of the same features is designated as Type-720. The features of Type-1 and Type-720 have been specified in Ta-ble 6.
The failure load and failure displacement of the all frames with static pushover analysis was conducted using the SAP2000 three-dimensional structural analysis program. The results are shown in Table 7. Because the decrease of 25% after the maximum load, which defines failure load, is not seen in the curves of lateral load-lateral displacement of both frames, the ultimate point of the curve has been taken as the failure load and failure displacement. Lateral drift ca-pacities (%) in performance areas of sample RC frames are also specified in Table 7. Load displacement curves for both sample frames are also specified in Fig. 7.
5 ANN-Based models for estimating the failure load and failure displacement of the RC structures
M. Hakan Arslan: Application of ANN to evaluate effective parameters 973
Table 6. Features based on related parameters of two sample RC frames.
Transverse reinforcement (mm/mm)
Amount of compres-sion bars at the sup-port section
Beam Cross Section (mm/mm)
Column Cross Section (mm/mm)
Longitudinal reinforcement ratio
Axial load level
Concrete compressive strength (MPa)
f/sc ρ0/ρ ρ` N/No fc
Type-1 φ8/250 0.2 200/500 400/400 0.01 0.5 10
Type-720 φ8/50 0.6 250/600 500/500 0.02 0.1 30
Table 7. Failure point and global displacement drift capacities (%) of the sample buildings obtained for considered performance levels.
Structure Type Values of failure point of the structures Performance Level
δfailure(mm) Vfailure(kN) Immediate Occupancy (IO)
Life Safety (LS)
Collapse Prevention (CP)
Type-1 83.13 194 0.23 0.44 0.62
Type-720 177.05 561 0.61 1.05 1.32
20
Figure 4.
Typical Load-Displacement Relationship for RC Structures
Figure 5.
Plan View of Sample Building
Figure 6.
Selected Interior Frame
Figure 7.
Capacity Curves of the Type-1 and Type-720
Fig. 7. Capacity curves of the Type-1 and Type-720.
successfully applied to a number of areas of structural en-gineering that is an important branch of civil enen-gineering. In the recent literature, structural analysis and design [27–32], structural dynamics and control [33] and structural damage assessment [34, 35] are good examples for the application of ANN. In this study, a three-layered feed-forward neural net-work was used and trained with the error back propagation method. The structure of feed-forward multilayer network is given in Fig. 8. As it seen from the Fig. 8, general struc-ture of the neural network consists of an input layer, one or more hidden layer(s) and an output layer. Layers are fully interconnected, as shown by lines. The input data are pre-sented to the ANN at the input layer, which are processed in a forward direction through the hidden layer(s), and the out-put from the ANN is comout-puted at the outout-put layer. This is known as “feed-forward mechanism”. In a feed-forwarded operation, the flow of information is from left to right [27].
Figure 8.
Feed Forward Multilayer Network Consisting of an Input Layer, a Hidden Layer
and an Output Layer.
Figure 9.
Comparison of Pushover and ANN Results for Failure Load (V
failure) of RC
Structures
Figure 10.
Comparison of Pushover and ANN Results for Failure Displacement (
δ
failure)of
RC Structures
Fig. 8. Feed forward multilayer network consisting of an input
layer, a hidden layer and an output layer.
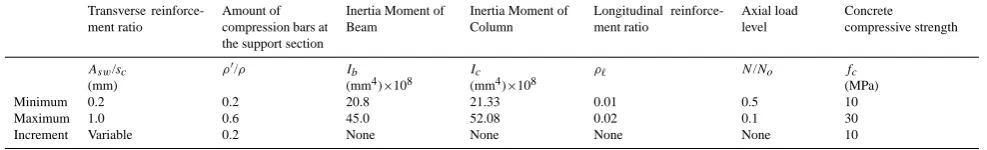
In the ANN model, 720 different RC structures having different material and sectional parameters were analyzed to calculate the failure load and displacement of the RC struc-tures. These material and sectional parameters included; (1) Transverse reinforcement ratio (Asw/sc), (2) Amount of com-pression bars at the support section of beams (ρ0/ρ), (3) Iner-tia moment of beam (Ib), (4) Inertia moment of column (Ic), (5) Longitudinal reinforcement ratio for column (ρ`), (6) Ax-ial load level on column (N/No)and (7) Concrete compres-sive strength (fc). The range of datasets is listed in Table 8.
974 M. Hakan Arslan: Application of ANN to evaluate effective parameters
Table 8. Data range.
Transverse reinforce-ment ratio
Amount of compression bars at the support section
Inertia Moment of Beam
Inertia Moment of Column
Longitudinal reinforce-ment ratio
Axial load level
Concrete compressive strength
Asw/sc
(mm)
ρ0/ρ Ib
(mm4)×108
Ic
(mm4)×108
ρ` N/No fc
(MPa)
Minimum 0.2 0.2 20.8 21.33 0.01 0.5 10
Maximum 1.0 0.6 45.0 52.08 0.02 0.1 30
Increment Variable 0.2 None None None None 10
Table 9. The network training parameters.
Parameter Value
Number of Training examples (randomly) 360 Number of Testing examples (randomly) 360 Iteration Number (Maximum) 5000
Learning Rate (lr) 1.0
Momentum Constants 0.2
Error tolerance 0.0001
ANN structure 7:HN:1
Totally 720 data were scaled to be presented to the net-work. A simple linear normalization function within the val-ues of 0 to 1 is given by Eq. (3) [27],
sx=
(x−xmin)
(xmax−xmin)
(3) In the Eq. (1),sx is the normalized value of variable, x,
xmin andxmax are variable minimum and maximum values
respectively. In this study, MATLAB neural network tool-box [36] was used to estimate and determine failure load and displacement of the RC structures. The MATLAB neural net-work toolbox needs some parameters to start simulation as; (1) number of training data; (2) number of hidden layers; (3) number of iteration (epocs); (4) learning rate; (5) number of nodes of input; output and hidden; (6) error tolerance and; (7) momentum constant. There are no acceptable general-ized rules to determine the size of the training data. From the set of 720 design data, 360 data sets were selected for neural network training. Required parameter and its selected values are given in Table 9.
In the simulation process, the 11 neural network configu-rations that are given in Table 10 were selected. In all sim-ulations one hidden layer was chosen. Maximum training cycles, learning rate, error tolerance and momentum coeffi-cient were kept constant. The number of neurons in the hid-den layer was changed 2 to 16. In Table 9, 7: HN: 1 refers to 7 input nodes, HN optimum number of hidden nodes and 1 output node.
6 Comparison of analysis results
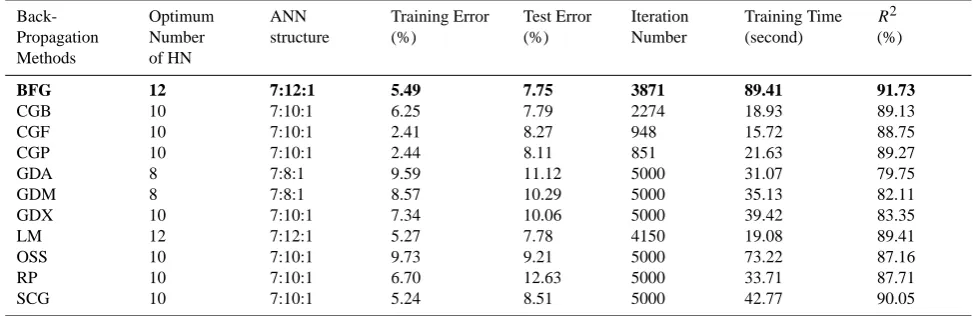
The results of ANN models for failure load and displace-ment of RC structure are given in Tables 11–12. The op-timum number of hidden layer nodes that is obtained after many trials is also provided in the second column of the ta-bles. Performance of Back-Propagation Methods for failure load (Vfailure)is given in Table 11. It is obvious from the
Ta-ble 11 that the performances of the BFG algorithm performed the best estimation concerning correlation coefficients (R2), even though training time is quite long due to the training cy-cles. CGF algorithm made classification process in less time than other algorithms forVfailure. In addition to these, as seen
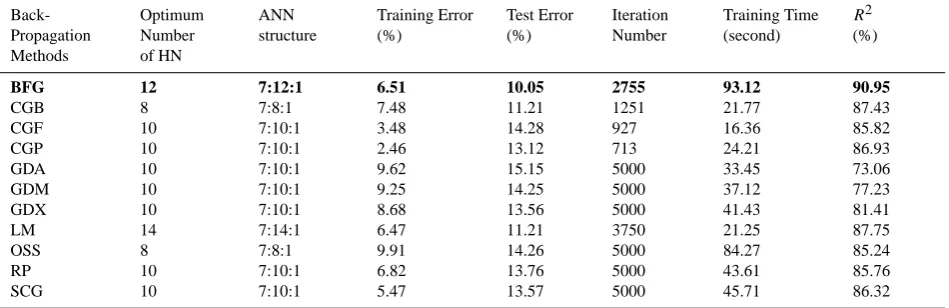
from the Table 11, all of back-propagation methods were ob-tained between 90.27% and 97.59 % averaged accuracy rate (100% – error %) for test phase of neural network and also 87.37% and 92.25% averaged accuracy rate (100% – error %) for training phase of neural network. As demonstrated in Table 12, the best estimation was performed by SCG al-gorithm for theδfailuresimilar toVfailureperformance. In the
estimation ofδfailure, CGF also made classification process
in less time than the others. The averaged accuracy rate was between 94.53% and 97.54% for test phase and 84.85% and 89.95% for training phase. The comparison of pushover re-sults as calculated and ANN rere-sults as estimated for failure load and failure displacement of RC structures is plotted in Figs. 9 and 10. In the figures, a BFG algorithm’s data was used because it has better performance (estimation power) than the other algorithms.
7 Results
M. Hakan Arslan: Application of ANN to evaluate effective parameters 975
Table 10. Back propagation training algorithms used in NN training.
Category 1
GDA Gradient descent with adaptive linear back propagation GDM Gradient Descent BP with Momentum
GDX Gradient descent w/momentum and adaptive linear back propagation RP Resilient back propagation
Category 2
CGF Fletcher – Powell conjugate gradient back propagation CGP Polak-Ribiere conjugate gradient back propagation CGB Powell – Beale conjugate gradient algorithm SCG Scaled conjugate gradient back propagation BFG BFGS quasi – Newton back propagation OSS One step secant back propagation LM Levenberg – Marquart back propagation
Table 11. Performance of back-propagation methods for values of failure point of the structures (Vfailure).
Back-Propagation Methods
Optimum Number of HN
ANN structure
Training Error (%)
Test Error (%)
Iteration Number
Training Time (second)
R2
(%)
BFG 12 7:12:1 5.49 7.75 3871 89.41 91.73
CGB 10 7:10:1 6.25 7.79 2274 18.93 89.13
CGF 10 7:10:1 2.41 8.27 948 15.72 88.75
CGP 10 7:10:1 2.44 8.11 851 21.63 89.27
GDA 8 7:8:1 9.59 11.12 5000 31.07 79.75
GDM 8 7:8:1 8.57 10.29 5000 35.13 82.11
GDX 10 7:10:1 7.34 10.06 5000 39.42 83.35
LM 12 7:12:1 5.27 7.78 4150 19.08 89.41
OSS 10 7:10:1 9.73 9.21 5000 73.22 87.16
RP 10 7:10:1 6.70 12.63 5000 33.71 87.71
SCG 10 7:10:1 5.24 8.51 5000 42.77 90.05
top displacement curve (capacity curve) of the sample build-ing, static pushover analysis method was selected.
In this study, following points have been noted by com-paring the values of failure load and failure displacement to the results obtained by using 11 different artificial neural net-works approaches;
– Nonlinear and compex behavior of RC buildings un-der seismic action makes quantification of their perfor-mance a difficult task. This study explored the feasibil-ity of the potential use of artificial neural networks in failure load and failure displacement of RC buildings. – This study demonstrates that the efficiency of feed
for-ward back-propagation neural network to predict failure load and failure displacement. It was found that the se-lected parameters explain a high proportion of the re-sults (91.73% for failure force and 90.95% for failure displacement). That means; the percentage of influence of mentioned variant on the result is very high.
Figure 8.
Feed Forward Multilayer Network Consisting of an Input Layer, a Hidden Layer
and an Output Layer.
Figure 9.
Comparison of Pushover and ANN Results for Failure Load (V
failure) of RC
Structures
Figure 10.
Comparison of Pushover and ANN Results for Failure Displacement (
δ
failure)of
RC Structures
Fig. 9. Comparison of pushover and ANN results for failure load
(Vfailure)of RC structures.
– The estimation capacity and estimation duration of each algorithm show significant differences. It is obvious that the selection of the data used in the training set
976 M. Hakan Arslan: Application of ANN to evaluate effective parameters
Table 12. Performance of back-propagation methods for values of failure point of the structures (δfailure).
Back-Propagation Methods
Optimum Number of HN
ANN structure
Training Error (%)
Test Error (%)
Iteration Number
Training Time (second)
R2
(%)
BFG 12 7:12:1 6.51 10.05 2755 93.12 90.95
CGB 8 7:8:1 7.48 11.21 1251 21.77 87.43
CGF 10 7:10:1 3.48 14.28 927 16.36 85.82
CGP 10 7:10:1 2.46 13.12 713 24.21 86.93
GDA 10 7:10:1 9.62 15.15 5000 33.45 73.06
GDM 10 7:10:1 9.25 14.25 5000 37.12 77.23
GDX 10 7:10:1 8.68 13.56 5000 41.43 81.41
LM 14 7:14:1 6.47 11.21 3750 21.25 87.75
OSS 8 7:8:1 9.91 14.26 5000 84.27 85.24
RP 10 7:10:1 6.82 13.76 5000 43.61 85.76
SCG 10 7:10:1 5.47 13.57 5000 45.71 86.32
21
Figure 8.
Feed Forward Multilayer Network Consisting of an Input Layer, a Hidden Layer
and an Output Layer.
Figure 9.
Comparison of Pushover and ANN Results for Failure Load (V
failure) of RC
Structures
Figure 10.
Comparison of Pushover and ANN Results for Failure Displacement (
δ
failure)of
RC Structures
Fig. 10. Comparison of pushover and ANN results for failure
dis-placement (δfailure)of RC structures.
and algorithm directly influences the accuracy and rate. Therefore, selection of the algorithm most appropriate for each data set is a crucial factor in the solution of the problem.
– It should be noted that selected ANN models presented above are valid only for the ranges of database given in Table 5 and for the sample frame (4-storey R/C plane frames which are a very common building type in Turkey) given in Figs. 5–6. Therefore, the estimation capacity and estimation duration of each algorithm will be expected to be lower than calculated in this study, in case of selecting frames with different number of stories and bays, different columns as (450/450) and beams as (250/500).
– Previous observations made by the author [6] indicate that RC buildings in Turkey have some structural de-ficiencies, such as (a) the end zones of beams and columns were inadequately confined (inadequate
trans-verse reinforcement ratio,Asw/sc)(b) the bottom rein-forcement of the beam supports did not have sufficient anchorage length and amount (Amount of compression bars at the support section,ρ0/ρ) (c) concrete strength was very low (fc). (d) Inadequate column cross section (inadequate lateral rigidity) (e) high longitudinal rein-forcement ratio (ρ`)and high axial load level (N/No)(f) the ends of the ties were bent 90◦. (g) Excessive beam strength. (i) No transverse reinforcement was used in joints. The present study has demonstrated that all of these selected parameters directly affected the seismic performance of building, which is a function of lateral load carrying capacity, failure load level and failure dis-placement. The analyses also indicated that a consid-erable portion of existing RC building stock in Turkey may not meet the safety standards of the Turkish Earth-quake Code (TEC-2007).
Acknowledgement. The author acknowledges support provided by
SU-BAP under Project No. 08 701 030.
Edited by: M. E. Contadakis
Reviewed by: two anonymous referees
References
Bruneau, M.: Building damage from the Marmara, Turkey Earth-quake of August 1999, J. Seismology, 6, 357–77, 2002. Igarashi, S.: Recommendations on minimizing earthquake damage
in big cities in Turkey, Proc. International Conf. on The Kocaeli Earthquake, 1, 271–286, 1999.
Yakut, A., G¨ulkan, P., Bakir, B. S., and Yilmaz, M. T.: Re-examination of damage distirbutation in Adapazari: Structural Consideration, Eng. Struct., 27(7), 990–1001, 2005.
M. Hakan Arslan: Application of ANN to evaluate effective parameters 977
Cagatay, I.: Experimental evaluation of buildings damaged in recent earthquakes in Turkey, Eng. Fail. Anal., 12, 440–52, 2005. Arslan, M. H. and Korkmaz, H. H.: What is to be learned from
damage and failure of reinforced concrete structures during re-cent earthquakes in Turkey?, Eng. Fail. Anal., 14, 1–22, 2007. Dogang¨un, A.: Performance of reinforced concrete buildings during
the May 1. 2003 Bingol Earthquake in Turkey, Eng. Struct., 26, 841–856, 2004.
FEMA-356: Prestandard and commentary for seismic rehabilitation of buildings, FEMA, 2000.
FEMA-440: Improvement of nonlinear static seismic analysis pro-cedures, FEMA, 2005.
TEC-2007, (Turkish Earthquake Code): Regulations on structures constructed in disaster regions, Ministry of Public Works And Settlement, 2007.
Sezen, H., Whittaker, A. S., Elwood, K. J., and Mosalam, K. W. : Performance of reinforced concrete buildings during the August 17, 1999 Kocaeli, Turkey Earthquake. and the seismic design and construction practice in Turkey, Eng. Struct., 25, 103–14, 2003. Bal, I. E., Crowly, H., Pinho, R., and G¨ulay, F. G.: Structural
char-acteristics of Turkish RC building stock in Northern Marmara Region for loss assesment applications, IUSS Press, 2007. UBC-97: Uniform Building Code, International Conference of
Buildings Official, USA, 1997.
IBC: The International Building Code. International Code Council, Virginia, USA, 2003.
Prakash, V., Powell, G. H., and Campbell, S.: Drain–2DX base pro-gram description and user guide version 1.10, Structural engi-neering mechanics and materials report no. UCB/SEMM-93-18, Berkeley: University of California; November, 1993.
Valles, R. E, Reinhorn, A. M., Kunnath, S. K., Li, C., and Madan, A.: IDARC 2D version 4.0: a program for the inelastic damage analysis of buildings. Technical report NCEER-96-0010, State University of New York, Buffalo, 1996.
CSI, SAP2000 V-8.: Integrated finite element analysis and design of structures basic analysis reference manual; Berkeley (CA, USA); Computers and Structures Inc., 2000.
Park, R. and Paulay, T.: Reinforced concrete structures, John Wiley & Sons, New York, 1975.
Panagiotakos, T. and Fardis, M.: Deformations of reinforced con-crete members at yielding and ultimate, ACI Structural Journal, 98(2), 135–148, 2001.
Priestley, M. J. N, Seible, F., and Calvi, G. M. S.: Seismic design and retrofit of bridges, John Wiley & Sons, New York, 1996. Corley, W. G.: Rotational capacity of RC beams, journal of
struc-tural division, ASCE, 92, 121–146, 1966.
Mattock, A. H.: Discussion of “Rotational capacity of RC beams”, journal of structural division, ASCE, 93, 519–522, 1967.
Sawyer, H. A.: Design of concrete frames for two failure states, Proceedings of the international symposium on the flexural me-chanics of RC, ASCE-ACI, Miami, November, 405–431, 1964. Naderzadeh, A. and Khademi, M. H.: A preliminary Report on the
Ardekul, Iran Earthquake of 10 May, 1997, Earthquake Hazard Centre Newsletter, 1(3), 1174–3646, 1998.
Goel, R. K.: Performance of Buildings During the January 26, 2001 Bhuj Earthquake, (http://ceenve.ceng.calpoly.edu/goel/ indian eqk/index.htm), 2001.
Karakostas, C., Lekidis, V., Makarios, T., Salonikios, T., Sous, S., and Demosthenous, M.: Seismic response of structures and in-frastructure facilities during the Lefkada, Greece earthquake of 14/8/2003, Eng. Struct., 27(2), 213–227, 2005.
Arslan, M. H., Ceylan, M., Kaltakci, M. Y., Ozbay, Y., and Gulay, G.: Prediction of Force Reduction Factor R of prefabricated In-dustrial Buildings Using Neural Networks, Struct. Eng. Mech., 27(2), 117–134, 2007.
Consolazio, G. R.: Iterative equation solver for bridge analysis us-ing neural networks, Computer-Aided Civil Infrastructure Engi-neering, 15(2), 107–119, 2000.
Hadi, M. N. S.: Neural network applications in concrete structures, Computers & Structures, Elsevier Science Ltd., 81, 373–381, 2003.
Rajasekaran, S. and Amalraj, R.: Predictions of design parameters in civil engineering problems using SLNN with a single hidden RBF neuron, Computers & Structures, Elsevier Science Ltd., 80, 2495–2505, 2002.
Tashakori, A. and Adeli, H.: Optimum design of cold-formed steel space structures using neural dynamics model, Journal of Con-structional Steel Research, Elsevier Science Ltd., 58, 1545–1566, 2002.
Inel, M.: Modeling ultimate deformation capacity of RC columns using artificial neural Networks, Eng. Struct., Elsevier Science Ltd. 29(3), 329–335, 2007.
Chen, H. M., Tsai, K. H., Qi, G. Z., Yang J. C. S., and Amini, F.: Neural networks for structural control, Journal of Computational Civil Engineering, 9(2), 168–176, 1995.
Elcordy, M. F., Chang, K. C., and Lee, G. C.: Neural networks trained by analytically simulated damage states, Journal of Com-putational Civil Engineering, 7(2), 130–145, 1993.
Mukherjee, A., Deshpande, J. M., and Anmada, J.: Prediction of buckling load of columns using artificial neural networks, Jour-nal of Structural Engineering, ASCE, 122(11), 1385–1387, 1996. MATLAB, Matrix Laboratory, Nueral Network Toolbox User