Synaptic mechanisms in experience-dependent processes responsible for the development of central neural maps of visual space.
A thesis submitted for the degree of Doctor of Philosophy in the University of London
by
Stephen G Brickley
Division of Neurophysiology and Neuropharmacology National Institute for Medical Research
ProQuest Number: 10106700
All rights reserved
INFORMATION TO ALL USERS
The quality of this reproduction is dependent upon the quality of the copy submitted.
In the unlikely event that the author did not send a complete manuscript and there are missing pages, these will be noted. Also, if material had to be removed,
a note will indicate the deletion.
uest.
ProQuest 10106700
Published by ProQuest LLC(2016). Copyright of the Dissertation is held by the Author.
All rights reserved.
This work is protected against unauthorized copying under Title 17, United States Code. Microform Edition © ProQuest LLC.
ProQuest LLC
789 East Eisenhower Parkway P.O. Box 1346
Abstract
Experience-dependent synaptic plasticity has been demonstrated in the binocular visual
system of the aquatic frog Xenopus laevis. This thesis offers further support for the
role of correlated patterns of neural activity in this synaptic plasticity and
demonstrates, for the first time, that AT-methyl-D-aspartate (NMDA)-type glutamate
receptors contribute to synaptic transmission in the optic tectum of Xenopus.
Blectrophysiological mapping techniques assessed the capacity for synaptic
reorganisations to occur in the binocular visual system of Xenopus. The intertectal
system, a series of connections that mediates binocular vision in lower vertebrates, reorganised its pattern of synaptic connections in response to large changes in the orientation of both eyes.
Stroboscopic illumination was shown to interfere with correlated patterns of neural activity in the tectum, but the development of the retinotectal projection was not affected by this procedure. However, the intertectal systems capacity to modify its pattern of synaptic connections, in response to changes in eye position, was disturbed by this visual environment.
Next, in vivo and in vitro preparations of the optic tectum were developed to monitor pre and postsynaptic activity in the visual system of Xenopus. It was established that mono-synaptic transmission between retinal fibres and tectal neurons was mediated by non-NMDA type glutamate receptors. However, when the optic tract of the adult animal was electrically stimulated the late poly-synaptic (U2) component of the evoked response was reduced by —30% in the presence of 50^M AP5. This NMD A
mediated component of the late U2 response was at its most significant 1 month after metamorphosis, was regulated by v isu i experience, and was not present in another
species of frog, Rana pipiens.
Acknowledgements
The scientific motivation for this Thesis arose from discussions with Simon Grant and Mike Keating. Unfortunately, Mike’s involvement with the work diminished due to continued ill health and Simon left the Institute for pastures new. Left to fend largely for myself mistakes were inevitable and I take full responsibility for any scientific and technical flaws present in this work. However, SO has managed to keep in regular contact (correcting this hefty tome and even participating in the odd experiment) and has been a source of much encouragement, excellent advice and endless fun.
Top man
Mike, as always, remains an inspiration.
During the final stages of this thesis I have had the good fortune to work with David Ogden, who agreed to take over as my supervisor. The section on whole cell
recording owes much to his expertise. Thank you for attempting to rescue a lost cause and I hope the frog visual system was not too nasty an experience.
The Division has been great. In particular Sukhinder Dhanjal, a benevolent
entrepreneur, has been a tireless teacher and, in no particular order Mick (temperature effect) Errington, Melanie Clements, Karen Voss, Chris Magnus, John Williams, Dave Flavell, Pete Galley, Britt Gabrielson, Marina Lynch, Debbie Withington and last, but by no means least, Elizabeth Dawes (who taught me how to map) have all made NN a great joy to work in. The bar also helped.
List of Contents
A b s tra c t...3
Acknowledgements ... 4
Abbreviations... 12
Chapter 1 Introduction 1.1. O verview ... 13
1.2. Visual maps in the optic tectum ... 14
1.3. The retinotectal projection 1.3.1. The chemoaffinity hypothesis ... 16
1.3.2. Early experiments challenging the chemoaffinity h y p o th esis... 17
1.3.3. Shifting synaptic connections in the developing retinotectal projection . . . 17
1.3.4. The possible role of neural activity in the developing retinotectal projection 18 1.4. The intertectal system 1.4.1. Intertectal plasticity during development... 22
1.4.2. Experimental assay for intertectal p lasticity ...25
1.4.3. Morphological correlates of intertectal p la stic ity ... 28
1.4.4. The lack of intertectal plasticity in other anuran amphibia...29
1.5. "Hebb" synapses and synaptic plasticity ... 30
1.6. The coicidence detection hypothesis and intertectal plasticity... 30
1.7. The NMD A receptor: a molecular coincidence detector? ... 33
Chapter 2 Materials and Methods 2.1. Animals and rearing conditions 2.1.1. Normal anim als... 36
2.1.2. Developmental staging... 36
2.1.3. Dark-reared a n im als... 37
2.1.4. Strobe-reared a n im a ls... 37
2.1.5. Eye-rotated animals ... 37
2.2. Electrophysiological mapping of binocular visual space 2.2.1. Preparation of anim als... 40
2.2.2. Recording m ethods... 40
2.2.3. Mapping procedure ... 40
2.2.4. Analysis of topographic order in the visuotectal m a p s ...41
2.2.5. Analysis of spatial registration between binocular inputs ... 41
2.3. Effects of stroboscopic illumination 2.3.1. Monitoring the acute effects of stroboscopic illumination on correlated firing patterns in the tectum ... 42
2.3.2. Analysis of acute strobe d a ta ... 43
2.3.3. Analysing the effects of strobe-rearing on the development of the retinotectal projection ... 44
2.3.4. Analysing the chronic effects of stroboscopic illumination on the intertectal p ro je c tio n ... 45
2.4.2. Examining the effect of specific postsynaptic blockers
on synaptic transmission...46
2.4.3. Analysing the effect of postsynaptic receptor antagonists in vivo ... 46
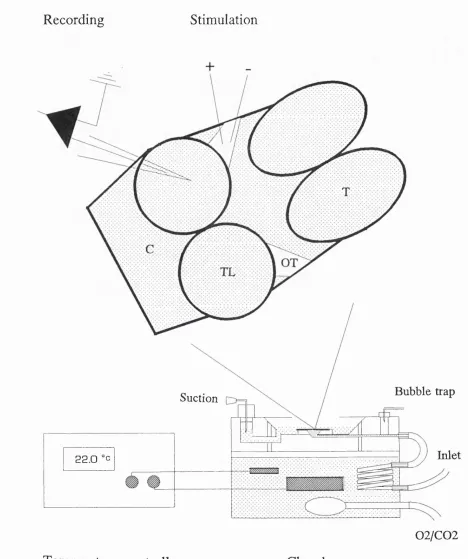
2.5. Recording extracellular responses from the whole mid-brain in vitro 2.5.1. Tissue preparation ... 49
2.5.2. Recording m ethods... 49
2.5.3. Physiological assessment of whole midbrain v ia b ility ...50
2.5.4. Calculating the U1 and U2 peak amplitude and latency to peak amplitude . 50 2.5.5. Analysing the effect of experimental perturbations on the peak amplitude of the U1 and U2 responses... 51
2.6. Intracellular recording from tectal slices 2.6.1. Slicing the optic te c tu m ... 53
2.6.2. Optical assessment of slice viability... 54
2.6.3. Cell-attached and tight-seal whole-cell recording from tectal neurons . . . . 54
2.6.4. Dye-injection experiments ... 56
2.6.5. Recording spontaneous and evoked responses from tectal s lic e s ... 56
2.6.6. Analysis of cell attached and whole cell recordings ... 56
2.7. Pharmacological a g e n ts ...57
Chapter 3 Intertectal plasticity: limitations and morphological correlates 3.1. Introduction... 58
3.2. Results ... 60
3.2.1. Double eye rotation experiments... 60
3.2.2. Eye removal experim ents... 63
3.3. D iscu ssio n ... 66
Chapter 4 Intertectal plasticity: correlated firing patterns in the tectum 4.1. Introduction ... 69
4.1.1. Acute effects of stroboscopic illum ination... 69
4.1.2. Chronic effects of stroboscopic illumination... 72
4.2. Results 4.2.1. The acute effects of IHz and 0.2Hz stroboscopic illumination on the firing patterns of sustained, event and dimmer u n i ts ... 73
4.2.2. Correlated patterns of neural activity in the tectum and normal visual e x p e rie n c e ... 80
4.2.3. The acute effects of IHz stroboscopic illumination on correlated firing patterns in the tectu m ... 83
4.2.4. The chronic effects of stroboscopic illumination on the developing retinotectal projection... 86
4.2.5. The chronic effects of stroboscopic illumination on the developing binocular visual system ... 89
4.2.6. The chronic effects of stroboscopic illumination on intertectal plasticity following single eye rotation ... 91
Chapter 5
Synaptic transmission in vivo
5.1. Introduction ...99
5.2. Results ... 100
5.2.1. Control experim ents... 103
5.2.2. Effect of non-NMDA-type glutamate receptor antagonists ... 103
5.2.3. Effect of NMDA-type-glutamate receptor antagonists... 106
5.2.4. Effect of nicotinic and muscarinic receptor an tag o n ists... 108
5.3. D iscu ssio n ... I l l Chapter 6 Synaptic transmission in vitro 6.1. Introduction ... 116
6.2. Results ... 117
6.2.1. Effect of anoxia... 123
6.2.2. Effect of removing Ca^^ or Mg^^ ions from the bathing medium ... 123
6.2.3. Effect of high frequency stimulation ... 126
6.2.4. Effect of non-NMDA-type glutamate receptor antagonists ... 128
6.2.5. Effect of NMDA-type glutamate receptor antagonists... 130
6.2.6. Effect of blocking cholinergic synaptic transmission... 132
6.2.7. Effect of GABA^ receptor antagonists ... 132
6.3. D iscu ssio n ... 135
Chapter 7 Intertectal plasticity: AP5 sensitivity of the long latency U2 response 7.1. Introduction ... 141
7.2. Results ... 142
7.2.1. Developmental change in the postsynaptic response ... 143
7.2.2. Developmental change in CNQX sensitivity... 145
7.2.3. Developmental change in AP5 sensitivity ... 145
7.2.4. Effect of dark-rearing on the postsynaptic response ... 147
7.2.5. Effect of visual experience on AP5 sensitivity ... 149
7.2.6. Comparison of the postsynaptic responses in Xenopus and R a n a... 151
7.2.7. CNQX sensitivity in Xenopus and R a n a... 155
7.2.8. AP5 sensitivity in Xenopus and R a n a... 155
7.3. Discussion... 160
Chapter 8 Slice preparation of the optic tectum 8.1 Introduction... 167
8.1.1. Anatomy of the optic te c tu m ... 167
8.1.2. Intracellular recording from the tectum ... 170
8.2. Results ... 172
8.2.1. Vital-dye staining... 172
8.2.2. Lucifer Yellow injection ... 177
8.2.3. Voltage-clamp recording ... 177
8.2.4. Current-clamp recording ... 183
Chapter 9 General Discussion
9.1. The retinotectal projection and chem oaffinity... 190
9.2. The role of activity in the developing retiniotectal projection... 193
9.3. Plasticity in the crossed isthmotectal p ro jectio n ... 196
9.4. A model for intertectal plasticity... 199
9.5. NMD A and non-NMDA receptor mediated synaptic transmission in the optic tectu m ... 201
9.6. Possible significance of the NMD A mediated U2 re s p o n s e ... 206
9.7. Possible changes in the NMD A receptor during development ... 209
9.8. Developmental plasticity in the mammalian C N S ... 211
9.9. Spatial maps in the hippocampus... 213
9.10. NMD A receptor-independent synaptic plasticity... 216
9.11. Conclusions... 217
Appendix 10.1. A computer program written for the calculation of peak amplitudes and latencies to peak in a series of tectal field p o ten tials... 219
List of Figures
Figure 1.1. The pathways responsible for the dual topographic projections of the binocular visual field present on each tectal lobe in adult frogs ... 15
Figure 1.2. Growth-related changes in eye position in developing Xenopus laevis 21
Figure 1.3. The effect of a single eye rotation on the electrophysiologically derived contralateral and ipsilateral tectal maps of visual space after 1 year of visual e x p e rie n c e ...24 Figure 1.4. The age-dependent response of the intertectal system to eye rotations of different s i z e s ... 27 Figure 1.5. The NMD A and non-NMDA type glutamate receptor complexes . . . 32
Figure 2.1 A,B & C. Electrophysiological mapping of topographic representations of visual space in the frog optic tectum ... 39 Figure 2.2. The whole brain in vitro preparation... 48 Figure 2.3. Visualisation and recording from thin slices of the optic tectum . . . . 52
Figure 3.1. The effect of binocular eye rotation on the electrophysiologically derived contralateral and ipsilateral tectal maps of visual space after 1 year of visual experience ... 62 Figure 3.2. The effect of removing the direct retinotectal input on the correct binocular
alignment of the isthmotectal projection ... 65
Figure 4.1. A schematic diagram illustrating how stroboscopic illumination disrupts the intertectal systems ability to detect correlated neural a c tiv ity ... 71 Figure 4.2. The acute effects of IHz stroboscopic illumination on the firing patterns
recorded from sustained, event and dimmer type MURFs . . . . 76 & 77 & 78 Figure 4.3. The acute effects of 0.2Hz stroboscopic illumination on the firing patterns
recorded from sustained, event and dimmer type M U R F s... 79 Figure 4.4. Examples of simultaneous extracellular recordings made from the same and
opposite tectal lobes during stimulation of non-overlapping and overlapping visual receptive fields ... 81
Figure 4.5. Cross-correlations calculated from non-overlapping and overlapping
receptive fields during visual stim ulation... 82 Figure 4.6. Cross-correlations calculated from overlapping receptive fields during IHz stroboscopic illumination ... 84 Figure 4.7. Cross-correlations calculated from non-overlapping receptive fields during IHz stroboscopic illumination ... 85 Figure 4.8. The effect of IHz stroboscopic illumination on MURFs recorded through the retinotectal projection ... 88 Figure 4.9. The results of mapping experiments illustrating how constant stroboscopic
illumination can disrupt the ability of the intertectal system to adapt to normal changes in eye position ... 90 Figure 4.10. The results of mapping experiments illustrating how constant stroboscopic
illumination can disrupt the ability of the intertectal system to adapt to a single eye rotation ... 93
Figure 5.1. Example of an extracellular recording made from the optic tectum in response to visual stimulation and a post-stimulus histogram (PSTH) constructed
from event data extracted from 10 consecutive tectal responses ... 102
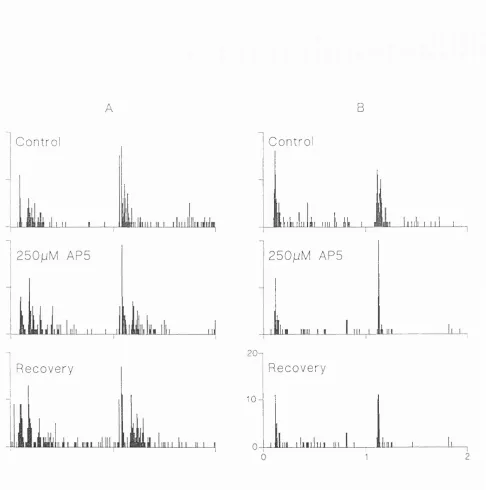
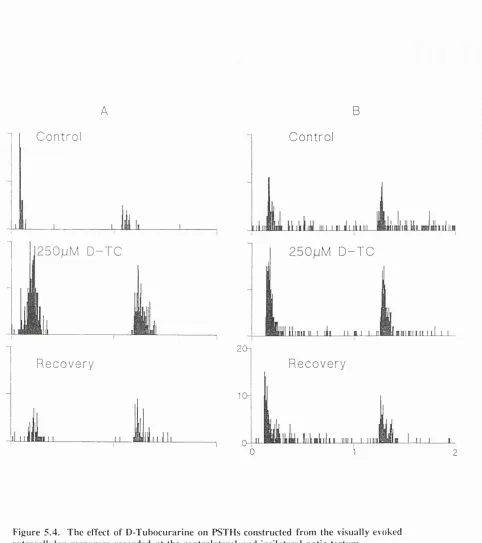
Figure 5.3. The effect of APS on PSTHs constructed from the visually evoked extracellular responses recorded at the contralateral and ipsilateral optic tectilûT Figure 5.4. The effect of D-Tubocurarine on PSTHs constructed from the visually evoked extracellular responses recorded at the contralateral and ipsilateral optic tectum ... 109 Figure 5.5. Examples of phasic discharges induced in the spontaneous firing patterns
which were recorded in the optic tectum following the application of D- Tubocurarine... 110
Figure 6.1 A typical field potential recorded at a depth of 150/xm in the tectal neuropil in response to electrical stimulation of the optic tract in vitro... 119 Figure 6.2 The effect of increased stimulus strength on the peak amplitude of the U1 and U2 response recorded 150/xm below the pial s u r f a c e ... 120 Figure 6.3 Effect of a radial penetration through the tectal neuropil ... 121 Figure 6.4 The effect of paired pulse stimulation on the amplitude of U1 and U2 responses... 122 Figure 6.5 Effect of anoxia and Ca^^ ion removal on postsynaptic responses recorded from the tectal neuropil ... 124 Figure 6.6 Effect of Mg^+ ion removal on the peak amplitude of the U1 and U2 response ... 125 Figure 6.7 Effect of high frequency stimulation on the peak amplitude of the U1 and U2 response ... 127 Figure 6.8 Effect of a non-NMDA-type glutamate receptor antagonist on postsynaptic field potentials recorded from the tectal n e u ro p il... 129 Figure 6.9 Effect of an NMD A-type glutamate receptor antagonist on postsynaptic field potentials recorded from the tectal neuropil ... 131 Figure 6.10 Effect of a nicotinic antagonist on postsynaptic field potentials recorded from the tectal neuropil ... 133 Figure 6.11 Effect of a GABA^ antagonist on postsynaptic field potentials recorded from
the tectal neuropil... 134
Figure 7.1. U1 and U2 response recorded from the tectum at different stages of developm ent... 144 Figure 7.2. The developmental change in AP5 sensitivity... 146 Figure 7.3. No effect of visual deprivation on extracellular responses recorded from different depths of the optic tectum in v i t r o... 148 Figure 7.4. The effect of visual experience on the AP5 sensitivity of the U1 and U2 response in vitro... 150
Figure 7.5. Effect of radial penetrations of the optic tectum in Xenopus and Rana 152
Figure 7.6. Stimulus strength dependency of the U1 and U2 response in Rana and
Xenopus... 153 Figure 7.7. Paired pulse stimulation in Xenopus and R a n a... 154 Figure 7.8. The effect of non-NMDA receptor antagonists on the U1 and U2 response in X en o p u s... 156 Figure 7.9. The effect of non-NMDA receptor antagonists on the U1 and U2 response in R a n a... 157 Figure 7.10. The effect of NMD A receptor antagonists on the U1 and U2 response in
R a n a... 158 Figure 7.11. The effect of NMD A receptor antagonists on the U1 and U2 response in
Figure 8.1. A schematic diagram of the neuronal cell types present in the optic tectum ... 169 Figure 8.2. Photographs of the tectal slice preparation ... 174 Figure 8.3. Photographs of the tectal slice preparation at higher magnification and following a lucifer yellow in je c tio n ... 175 Figure 8.4. Reconstructions of lucifer yellow fills from the various layers of the tectal slice preparation... 176 Figure 8.5. Slow capacitive transient recorded from a large ganglionic cell . . . 179
Figure 8.6. Voltage step experiments in pyriform neurons and large ganglionic
n e u ro n s... 180 Figure 8.7. Spontaneous postsynaptic current recorded from a pyriform neuron in the tectal slice preparation... 181 Figure 8.8. Effect of holding potential on spontaneous postsynaptic current recorded from the tectal slice preparation ... 182 Figure 8.9. Firing properties of large ganglionic cell ... 184 Figure 8.10. Firing properties of pyriform n e u ro n ... 185 Figure 8.11. Difference between individual action potential recorded from a large
ganglionic neuron and a pyriform neuron ... 186
List of Tables Table Table Table Table Table Table Table Table Table Table
3.1. Results from double eye rotation and eye removal experiments 68
4.1. The acute effect of stroboscopic illumination on coincident neural activity calculated from the cross-correlation recorded simulataneously from two M U R F s... 97 4.2. The chronic effects of strobe-rearing on binocular visual connections in the
optic te c tu m ... 98
5.1. Change in visually evoked activity recorded from the optic tectum . 114
5.2. Change in spontaneous activity recorded from the optic tectum . . . 115
6.1. Dose-response characteristics of the U1 and U2 response in the presence of CNQX and A P 5 ... 140
7.1. The characteristics of the U1 and U2 response during development . 163
7.2. Changes in the pharmacology of the U1 and U2 responses during
developm ent... 164
7.3. The effect of visual experience on the U1 and U2 re sp o n se s 165
7.4. Comparison of the U1 and U2 response in Rana and Xenopus . . . . 166
Abbreviations
AMPA a-amino-3-hydroxy-4-isoxazole propionic acid
ANOVA analysis of variance
AP5 2-amino-5-phosphonovaleric acid
CC cross correlation
CNQX 6-cyano-7-nitroquinoxaline-2,3-dione
CNS central nervous system
CPP 3-((+ )-2-carboxypiperazin-4-yl)propyl-1 -phosphonic acid
D-TC D-tubocurarine
EB ethidium bromide
FDA fluorosceine diacetate
G ABA 7 -Aminobutyric acid
HRP horse radish peroxidase
LED light emitting diode
LY lucifer yellow
MS222 Tricaine-methanesulphonate
MURE multi-unit receptive field
NI nucleus isthmi
NMDA N-methyl-D-aspartate
PSTH post-stimulus time histogram
RGC retinal ganglion cell
SC superior colliculus
Chapter 1
Introduction
1.1. Overview
The elaboration and maintenance of topographic representations of sensory
space offer a compelling insight into the processes governing neural development.
These maps can be demonstrated with electrophysiological and anatomical techniques.
One electrophysiological approach is to record neural activity at systematically varied
positions in the central nervous system (CNS) in response to stimuli at defined
locations in the external world or on the body surface. This approach demonstrates
that topographic maps precisely convey the spatial information of a given sensory
modality within the neural array and that these arrays are joined by orderly patterns of
nerve connections. However, the processes governing the development of order
within these nerve connections are poorly understood. The initial elaboration of maps
is thought to be governed by intrinsic genetically determined factors, such as cell
surface markers, which guide the early afferent inputs to their appropriate locations in
the CNS array to establish the initial order of the projection. However, it is evident
that in some developing neural systems disturbance in the normal pattern of neural
activity, during critical developmental periods, results in long-term changes in the
order of connections. It is hypothesised that activity-dependent processes are involved
in the final generation of topographic order within the CNS subsequent to the
successful completion of genetically determined events.
Neural activity in the brain can be generated by two different sources: either
intrinsically, by the spontaneous firing of CNS neurons themselves, or extrinsically as
a result of stimuli in the environment. A role for both spontaneous and evoked
neural activity in the changes which occur within the synaptic circuitry of the CNS
has been demonstrated in several disparate neuronal systems. Early experience seems
to exert a particularly powerful influence on the elaboration and maintenance of those
synaptic connections which are concerned with integrating information from two
receptor surfaces, such as the two eyes. This thesis describes experiments concerned
with the development of binocular visual connections in the main visual centre, the
mid-brain optic tectum, of the frog, Xenopus laevis (figure 1.1). Experiments were
designed to investigate the experience-dependent synaptic changes that occur in this
them. Before describing these experiments I will discuss work describing synaptic
plasticity in the optic tectum and has suggested a role for spontaneous and visually
evoked activity in these changes.
1.2. Visual maps in the optic tectum
The optic tectum, a bi-lobed nucleus situated in the mid-brain, is the primary
visual centre in anuran amphibia and mediates prey catching and behaviour (Ewert,
1976). In the aquatic frog Xenopus laevis each tectal lobe receives a topographically
organized representation of visual space originating from the contralateral and
ipsilateral eye (Gaze, 1958b). This is not true for all lower vertebrates, for example
there is no ipsilateral input to the tectal lobe in the goldfish, carassius auratus. In these visuotectal topographic representations information from the nasal portion of the
visual field projects through both eyes to the rostral aspect of each tectal lobe, the
temporal visual field projects to caudal tectum, the superior visual field projects to
medial tectum and the inferior visual field projects to lateral tectum (see figure 1.2).
Input from the contralateral eye is direct and mediated by the completely crossed
retinotectal projection (Gaze, 1958a). Input from the ipsilateral eye arrives via a
commissural (intertectal) projection involving a relay at the nucleus isthmi (NI),
another bilateral nucleus situated caudal to the tectum (Gruberg and Udin, 1978). The
intertectal relay between the tectal lobes involves a projection between the tectal lobe
and the ipsilateral NI (the uncrossed tecto-isthmic projection) followed by a crossed
projection from that ipsilateral NI to the opposite tectal lobe I (the crossed isthmo
tectal projection). The projection between each tectal lobe and its ipsilateral NI is a
reciprocal one (the uncrossed isthmo-tectal projection). In adult frogs the presence of
this intertectal relay is organised such that one point in the binocular visual field
projects through both eyes to a common point on each lobe of the nucleus (see figure
1.1). This intertectal system of connections may provide the stereoscopic cues
necessary for the computation of visual depth during prey-catching in anuran
Visual Field
Retina
Optic Chiasm
Post-optic Commisure
Tectum
Nucleus Isthmi
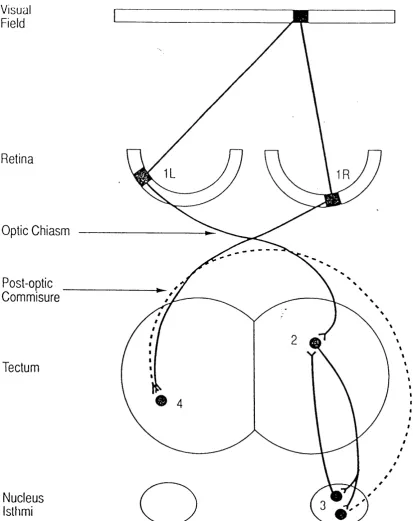
Figure 1.1. The pathways responsible for the dual topographic projections o f the binocular visual field present on each tectal lobe in adult frogs.
If we consider a point in the binocular visual field it projects to one point on each retina (IR and IL), The point on the left retina (IL) projects directly to point 2 on the right tectal lobe via the crossed retinotectal pathway and the corresponding point on the right retina (IR), which receives matched binocular input, projects to point 4 on the left tectum via its crossed pathway. Point 2, on the right tectum, is reciprocally linked to point 3 in another topographically organized mid-brain structure; the nucleus isthmi. The crossed isthmotectal projection (dotted line), conveys information about point 2, back across the mid-line through the post-optic commissure to its binocularly matched input, point 4, on the opposite tectal lobe. Point 4 on the left tectal lobe also projects to a point on its ipsilateral nucleus isthmi, which sends a projection, in turn, to point 2 on the right tectal lobe (Not shown). This means that a point in the binocular visual field can be mapped at one position on each tectal lobe through both eyes. In adult frogs, the "intertectal" system links all paired tectal locations receiving matched visual input from the binocular portion of visual space. Because the pathway from an eye to its ipsilateral tectum is polysynaptic, visual information usually arrives through this pathway some 10-30msec after its arrival through the direct retinal pathway from the contralateral eye.
Note: in the depiction o f the crossed and uncrossed isthmotectal pathways, the projections are shown as
arising from different populations o f isthmic neurons. This arrangement has been described in Rana
1.3, The retinotectal projection
1.3.1. The chemoaffinity hypothesis.
The notion of specific chemoaffinity markers establishing order within the
developing CNS achieved prominence following experiments Roger Sperry performed
on the entirely crossed retinotectal projection (reviewed by Sperry, 1963). After
regeneration of the optic nerve, in newts and anura which had one eye rotated by
180°, Sperry showed that the animals oriented incorrectly to visual stimuli (Sperry,
1943). Sperry interpreted the results of these behaviourial experiments as indicating
that the optic nerve fibres had regenerated to their specified target sites in the tectum.
He concluded that ordered synaptic connections are the product of neuronal
specificity. The chemoaffinity hypothesis states that specific markers exist on pre-
and postsynaptic elements such that synaptic connections are only established between
those neurons bearing the appropriate labels. Indeed, the polarity of the retinotectal
projection is specified very early in larval development. Gaze and colleagues (1979b)
have demonstrated that 180° rotation of the eye primordium in Xenopus between
stages 21-30, before retinal ganglion cell (RGC) axons have arrived in the tectum,
results in the establishment of an inverted map, implying that the mapping polarity is
specified before this stage of development. We now know that optic fibres arrive in
the tectal neuropil at very early stages of development before any postsynaptic targets
have matured (Gaze and Grant, 1992a). Older fibres lie deep within the optic tract
displaced medially toward the midline of the brain and newly arriving fibres are
positioned superficially in the lateral edge of the tract. The order of these fibres
within the optic tract establishes much of the early topography within the tectum.
However, it is still supposed that labels on presynaptic fibres and postsynaptic cells
play a key role in organizing the polarity of the early projection and in establishing its
initial topographic order across the tectum. More recent work (Bonh^ffer and ^
Gierer, 1984) has attempted to identify growth factors on the rostro-caudal and medio-
1.3.2. Early experiments challenging the chemoaffinity hypothesis.
The view that connections between RGC axon terminals and tectal neurons are
solely determined by intransigent sets of markers was first challenged by the outcome
of so called "size-disparity" experiments. The first of these (Attardi and Sperry,
1963) supported the chemoaffinity hypothesis by showing that a half retina, when
regenerating into a whole tectum, initially re-establishes connections with the
appropriate half of the nucleus. Jacobson and Gaze (1965) then showed, in the
converse experiment, that a full retina will not compress its regenerated projection
onto half a tectum. These seemingly unequivocal demonstrations that RGCs respect
tectal boundaries based upon their matching positional specificities did not withstand
further experimentation. In 1970 Gaze contradicted his previous findings by
describing the compression of an intact retina onto a half tectal lobe (Gaze and
Sharma, 1970). This was followed by a series of papers demonstrating that a half
retina will also expand onto a whole tectum (Horder, 1971; Yoon, 1972a&b; Schmidt
et a l , 1974 & 1977). The only change in the experimental procedure was time. The earlier experiments examined the initial regenerated retinotectal projection up to 3
weeks after the manipulation whereas the later studies examined the status of the
projection after at least Vh months. This result does not support the idea that chemospecific markers restrict absolutely the termination of retinal fibres to pre
defined areas of the tectum.
1.3.3. Shifting synaptic connections in the developing retinotectal projection.
It is now apparent that, in addition to the synaptic plasticity exhibited by the
retinotectal projection during certain conditions of regeneration, the maturation of the
retinotectal projection also proceeds in a manner inconsistent with immutable markers.
In Xenopus, the retina grows by addition of new neurons to the ciliary margin throughout larval life and this continues into adulthood, while neurons are added to
the tectum only at its caudal margin during larval life after which tectal histogenesis
appears to cease (Straznicky and Gaze, 1971; 1972; Grant and Keating, 1986). The
observation that a topographically organized retinotectal projection is demonstrable
from very early larval stages (Gaze et al. , 1974) led to the suggestion that a
progressive shift of retinotectal synapses occurs throughout development. Initially
new temporal RGC axons invade the rostral tectum causing a progressive shift of
retinal fibres into caudal tectum as the developing retinotectal projection expands
RGCs projecting to the tectum still increases but with no corresponding increase in the
tectal cell number. It has been suggested that newly arriving retinal ganglion cell
axons may compete for target space and/or trophic molecules derived from the optic
tectum. This process should lead to the stabilization of connections formed by
competing cells and to the death and elimination of cells that fail to compete
successfully. Therefore, development of the retinotectal projection should be
accompanied by cell death in the retina. Neuronal cell death is emerging as a
fundamental feature of nervous system development in vertebrates. Indeed, in the cat
80% of RGCs are eliminated birth (Williams et a l, 1986). It has recently been
shown in Xenopus that cell death begins at the onset of metamorphosis, at about stage 57, and is completed by the end of metamorphosis. However, only 10% of the total
RGC population is lost during this time (Gaze and Grant, 1992b) and so it is uncertain
to what degree this phenomenon contributes to the developing retinotectal projection.
Therefore, it has been suggested that, in Xenopus, changes are made in the pattern of synaptic connections formed between retinal fibres and tectal cells from at least stage
45 of larval life until adulthood (Gaze et a l, 1979a). Evidence for shifting synaptic connections between optic axons and tectal dendrites also exists in the developing
retinotectal projection of another frog, Rana pipiens, (Reh and Constantine-Paton, 1984) and the goldfish, carassius auratus (Easter and Stuermer, 1984).
1.3.4. The possible role of neural activity in the developing retinotectal
projection.
What cues could orchestrate these orderly shifts in synaptic connectivity? One
possibility is that these synaptic changes are activity-dependent. It is known that
spontaneous firing patterns between neighbouring RGCs exhibit much greater temporal
correlation than do the firing patterns of separated ganglion cells (Arnett, 1978). It
has been proposed that spontaneous correlated firing patterns stabilize synaptic
connections in the retinotectal projection due to the ability of the tectal neurons to
respond to the coincident neural activity of neighbouring RGCs. Neighbouring RGCs
would selectively make synaptic connections on the dendrites of common tectal
neurons due to the coincident neural activity they exhibit. Spontaneous firing patterns
are not removed by visual deprivation so dark-rearing should not alter the plasticity
demonstrated in the retinotectal projection. In support of this, investigations into the
normal developmental changes in this pathway in Xenopus have shown that the
precision of the retinotectal projection does not depend upon visual experience (Dawes
et a l, 1984; Keating et a l, 1986). Animais reared in total darkness from stage 35/36, prior to the onset of visually driven electrical activity in the retina (Witkovsky
et a l, 1976), showed no change in the topographic order, receptive field size and the distribution of retinotectal unit types within the superficial layers of the tectal lobe.
So what evidence is there to implicate the spontaneous neural activity of RGCs
in the normal development of the retinotectal projection. Harris (1980 & 1984)
directly investigated the role of neural activity in the developing retinotectal projection
of the newt. The embryonic eye cup from Ambystoma trigrinum was transplanted into
an embryonic newt of the species Taricha toross. This latter species manufactures Tetrodotoxin (TTX), a Na^ channel blocker, in sufficient quantities to suppress action
potentials in a TTX-sensitive species such as Ambystoma. The transplanted eye from
Ambystoma grew in an environment in which it was incapable of generating action potentials. Anatomical assessment established that the retinotectal projection was
topographically organized. Recently, Stuermer et al. (1990) reported that in embryonic zebra fish intraocular injection of TTX had no effect on the normal
development of the retinotectal map. These data casts some doubt on the role of
spontaneous neural activity in the generation of the precise pattern of connections
which distinguishes the mature retinotectal projection. However, electrophysiological
mapping of the retinotectal projection was not possible in the presence of TTX and the
anatomical tracing techniques may not reveal small differences in the precision of the
topographic projection.
In the "three eyed frog" preparation, a third eye primordium is implanted into
an embryo so that two retinae innervate one tectal lobe. In this artificial situation the
axon terminals of two retinotectal projections segregate into a pattern of eye-specific
stripes in the doubly-innervated tectal lobe (Constantine-Paton and Law, 1978).
Repeated intra-ocular injections of TTX, to block neural activity, prevents the eye /
specific segregation of afferent terminals (Boss and Schmidt, 1982; Meyer, 1982; Reh ^
and Constantine-Paton, 1985). In other experiments the exceptional capacity of the
optic nerve to regenerate into the optic tectum has been used to investigate activity-
dependent synaptic plasticity in the retinotectal system. It has been shown that
intraocular injection of TTX disrupts the topographic order of the regenerated
retinotectal projection (Meyer, 1983; Schmidt and Edwards, 1983; Olson and Meyer,
1991). Finally, it has been shown that exposing animals to stroboscopic illumination,
a procedure which is postulated to interfere with the correlated patterns of spontaneous
retinal activity, disrupts the topographic order of the regenerated retinotectal
projection (Schmidt and Eisele, 1985; Cook and Rankin, 1986; Cook, 1987 & 1988).
Dark-rearing is also reported to have no effect on the topographic order of the
regenerated retinotectal projection (Cook and Becker, 1990; Olson and Meyer, 1991)
indicating that the important information is carried by the spontaneous neural activity
of RGCs rather than by visually-evoked activity. The only reported exception to this
is a study by Schmidt and Eisele (1985) which showed an enlargement of receptive
fields in the regenerated projection of visually deprived animals.
In light of the evidence supporting a role for spontaneous neural activity in the
experimentally induced reorganisation of this projection it has been postulated that a
postsynaptic mechanism exists in the tectum to detect correlated patterns of neural
activity in neighbouring retinal fibres. Stabilization of convergent synaptic inputs onto
common tectal cells could occur through a postsynaptic mechanism ensuring
topographic order in the developing retinotectal projection. However, in Xenopus,
there is no evidence to suggest that patterned neural activity plays any role in the
normal development of the retinotectal projection. Therefore, the effect of chronic
exposure to stroboscopic illumination on the development of the retinotectal projection
in Xenopus was examined in Chapter 4. As part of this study the acute effects of stroboscopic illumination on correlated firing patterns recorded through the retinotectal
projection was examined to assess whether this pattern of stimulation did disturb the
7-6
5-
4-
3-2
-0- ■ih
2
8/52 1
2/52
•2/52 j
Larval Met Ju v e n ile Adult TIME FRO M M E T A M O R P H O S IS (y e a rs)
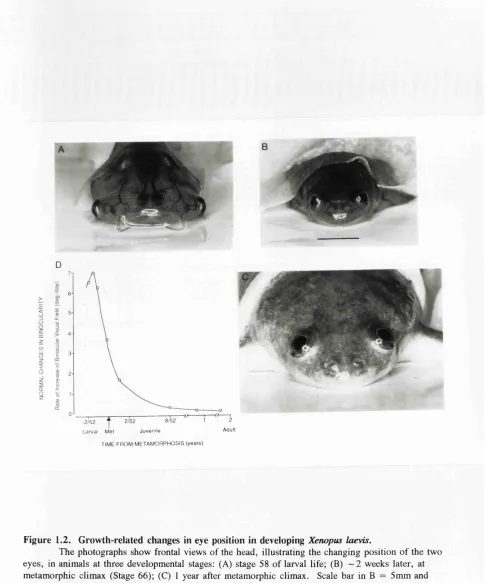
Figure 1.2. Growth-related changes in eye position in developing Xenopus laevis.
The photographs show frontal views of the head, illustrating the changing position o f the two eyes, in animals at three developmental stages: (A) stage 58 o f larval life; (B) ~ 2 weeks later, at metamorphic climax (Stage 66); (C) 1 year after metamorphic climax. Scale bar in B = 5mm and applies to all photographs. During this developmental period, the eyes migrate from lateral to
frontodorsal positions in the head. As a result, the binocular visual field enlarges. (D) Shows the rate o f this enlargement, expressed in degrees/day and plotted as a function o f age. The data used to construct this function were derived from quantitative ophthalmoscopic studies o f eye migration in
Xenopus. These have shown that at the following developmental stages the average horizontal extent of the binocular field o f view, as measured in the plane containing the two optic axes are: stage 58 = 20°; stage 60 = 33°; stage 62 = 55°; stage 64 — 82°; stage 66 = 100°; 2 weeks postmetamorphosis (PM) = 122°; 13 weeks PM = 138°; 1 year PM = 148°; adult (> 2 y e a rs PM) = 160°. The average time that elapses between these various developmental stages are: stages 58-60, 2 days; stages 60-62, 3 days; stages 62-64, 4 days; stages 64-66, 5 days.
(Taken from: M .J.Keating and S.Grant, "The critical period for experience-dependent plasticity in a system o f binocular visual connections in Xenopus laevis: its temporal profile and relation to normal developmental requirements". European Journal of Neuroscience, (1992), Vol 4, pp 27-36.)
1.4. The intertectal system
1.4.1. Intertectal plasticity during development.
In Xenopus, the commissural system of connections described in section 1.2 is confronted with a difficult developmental problem which is also related to growth
changes in the periphery (figure 1.2). Maturational changes in skull shape and size
continuously alter the geometrical relationship between the two eyes. In larval life the
two eyes are situated on the side of the head and so face laterally with little binocular
overlap present between the two eyes. During metamorphosis the two eyes move in a
nasal and dorsal direction as the skull changes shape and so the degree of binocular
overlap increases. These movements continue until adulthood when the two eyes
reach their final position on the top of the head (Grobstein and Comer, 1977; G ^(^t %
and Keating, 1986). Consequently, the nasotemporal extent of the binocular visual
field, assayed using optical techniques, increases from 30° to 162° between the onset
of metamorphic climax at stage 60 and adulthood, some years after metamorphosis
(Grant and Keating, 1989a).
Electrophysiological mapping experiments also demonstrate that the portion of
the optic tectum which receives binocular visual input increases as the degree of
binocular overlap gets larger. It has been shown that the proportion of each tectal
lobe devoted to the representation of the binocular visual field increases from 11% at
stage 60 to 77% in the adult (Grant and Keating, 1989a). In addition, changes in
ocular geometry affect the points on each retina which are receiving matched
binocular visual input. The intertectal series of connections has to accommodate for
this expansion and link those changing points on each tectal lobe which receive
matched binocular visual input. Electrophysiological mapping experiments have
demonstrated that, between stage 60 and adulthood the ipsilateral visuotectal
projection, which is a product of the intertectal system, increases in size as the
binocular visual field and its tectal representation enlarges. Moreover, throughout this
period, the ipsilateral visuotectal projection maintains its spatial registration with the
contralateral visuotectal projection from the other eye. These data suggest that during
the course of normal maturation the intertectal system undergoes a process of
expansion and ordered remodelling of its synaptic connections.
The normal maturation of the intertectal system in Xenopus has been shown by
electrophysiological mapping experiments to rely upon visual experience (Keating,
placed into total darkness before the onset of visual function in the intertectal pathway
until terminal electrophysiological experiments were performed. It was shown that
visual deprivation did not affect the developmental ocular migration that normally
occurs in Xenopus (Grant and Keating, 1989b), nor did it affect the normal maturation
of the contralateral visuotectal projection (Grant et al., 1986; Keating et a l , 1986). However, abnormalities were observed in the ipsilateral visuotectal projection.
Following short periods of dark-rearing the spatial registration of the binocular visual
inputs was fairly precise, even though there were no visual cues available during the
initial construction of the projection (Grant and Keating, 1989b). But later in
development, following longer periods of visual deprivation, the order in this
projection and its registration with the contralateral visuotectal projection deteriorated.
Quantitative analysis of the degree of spatial registration of the ipsilateral visuotectal
projection revealed that it was considerably poorer and was systematically shifted,
compared to the pattern of connections observed in normal controls (Grant and
Keating, 1989b). Also, ipsilateral multi-unit receptive fields in dark-reared animals
were considerably larger than in normal animals (Keating and Kennard, 1987). This
evidence suggests that, in Xenopus, the initial elaboration of the intertectal series of connections is intrinsically derived but later modifications, in response to changing
B
U
M
U
Visual Field
B
A •
M B
Tectum
Lateral
Rostral
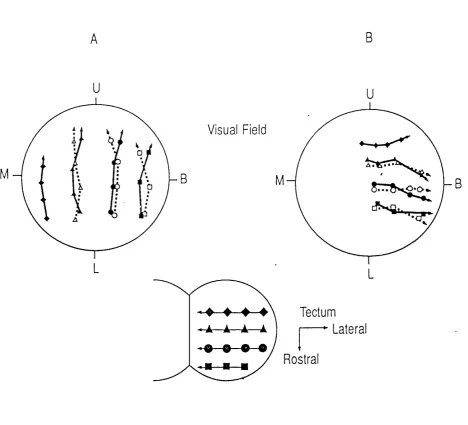
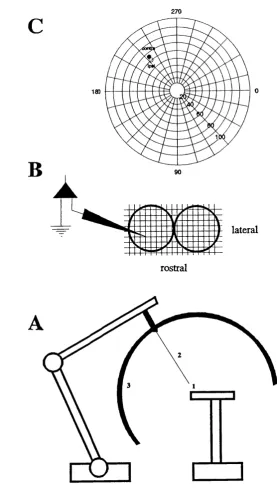
Figure 1.3. The effect of a single eye rotation on the electrophysiologically derived contralateral and ipsilateral tectal maps of visual space after 1 year of visual experience.
The diagram o f the optic tecta shows the outlines, transposed from a photograph o f the dorsal surface, upon which a 100/xm grid was superimposed. Rostral and lateral directions are indicated by the label. T he symbols on the tectal diagram represent the sites o f vertical microelectrode penetrations. The two large circles (A & B) denote perimetric chart representations o f the visual field, w ith the optic axis o f the right eye centred on the fixation point o f the perimeter. In A the maps from the
contralateral (solid lines) and ipsilateral (dotted lines) eyes are shown from a normal animal 1 year postm etam orphosis. In B the contralateral and ipsilateral maps are depicted from a 1 year
postm etam orphic animal at the same age which had received a 90° rotation o f its (left) eye in larval life. The indirect nature o f the ipsilateral visuotectal pathway is indicated by the dotted lines and open sym bols w ithin the visual field representations. For each microelectrode penetration the centre o f the region o f visual space, stimulation o f which produced unitary potentials at that electrode site, when viewed by either the contralateral (solid symbols) or ipsilateral (open symbols) eye, is indicated by the corresponding symbol on the chart representation. M , B, U and L are the monocular, binocular, upper and low er aspects o f the visual field o f the tested eye. Note that the two visual projections to each tectum are in full spatial register in both the normal (A) and the eye rotated animal (B).
1.4.2. Experimental assay for intertectal plasticity.
Further evidence that experience-dependent mechanisms contribute to the
alterations which take place in the developing intertectal pathway was derived from
observing the effects of experimental perturbations on this pathway. Larval animals
were given a single eye rotation to rotate the visual input that is relayed directly to the
opposite tectal lobe (figure 1.3). So, following a 180° eye rotation the nasal portion
of the visual field no longer projects to the rostral aspect of the opposite tectal lobe
but now projects to caudal tectum: similarly, the superior visual field no longer
projects to the medial aspect of the opposite tectal lobe but now projects to lateral
tectum. Electrophysiological mapping of binocular visual inputs one year after a
single eye rotation demonstrated that the ipsilateral map of binocular visual space,
mediated by the intertectal pathway, alters the pattern of its connections so that it
acquires alignment with the rotated contralateral map (Gaze et al. , 1970) but that this synaptic plasticity fails to occur if the animals are dark-reared after the operation
(Keating and Feldman, 1975). However, the experience-dependent synaptic
modifications which take place in the intertectal pathway do not occur immediately.
In accordance with earlier conclusions, about the importance of intrinsic mechanisms
in the initial elaboration of this pathway, the orientation of the earliest ipsilateral
visuotectal projections were found to be normal. The visual input from the ipsilateral
eye is initially out of register with that recorded through the rotated, contralateral eye.
Modifications in the intertectal system were not seen until several weeks after
metamorphosis (Grant and Keating, 1992). Electrophysiological mapping experiments
described in Chapter 3 investigated whether intertectal plasticity could also take place
following a double eye rotation in larval life.
The capacity of the intertectal system to adapt to a single eye rotation reduces
with age. In the extensive study of Keating and Grant (1992) one eye was rotated to
different degrees (from 20° to 180°) in 238 animals of various developmental stages
(from mid-larval to adult life) and the intertectal pattern of connections was
electrophysiologically mapped 1-2 years post-operatively. It was found that in animals
which received a single eye rotation up to 2 weeks before metamorphosis the
intertectal system completely modified its pattern of connections in response to any
size of eye rotation. However, no animal exhibited this intertectal plasticity in
response to even the smallest eye rotation if the operation was performed at 3 months
postmetamorphosis or older. At intervening ages, altered intertectal connections were
a "critical period" was defined around the time of metamorphosis at which intertectal
plasticity would occur. Moreover, the temporal profile of this critical period was
shown to correlate with the changes in eye position which normally occur in Xenopus
as a consequence of growth. So, the capacity for intertectal plasticity is greatest at
that stage in development when growth related changes in eye position are at their
180
150
120 O
cr > 9 0
LU
Ü_
O
a 60
ceo
LU
Q
3 0
□ O O O □ □
...
l.222^
S t a g e 5 0 - 5 6 5 8 6 0 6 2 6 3 6 4 6 5 m e t 2 ~ / h 8 13 2 6 W P M -ih Adult DEVELOPMENTAL STAGE AT WHICH EYE WAS ROTATED
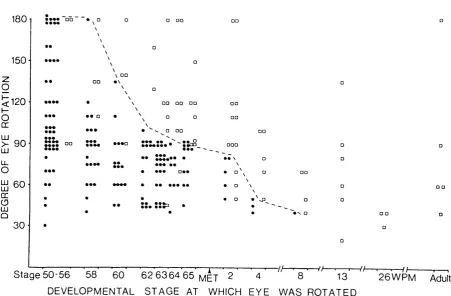
Figure 1.4. The age-dependent response of the intertectal system to eye rotations of different sizes.
The abscissa shows the age at which the eye rotation was given. The ordinate shows the size o f the eye rotation present at terminal mapping. Each symbol depicts the result obtained from one animal; filled circles, animal showing "binocular interaction", indicative o f a reorganized intertectal system; open squares, animals showing "non-interaction", indicating no change in the intertectal system. The dotted line shows the transition point between the two results obtained from groups o f animals at the same age. (Taken from: M .J.K eating and S.G rant, "The critical period for experience-dependent plasticity in a system o f binocular visual connections in Xenopus laevis: its temporal profile and relation to normal developmental requirem ents." European Journal o f Neuroscience, (1992), Vol 4, pp 27-36.
1.4.3. Morphological correlates of intertectal plasticity.
Horseradish peroxidase (HRP) labelling studies have shown that the alterations
demonstrated electrophysiologically in the intertectal series of connections take place
in the crossed projection from the NI to the tectal lobe (Udin and Keating, 1981;
Udin, 1983). This crossed isthmotectal projection is the final part of the relay which
is responsible for the dual representation of binocular visual space on each tectal lobe
(see figure 1.1). Following HRP injection into the NI it was shown that HRP labelled
crossed isthmotectal fibres follow abnormal trajectories in eye rotated animals (Udin,
1983). Tracing of individual axons in fiat-mounted, unsectioned tecta (Udin and
Keating, 1981) demonstrated that crossed isthmotectal axons in normal Xenopus follow
a route which is approximately rostrocaudal, with neighbouring axons exhibiting a
tendency to run parallel with one another. Analysis of crossed isthmotectal axon
trajectories in eye rotated Xenopus suggest that these axons reach their new locations
after passing through their normal locations. The axons now cross one another and
run in medial and lateral directions as well as the normal rostrocaudal polarity. It has
been postulated that terminal arbors travel first to normal unrotated locations and then
follow a circuitous route to the newly appropriate tectal location. Data in Chapter 3
demonstrates that, under certain conditions, these earlier termination sites can also be
identified electrophysiologically.
It is more difficult to demonstrate anatomically that ordered shifts in the
crossed isthmotectal projection occur during normal development. However, Udin
and Fisher (1985) demonstrated that at stage 60, when binocular overlap is limited to
11% of the tectal neuropil, dense terminal arbors of crossed isthmotectal fibres were
only present in the rostral portion of the tectum where this limited binocular overlap is
represented. Such dense terminal arbors were found at progressively more caudal
tectal locations as the tectal area responsible for the representation of the binocular
visual field increased (Udin, 1989). However, many of the axons have branches
growing away from the main arbor into monocular tectal areas, while others branch
extensively over the tectum and have no obvious dense terminal arbor. Udin et al.
(1992) demonstrated, following analysis of HRP impregnation at the electron
microscope level, that crossed isthmotectal axons do make synapses in monocular
tectal regions. Extending earlier work by Udin, Fisher and Norden (1990) in adult
Xenopus, they also demonstrated that the vast majority of crossed isthmotectal
synapses in young animals, including those located ectopically in caudal tectum were
Therefore, it appears that the majority of crossed isthmotectal synaptic connections are
made with the dendrites of tectal neurons, but the distribution of these connections
changes with development.
1.4.4. The lack of intertectal plasticity in other anuran amphibia.
Not all anurans are capable of the synaptic plasticity which has been described
in the binocular visual system of Xenopus laevis. Dark-rearing did not affect the
normal degree of spatial alignment between the two visual projections to the tectum in
the frog Rana pipiens although multi-unit receptive fields (MURFs) recorded through
the ipsilateral eye were enlarged (Jacobson, 1971). This suggests, the frog Rana
pipiens is also not able to adapt its series of intertectal connections to a monocular eye rotation apportioned in early larval life even, after over 200 days of normal visual
experience. (Jacobson and Hirsch, 1973). However, it is now known that Rana does
not face the same developmental obstacles that Xenopus is confronted with.
Throughout its pre- and postmetamorphic development the changing ocular geometry
experienced by Xenopus necessitates systematic alterations in the alignment of its
binocular tectal maps. In Rana, these changes in relative eye positions are much
smaller (Grobstein and Comer, 1977) and, hence, the requirement for intertectal
plasticity is considerably reduced. Kennard and Keating (1985) demonstrated that a
genuine species difference did exist between Xenopus and Rana, in the capacity of this
system to respond to early eye rotation and postulated that the manifestation of
intertectal plasticity in Xenopus was related to the larger changes in eye position which occur during development. In another species of anuran, the Australian green and
golden tree frog {Hyla moorei), the eyes also maintain their relative positions from
metamorphic climax onwards. Hyla also resembles Rana in not adjusting its
1.5. "Hebb” synapses and synaptic plasticity.
In 1949, D.O. Hebb proposed a specific mechanism for producing functional
change at developing synapses suggesting that:
"When an axon o f cell A is near enough to excite a cell B and repeatedly or persistently takes part in firing it, some growth process or metabolic change takes place in one or both cells such that A ’s efficiency, as one o f the cells firing B, is
increased. "
(Hebb, D.O., 1949)
The Hebbian synapse rule postulates, with little experimental evidence to
support it, that synaptic stability improves when there is temporal correlation of firing
between pre- and postsynaptic elements. This rule, in its elementary form, does not
explain many forms of activity-dependent synaptic plasticity in the CNS. For
example, Carew et al. (1984) have demonstrated that firing of the postsynaptic neuron
is not required in the synaptic plasticity which underlies conditioning in Aplysia. This form of activity-dependent synaptic plasticity only requires that the neural activity in
the presynaptic cell be paired with a facilitatory input. Similar modification of the
Hebbian synapse rule may make it applicable to the consolidation of appropriate
retinotectal and isthmotectal inputs onto common tectal dendrites. The activity-
dependent synaptic plasticity which is exhibited in the experimentally manipulated
retinotectal projection may only require that the spontaneous neural activity of
neighbouring RGCs be sufficiently correlated for synaptic stabilisation to occur. In
the intertectal system it would require that the presynaptic neural activity arriving
through the retinotectal and crossed isthmotectal projections be sufficiently correlated
before synaptic stabilization would occur.
1.6. The coicidence detection hypothesis and intertectal plasticity
We know that intertectal synaptic plasticity accommodates the binocular visual
system of Xenopus laevis to drastic changes in eye position. The plasticity is
orchestrated by visual experience and is restricted to a critical period of development
when eye positional changes are occurring. Moreover, the phenomenon has been
demonstrated to involve actual anatomical shifts in the spatial location of crossed
isthmotectal terminal arbors. The coincidence detection hypothesis, as suggested by
Keating (1968), could explain the modifications which take place in the intertectal
system following normal changes in eye position and following experimentally induced
The hypothesis states:
connections are formed, not by the action o f the innate mechanism o f neuronal specificity but by a functional interaction between the two eyes. Those positions on the two tecta that are simultaneously receiving a similar spatiotemporal pattern o f impulses through the two eyes from a stimulus at one position in the binocular visual field, become neuronally linked together. "
(Gaze, Keating, Székely and Beazley, 1970).
Or, in brief this adaptation of the Hebbian rule states that connections that
fire together, wire together. It is currently supposed that those positions on each
tectal lobe which receive their direct contralateral input from positions of retinal
correspondence will exhibit correlated firing patterns (see Chapter 4 for a
demonstration of this phenomenon). The ability to recognise this coincident neural
activity is thought to enable systematic changes in the anatomy of this system to
occur. As the eyes change position so those neural elements which receive matched
binocular visual input and, therefore exhibit correlated firing, would alter. The
capacity to link changing positions on each tectal lobe which exhibit coincident neural
activity would enable intertectal plasticity to occur. This hypothesis is supported by
dark-rearing, a procedure which completely removes correlated firing between
matched binocular inputs. In the absence of all visual cues intertectal synaptic
plasticity does not take place. Experiments were undertaken to further test the
validity of the coincidence detection hypothesis (Chapter 4) with relation to intertectal
plasticity. Stroboscopic illumination was used to subvert the correlated patterns of
neural activity which occur during binocular visual stimulation. Following each
strobe flash all points in the visual field and, therefore, all points across the retina
should be simultaneously activated. If this is the case, then strobe-rearing should
make the process of coincidence detection impossible for the binocular visual system
and obstruct intertectal plasticity. However, this procedure could also interfere with
activity-dependent synaptic plasticity in the developing retinotectal projection and so
NMDA receptor
A P V N a
N M D A
C a
\ i /
P C P M K 8 0 1
M g
AMPA receptor
C N Q X
m o d u l a t o r y p r o t e i n
N a
A M P A
\ /
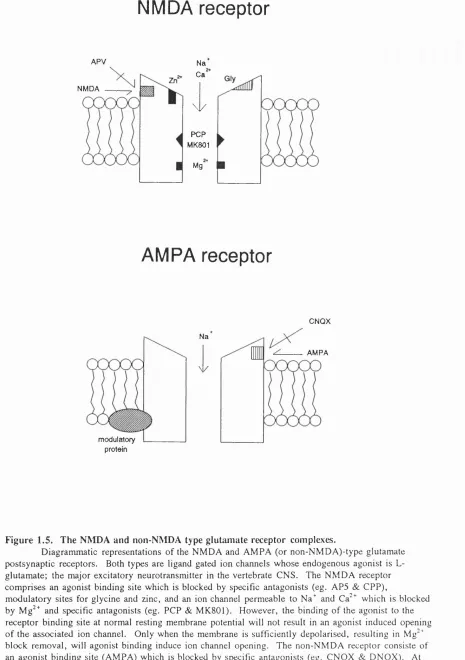
Figure 1.5. The NMDA and non-NMDA type glutamate receptor complexes.
D ia g r a m m a tic rep resen tatio n s o f the N M D A and A M P A (o r n o n - N M D A ) - t y p e g lu ta m a te p o s t s y n a p ti c re ceptors. Both ty pes are ligand gated io n c h an n els w h o s e e n d o g e n o u s a g o n is t is L- g lu ta m a te ; th e m a j o r ex citato ry n eu ro tra n s m itte r in th e vertebrate C N S . T h e N M D A re c e p to r c o m p r is e s an ago n is t b in d in g site w h ic h is blo cked by specific an ta g o n i s t s (eg. A P 5 & G P P ),
m o d u l a to r y sites for g ly c in e a nd zinc, and an ion channel p e r m e a b le to Na"” a nd C a '^ w h ic h is blo cked b y Mg^^ a nd sp ecific an tag o n ists (eg. P C P & M K 8 0 1 ). H o w e v e r , th e b in d in g o f the ag o n is t to the re c e p t o r b in d i n g site at n o rm al resting m e m b ra n e potential will not result in an a g o n is t in d u c e d o p e n in g o f th e ass o c ia te d ion ch an n el. O n ly w h en the m e m b ra n e is su fficiently d e p o la r is e d , re s u ltin g in Mg*^ b lo c k re m o v a l, will agonis t b in d in g in duce ion channel o p e n in g . T h e n o n - N M D A re c e p to r con siste o f an a g o n is t b in d in g site ( A M P A ) w h ic h is blo cked by specific an ta g o n is ts (eg. C N Q X & D N Q X ) . At n o r m a l re s tin g m e m b r a n e potentials agonist induced o p e n in g o f the ion channel will o c c u r a llo w in g Na^ to d e p o l a r is e the cell.