www.nat-hazards-earth-syst-sci.net/11/1619/2011/ doi:10.5194/nhess-11-1619-2011
© Author(s) 2011. CC Attribution 3.0 License.
and Earth
System Sciences
Heterogeneous temperature sensitivity of effective radium
concentration from various rock and soil samples
F. Girault and F. Perrier ´
Equipe de G´eomagn´etisme, Institut de Physique du Globe de Paris, UMR7154, CNRS-Universit´e Paris Diderot, Sorbonne Paris Cit´e, 1 rue Jussieu, 75238 Paris cedex 05, France
Received: 24 December 2010 – Revised: 20 April 2011 – Accepted: 6 May 2011 – Published: 6 June 2011
Abstract. Temporal variations of radon concentration, or spatial variations around geothermal systems, are partly driven by the effect of temperature on the radon source term, the effective radium concentration (ECRa). ECRa from 12 crushed rock and 12 soil samples from Nepal was measured in the laboratory using the radon accumulation method and Lucas scintillation flasks at three temperatures: 7, 22 and 37◦C. For each sample and at each temperature, 5 or 6 measurements were carried out, representing a total of 360 measurements, with an ECRa average varying from 1.1 to 75 Bq kg−1. While the effect is small, ECRa was observed to increase with temperature in a significant and sufficiently reproducible manner. The increase was approximately linear with a slope (temperature sensitivity, TS) expressed in %◦C−1. We observed a large heterogeneity of TS with average values (range min-max) of 0.79±0.05 (0.16–2.0) %◦C−1 and 0.61±0.05 (0.10–2.0) %◦C−1, for rock and soil samples, respectively. While this range overlaps with the results of previous studies, our values of TS tend to be smaller. The observed heterogeneity implies that the TS, rather poorly understood, needs to be assessed by dedicated experiments in every case where it is of consequence for the interpretation.
1 Introduction
The radioactive noble gas radon-222, characterized by a half-life of about 3.8 days, is produced by the alpha disintegration of radium-226 and belongs to the uranium-238 decay chain. Radon is an important tracer of geophysical processes (Tanner, 1964), and also an important health hazard (Darby et al., 2004). To be able to understand radon transport, however,
Correspondence to: F. Girault (girault@ipgp.fr)
its source must be sufficiently well known. In the porous media of rocks or soils, the solid radium atoms are present inside the grains and on the outer surface of the grains. All radium atoms are not able to produce a radon atom in the pore space, signifying its escape to the atmosphere, but only a fraction, E, called the emanation coefficient (Nazaroff, 1992). The radon source term ECRa,CRabeing the radium concentration, is also referred to as the effective radium concentration, expressed in Bq kg−1(Stoulos et al., 2004).
Emanation coefficientEresults from the radon mean free path across the various encountered minerals, fluids and air volumes in a porous medium (Tanner, 1964). It thus depends on the mineral assembly and grain sizes (Megumi and Mamuro, 1974; Somlai et al., 2008), radium distribution (Semkow and Parekh, 1990; Greeman and Rose, 1996), water content and water distribution (Menetrez et al., 1996; Adler and Perrier, 2009; Breitner et al., 2010). Water content is an important factor recognized long ago (Auxier et al., 1974; Strong and Levins, 1982), causing an increase of E of about a factor of 2 at low saturations, with a maximum at around 5 to 15 % volumetric saturation for rock and soil samples, and a subsequent smaller decrease at higher saturation (e.g., Markkanen and Arvela, 1992; Menetrez et al., 1996). While experimental measurements of the variation of ECRawith water content still need to be refined, its physical basis is now reasonably well understood (Barillon et al., 2005; Adler and Perrier, 2009).
Arvela, 1992) and from 1 %◦C−1to more than 4 %◦C−1for rock samples (Stranden et al., 1984). In addition, the effect of temperature remains poorly understood theoretically.
A better knowledge of the temperature sensitivity (TS) of ECRa, however, is required in a number of important applications. For example, besides frequent ventilation effects (Nazaroff et al., 1985) and other effects affecting radon flux from the soil (Ferry et al., 2002), temperature must play a role in buildings where a difference in radon concentration is observed between winter and summer periods. In volcanic or geothermal areas, ECRa of rock or soil samples may be affected by the distribution of hot geological fluids. This question, for example, arises when trying to model the spatial and temporal variations of large radon discharge associated with carbon dioxide degassing near the Syabru-Bensi hot springs in Central Nepal (Perrier et al., 2009; Girault et al., 2009; Richon et al., 2011).
In this paper, we report the results of experiments studying the TS of ECRa using 12 rock and 12 soil samples from Nepal, mostly from the Syabru-Bensi geothermal system. This data set, more generally, provides significant additional information on the understanding of the TS of the radon source.
2 Rock and soil samples
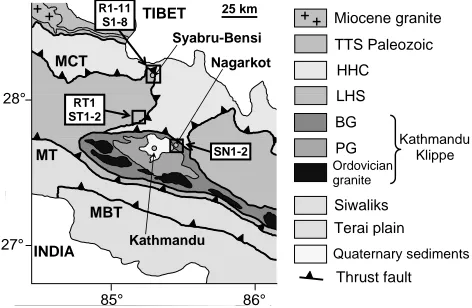
Twelve rock and 12 soil samples from Nepal were studied (Fig. 1). The rock samples belonged to the metamorphic Lesser Himalayan Sequences. Eleven samples (R1 to R11) were collected in the vicinity of the Syabru-Bensi geothermal system, Central Nepal, and were of different types: calc-schists, marble, graphitic schists, mica-schist and augen gneiss. The samples are further distinguished by the predominant encountered mineral, the presence of quartz lenses, or the state of weathering. In addition, one black slate sample (RT1, Fig. 1) was taken in the Benighat Slates Formation, northwest of Kathmandu, Central Nepal (Girault et al., 2011).
Soil samples from various contexts were used in this study (Fig. 1). Eight soil samples (S1 to S8) were taken from terraces in different gas discharge zones (GZ1, GZ2 and GZ3) of the Syabru-Bensi geothermal system. Samples S1 to S4 were characterized by a mixture of sulphur deposits and organic matter in GZ1 with more sandy soils in GZ2. In GZ3 (S5 to S8 samples), soils were characterized by a mixture between sulphur deposits, micaceous fallen debris, sand and organic matter (Girault et al., 2009). S1 to S8 soil samples were taken in various conditions of degassing: high degassing (HD, CO2 flux >1000 g m−2d−1), intermediate degassing (ID, 100 g m−2d−1< CO2 flux <1000 g m−2d−1), and low degassing (LD, CO2flux<100 g m−2d−1). Four additional soil samples were red residual soils (B-horizon and C-horizon) from the Bhattar-Trisuli Bazar Terrace (ST1 and
INDIA
TIBET
Kathmandu Syabru-Bensi
Nagarkot
Miocene granite
TTS Paleozoic
HHC
LHS
BG
PG
Ordovician granite
Kathmandu Klippe
Siwaliks Terai plain
Quaternary sediments
Thrust fault
25 km
85° 86° 28°
27°
MCT
MT
MBT
R1-11 S1-8
SN1-2 RT1
ST1-2
Figure 1
Fig. 1. Location of the sampling sites on a simplified geological map of Central Nepal, after Upreti (1999). TTS: Tethys Tibetan Sediments; HHC: High Himalayan Crystalline; LHS: Lesser Himalayan Sequences; BG: Bhimphedi Group; PG: Phulchauki Group; MCT: Main Central Thrust; MT: Mahabharat Thrust; MBT: Main Boundary Thrust.
ST2, Fig. 1), northwest of Kathmandu, and red residual soils (B-horizon) from a terrace near Nagarkot (SN1 and SN2, Fig. 1), northeast of Kathmandu (Girault et al., 2011).
3 Measurement method
The rock samples were first crushed to grains smaller than 500 µm. To prevent chemical reactions before ECRa measurements and to preserve the outcrop natural conditions, the rock and soil samples were neither heated nor dried. To measure ECRa in the laboratory, we used a standard radon emanation method by placing samples into sealed containers (Stoulos et al., 2003; Girault et al., 2011). The samples, with a mass of 100 to 150 g, were placed in glass bottles hermetically closed with pre-perforated natural rubber stoppers. Radon produced by the sample accumulated inside the container and, after an accumulation time varying from 5 to 15 days and differing from one measurement to another, the air of the pot was sampled using a Lucas scintillation flask (Lucas, 1957). Radon concentration in the air was derived 3.5 h after sampling from the counting rate obtained in three or five minutes, using a CALEN™ photomultiplier (Algade, France). The value of ECRa was derived from radon concentration by the following relationship (Stoulos et al., 2004):
ECRa=Va m
CRn
1−e−λt, (1)
whereVa is the total free air volume of the container (m3),
Figure 2
Fig. 2. ECRameasurements versus time for two samples: one rock
sample, R8 (a), and one soil sample, S8 (b). The symbols represent the temperature conditions for the measurement: in refrigerator (diamonds), in laboratory (squares) and in incubator (triangles). Error bars are at±1σ, corresponding to a confidence level of 68 %.
rate of a scintillation flask is not affected by the air temperature inside the flasks. Possible temperature effects on the photomultipliers did not affect our measurements as the counting was always performed at a constant room temperature. Statistical error due to the counting rate ranged from±20 % to±3 %, for minimum and maximum counting rates, respectively. Dilution during sampling, quantified using pressure measurements, introduced an additional experimental error varying from ±0.5 % to±5 %. When comparing with results from other workers, an absolute error of±5 % is to be added in quadrature.
To study the TS of ECRa, one given set of containers was subjected to a series of accumulation experiments at a given temperature. Three environments with almost constant temperature were considered in turn in a measurement cycle: laboratory at room temperature (22.2±0.7◦C), a refrigerator
(6.9±0.5◦C), and an incubator (36.8±0.2◦C). During the
accumulation period, the temperature was monitored using Tinytag™ sensors with a sampling interval of 30 min. This measurement cycle was repeated several times in order to first obtain typically 5 to 6 measurements for each sample and at each of the three distinct temperatures and second, to test the reproducibility of the measurements at each temperature.
Two examples of ECRa measurement cycles successions are depicted in Fig. 2, showing the series of obtained ECRa values as a function of time from September 2009 to April 2010 for one rock sample and one soil sample. The rock sam-ple (R8, Fig. 2a) shows a consistent series of measurements with ECRavalues systematically lower in the laboratory than in the incubator and higher in the laboratory than in the refrigerator. Thus, this data series clearly indicates positive TS. The ECRaweighted averages are: 5.26±0.19 Bq kg−1 in the refrigerator, 6.23±0.21 Bq kg−1in the laboratory and
7.78±0.25, Bq kg−1in the incubator. However, despite this clear pattern, one refrigerator measurement in March 2010 was higher than the other four measurements at the same temperature, illustrating the need to repeat the experiments to obtain reliable temperature effects.
The difficulty of assessing the TS is more conspicuous with the data series of the soil sample (S8) shown in Fig. 2b. Indeed, except the rather well reproducible first cycles in September and October 2009, it is not particularly evident to distinguish ECRavalues obtained in different temperature conditions from March 2010 onwards. Nevertheless, when considering the whole data set, the ECRa weighted averages are significantly different: 7.00±0.17 Bq kg−1 in the refrigerator, 7.89±0.17 Bq kg−1 in the laboratory, and 8.34±0.20 Bq kg−1in the incubator. The data series shown in Fig. 2b confirms the need to repeat experiments in the same conditions to be able to obtain reasonable estimates of the TS.
4 Results
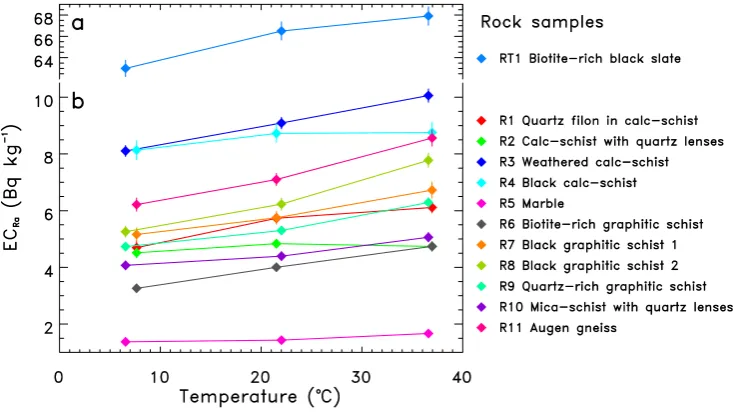
At each temperature, a weighted average of ECRa values obtained as previously described was calculated for each sample and is plotted as a function of the temperature in Fig. 3 and in Fig. 4, for the 12 rock and the 12 soil samples, respectively. The studied range of ECRa is large, from 1.12 to 74.9 Bq kg−1 for rocks (Fig. 3) and from 4.87 to 26.7 Bq kg−1for soils (Fig. 4). To first order, ECRaincreases with rising temperature and this trend is confirmed in all samples of this data set. However, we also observed a high heterogeneity of the TS in our rock and soil samples. For example, the R2 and R4 samples show a decrease for the ECRameasurements performed at 37◦C (Fig. 3). The same observation is done in Fig. 4, for the SN1 soil sample. For the R8, R9 and R11 samples (Fig. 3), and for the S1, S3, S5 and SN2 soil samples (Fig. 4), the increase, from the ECRa average at 22◦C to the ECRaaverage at 37◦C, clearly depicts a stronger evolution than the increase observed between the ECRa average at 7◦C and the ECRa average at 22◦C. It is, however, not clear whether a significant change exists in the slope of the trend between the first two and the last two temperature points. Consequently, we consider at this stage that, in the temperature range 7 to 37◦C, the trend is sufficiently well reproduced by a linear approximation (Figs. 3 and 4).
1622 Figure 3 F. Girault and F. Perrier: Heterogeneous temperature sensitivity of effective radium
Fig. 3. ECRaof the twelve rock samples as a function of temperature. The RT1 sample is depicted in (a), while the eleven other rock samples
are shown with the same vertical scale in (b).Figure 4
Fig. 4. ECRaof the twelve soil samples as a function of temperature. S1 and ST1 samples are depicted in (a), while the ten other soil samples
are shown with the same vertical scale in (b).
value of TS expressed in %◦C−1. The agreement between the data and the linear approximation can be measured by the determination coefficientR2(or misfit) defined as:
1−R2=
P
i
(yi−fi)2
P
i
(yi− ¯y)2
, (2)
wherefi are the fitted values of data valuesyi with average ¯
y. We obtained R2=0.987 and 0.984 for rock and soil samples, respectively. These values, close to 1, indicate that
the fitted values account sufficiently well for the observed variability of the data. We finally obtained a slope of 0.78±0.05 %◦C−1 and 0.55±0.04 % ◦C−1, for rock and soil samples. We note that, on average, the temperature affects the ECRaof rock samples more than the ECRaof soil samples.
Table 1. Summary of results and experimental conditions for the determination of TS. Our experiments are compared with four previous studies.
Reference Temperature Temperature Samples ECRa Number and type Method used for radon Mean TS TS range range (◦C) stages range (Bq kg−1) of samples activity measurement (%◦C−1) (%◦C−1)
Stranden et al. (1984) +5 to +50 3 5.4–580 6 rock samples 3.19±0.52 1.01–4.54 Markkanen and Arvela (1992) +1 to +100 3 9.2–48 29 soil samples Lucas flask 1.11±0.16 0.70–1.50 Iskandar et al. (2004) –20 to +45 7 36–54 3 soil samples Scintillation flask 1.11 1.06–1.11
Lee et al. (2010) 0 to +20 3 400–620 1 rock sample Liquid scintillation 1.80 counter
This study +6.6 to +37.0 3 1.1–75 12 rock samples Lucas flask 0.78±0.05a 0.16–1.99 0.79±0.05b
This study +6.6 to +37.0 3 4.9–27 12 soil samples Lucas flask 0.55±0.04a 0.10–1.96 0.61±0.05b
The two TS values are labelled in:arefers to the first method andbrefers to the second method as described in the text.
Figure 5
Fig. 5. Weighted average of all ECRa values as a function of
temperature, rock samples (black diamonds) and soil samples (grey triangles) separately, normalized by the fitted value at 20◦C, and expressed as the deviation from 1 in %. N represents the total number of measurements carried out for both rock and soil samples at each temperature stage. Their respective linear fit (solid lines) and associated equation are displayed. The linear trends obtained in three previous studies (Markkanen and Arvela, 1992; Iskandar et al., 2004; Lee et al., 2010) are also plotted for comparison (dashed lines).
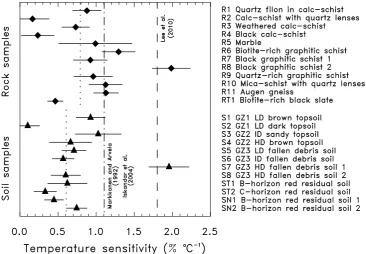
not benefit from a reduction of the fluctuations by stacking all samples at a given temperature. The data set of the obtained values of TS is shown in Fig. 6 and summarized in Table 1. Error bars are obtained from the standard deviation of 30 simulations of the linear fit, for which we have added to the initial value of each point the error bar of each point multiplied by a randomly centred Gaussian coefficient. The obtained values of TS can then be averaged, separately for rock and soil samples. These values are shown with dotted lines in Fig. 6. Values of TS range from 0.16 to 1.99 %◦C−1 and from 0.10 to 1.96 %◦C−1, with
an average of 0.79±0.05 %◦C−1and 0.61±0.05 %◦C−1, respectively, for rock and soil samples. These values do not differ significantly from our first estimates (Fig. 5), but this second method (Fig. 6) is useful for displaying the dispersion of the results. This dispersion is more important for rock samples (σ=0.49) than for soil samples (σ = 0.46).
5 Discussion
In our data set, the values of TS are heterogeneous. This heterogeneity does not appear to be clearly related to the value of ECRa or to geology or pedology (Figs. 3 and 4). The obtained values of TS remain relatively small: 0.79±0.05 %◦C−1 and 0.61±0.05 %◦C−1 for rock and soil samples, respectively, except for two of our samples: the R8 (Fig. 3) and S7 (Fig. 4) samples, for which ECRa increases to about 2 %◦C−1 (Fig. 6). Note that this implies that, in the temperature range encountered in most laboratories, i.e. from 15 to 30◦C, the values of EC
Ra increase by 10 % on average. This effect is more important for rock samples (12 %) than for soil samples (8 %).
Figure 6
Fig. 6. TS of ECRafrom the whole data set of rock samples (diamonds) and soil samples (triangles). Error bars correspond to±1σ
(confidence level of 68 %). Dotted lines represent the weighted average of the TS values, rock and soil samples separately. Values of TS derived from three previous studies (Markkanen and Arvela, 1992; Iskandar et al., 2004; Lee et al., 2010) are also plotted for comparison (dashed lines).
over a larger temperature range must provide larger values of TS.
It is not particularly easy to propose a theoretical explanation to account for the observed values of TS. As the radium concentration is not affected by temperature, the observed TS must be due to changes in the emanation coefficient E. High temperatures are known to increase the Brownian movement of gas, but the radon diffusion length in our experiments is larger than the grain and even sample size, thus our experimental values are not affected by diffusion effects in the pore space. Therefore, other effects need to be present. As some radium atoms are trapped in the grains, consequently the radon atoms can be embedded into the grain after the radioactive recoil effect, preventing their escape into the atmosphere. In such a context, even at moderate temperature values, temperature may spark off some nanometric to micrometric fractures in mineral grains which could increase the intrinsic effective specific surface area (Jobb´agy et al., 2009) and, thus, the number of effective radium atoms. The non zero value of TS in this case would suggest the presence of a non-negligible fraction of radon atoms close to a percolation threshold.
Focusing on the grain-scale parameters, the sorption coefficient of radon is known to be affected by temperature (Stranden et al., 1984; Schery and Whittlestone, 1989). Indeed, what we measured is the apparent emanation, which
includes a small contribution from radon adsorption on mineral surfaces (Meslin et al., 2011). Adsorption decreases when temperature increases, resulting in an increased apparent emanation. Moreover, the temperature effect on the radon sorption coefficient may be more precisely reproduced using an exponential trend (Schery and Whittlestone, 1989), which may be a method to isolate this contribution. However, adsorption is expected to be important only for particular minerals and only for small water content (Meslin et al., 2011) and, therefore, it is not straightforward that the temperature sensitivity of adsorption is sufficient to account for the observed values of TS. Finally, another parameter can affectE: the intercrystalline diffusion of radon in the mineral lattices (Bossus, 1984). The diffusion coefficient, indeed, is known to increase at high temperatures (Harrison et al., 2009); the difference, however, would most likely remain too small in the studied temperature range.
R8 sample (Fig. 6) is composed mainly of black micas such as biotite and phlogopite, which are characterized by a strong affinity for radium (Ames et al., 1983). This high sorption of radium could potentially be associated with an important sorption of radon onto the outer surface of mica grains. Increasing temperature thus decreases this radon sorption coefficient (Stranden et al., 1984; Schery and Whittlestone, 1989), releasing a larger amount of radon atoms from the sample. However, the sample composition of the R8 sample is similar to the R7 sample composition, and hence the radon sorption onto fine particles of the samples might be the useful parameter to distinguish the two samples and to account for the TS difference. Concerning the S7 soil sample (Fig. 6), it appears impossible at this stage to explain its TS anomaly. It can also be noticed that the rock samples primarily composed of quartz or with occurrence of quartz lenses (Fig. 6) do not have low values of TS. Nevertheless, radon sorption onto quartz grains is weak (Schery and Whittlestone, 1989). This last remark further suggests that temperature effect on radon sorption is definitely not the major effect involved in the TS of ECRa.
One interesting point lies in the small difference of TS observed in Fig. 6 between the red residual soil samples taken from B-horizon (ST1, SN1 and SN2) and C-horizon (ST2). While the difference is small (factor of 1.8±0.9) and the sample set relatively poor, B-horizon red residual soil samples are characterized by larger TS than C-horizon red residual soil samples (Fig. 6). B-horizon soils, in particular red residual soils which are extremely rich in iron-oxyhydroxides, concentrate radium atoms, evidently from secondary depositions (Greeman and Rose, 1996). B-horizon soil samples are also composed of fine particles to a larger part than C-horizon samples, which are always closer to the weathered bedrock. The TS, thus, could be preferentially related to the leachable fraction of radium.
6 Conclusions
The TS of ECRaremains a quantity difficult to measure and to understand on a theoretical basis. Our results show both a large heterogeneity as well as some level of discrepancy with previous studies that deserve future attention. In addition, while the reproducibility of our TS is satisfactory, temporal variations in some samples suggest the possibility that the TS also depends on the thermal history of the samples.
For a better understanding of the temperature effects, more measurements of ECRa from different samples are needed, in particular to confirm the fact that, sometimes, the temperature effect can be larger as observed in the present study with two samples. Our method allowed us to measure a significant number of samples with three distinct temperature stages, while other workers have studied fewer samples, but with more temperature stages. To assess the TS of ECRa more precisely, an improved method needs to be developed
in order to measure accurately and efficiently the values of ECRa with a large number of samples and at several temperature stages over a larger temperature range. With such a method, it would be possible to establish a possible increase of TS at temperatures larger than 40◦C.
In our study, whole samples were crushed before measuring. Owing to the appearance of micro-fractures by temperature, it is not unlikely that stronger temperature sensitivity on ECRa could be observed for uncrushed samples. The physical processes involved in the moderate TS of ECRaare currently poorly known, but they might reveal an important part of the physics of gas emanation at the edge of percolation. To clarify some aspects of these processes, it might be useful to revisit the TS of uranium-rich samples in order to establish clear effects over a large temperature range. To conclude, the TS of the radon source term remains poorly known; it is an essential missing piece of information to assess the effect of temperature changes on radon concentration in buildings and to model radon generation and transport to the surface in environments such as geothermal systems, volcanic areas and active faults.
Acknowledgements. The authors thank the Department of Mines
and Geology, Kathmandu, for its continuous support over the years. The authors thank Patrick Richon for technical advice and for generously sharing over the years his tremendous understanding of radon physics. This is IPGP contribution number 3166.
Edited by: R. Crockett
Reviewed by: A. Pereira and T. Przylibski
The publication of this article is financed by CNRS-INSU.
References
Adler, P. M. and Perrier, F.: Radon Emanation in Partially Saturated Porous Media, Transport Porous Med., 78(2), 149–159, 2009. Ames, L. L., McGarrah, J. E., and Walker, B. A.: Sorption of
uranium and radium by biotite, muscovite, and phlogopite, Clays and Clay Minerals, 31(5), 343–351, 1983.
Auxier, J. A., Shinpaugh, W. H., Kerr, G. D., and Christian, D. J.: Preliminary studies of the effects of sealants on radon emanation from concrete, Health Phys., 27, 390–391, 1974.
Barillon, R., ¨Ozg¨um¨us, A., and Chambaudet, A.: Direct recoil radon emanation from crystalline phases. Influence of moisture content, Geochim. Cosmochim. Ac., 69(11), 2735–2744, 2005. Bossus, D. A. W.: Emanating power and specific surface area,
Radiat. Prot. Dosim., 7(1–4), 73–76, 1984.
– A pilot study on granitic esker sand sample, J. Environ. Radioactiv., 101, 1002–1006, 2010.
Darby, S., Hill, D., Auvinen, A., Barros-Dios, J. M., Baysson, H., Bochicchio, F., Deo, H., Falk, R., Forastiere, F., Hakama, M., Heid, I., Kreienbrock, L., Kreuzer, M., Lagarde, F., M¨akel¨ainen, I., Muirhead, C., Oberaigner, W., Pershagen, G., Ruano-Ravina, A., Ruosteenoja, E., Schaffrath Rosario, A., Tirmarche, M., Tom`aˇsek, L., Whitley, E., Wichmann, H. E., and Doll, R.: Radon in homes and risk of lung cancer: collaborative analysis of individual data from 13 European case-control studies, Brit. Med. J., 330, 223–228, 2004.
Ferry, C., Richon, P., Beneito, A., and Rob´e, M.-C.: Evaluation of the effect of a cover layer on radon exhalation from uranium mill tailings: transient radon flux analysis, J. Environ. Radioactiv., 63, 49–64, 2002.
Gabrysh, A. F. and Davis, F. J.: Radon released from concrete in radiant heating, Nucleonics, 13, 50, 1955.
Girault, F., Koirala, B. P., Perrier, F., Richon, P., and Rajaure, S.: Persistence of radon-222 flux during monsoon at a geothermal zone in Nepal, J. Environ. Radioactiv., 100, 955–964, 2009. Girault, F., Gajurel, A. P., Perrier, F., Upreti, B. N., and Richon, P.:
Radon emanation of heterogeneous basin deposits in Kathmandu Valley, Nepal, J. Asian Earth Sci., 40, 595–610, 2011.
Greeman, D. J. and Rose, A. W.: Factors controlling the emanation of radon and thoron in soils of the eastern U.S.A., Chem. Geol., 129, 1–14, 1996.
Harrison, T. M., C´el´erier, J., Aikman, A. B., Hermann, J., and Heizler, M. T.: Diffusion of 40Ar in muscovite, Geochim. Cosmochim. Ac., 73, 1039–1051, 2009.
Ingersoll, J. G.: A survey of radionuclide contents and radon emanation rates in building materials used in the U.S., Health Phys., 45(2), 363–368, 1983.
Iskandar, D., Yamazawa, H., and Iida, T.: Quantification of the dependency of radon emanation power on soil temperature, Appl. Radiat. Isotopes, 60, 971–973, 2004.
Jobb´agy, V., Somlai, J., Kov´acs, J., Szeiler, G., and Kov´acs, T.: Dependence of radon emanation of red mud bauxite processing wastes on heat treatment, J. Hazard. Mater., 172, 1258–1263, 2009.
Lee, K. Y., Yoon, Y. Y., and Ko, K. S.: Determination of the emanation coefficient and the Henry’s law constant for the groundwater radon, J. Radioanal. Nucl. Ch., 286(2), 381–385, 2010.
Lucas, H. F.: Improved low-level alpha-scintillation counter for radon, The Review of Scientific Instruments, 28(9), 680–683, 1957.
Markkanen, M. and Arvela, H.: Radon emanation from soils, Radiat. Prot. Dosim., 45(1/4), 269–272, 1992.
Megumi, K. and Mamuro, T.: Emanation and exhalation of radon and thoron gases from soil particles, J. Geophys. Res., 79(23), 3357–3360, 1974.
Menetrez, Y., Mosley, R. B., Snoddy, R., and Brubaker, S. A., Jr.: Evaluation of radon emanation from soil with varying moisture content in a soil chamber, Environment International, 22(1), S447–S453, 1996.
Meslin, P. Y., Sabroux, J. C., Bassot, S., and Chassefi`ere, E.: Experimental study of radon production and transport in an analogue for the Martian regolith, Geochim. Cosmochim. Ac., 75, 2256–2270, 2011.
Nazaroff, W. W.: Radon transport from soil to air, Rev. Geophys., 30(2), 137–160, 1992.
Nazaroff, W. W., Feustel, H., Nero, A. V., Revzan, K. L., Grimsrud, D. T., Essling, M. A., and Toohey, R. E.: Radon transport into a detached one-story house with a basement, Atmos. Environ., 19(1), 31–46, 1985.
Perrier, F., Richon, P., Byrdina, S., France-Lanord, C., Rajaure, S., Koirala, B. P., Shrestha, P. L., Gautam, U. P., Tiwari, D. R., Revil, A., Bollinger, L., Contraires, S., Bureau, S., and Sapkota, S. N.: A direct evidence for high carbon dioxide and radon-222 discharge in Central Nepal, Earth Planet. Sci. Lett., 278, 198– 207, 2009.
Richon, P., Perrier, F., Koirala, B. P., Girault, F., Bhattarai, M., and Sapkota, S. N.: Temporal signatures of advective versus diffusive radon transport at a geothermal zone in Central Nepal, J. Environ. Radioactiv., 102, 88–102, 2011.
Schery, S. D. and Whittlestone, S.: Desorption of radon at the Earth’s surface, J. Geophys. Res., 94(D15), 18297–18303, 1989. Semkow, T. M. and Parekh, P. P.: The role of radium distibution and porosity in radon emanation from solids, Geophys. Res. Lett., 17(6), 837–840, 1990.
Somlai, J., Jobb´agy, V., Somlai, K., Kov´acs, J., N´emeth, C., and Kov´acs, T.: Connection between radon emanation and some structural properties of coal-slag as building material, Radiat. Meas., 43, 72–76, 2008.
Stoulos, S., Manolopoulou, M., and Papastefanou, C.: Assessment of natural radiation exposure and radon exhalation from building materials in Greece, J. Environ. Radioactiv., 69, 225–240, 2003. Stoulos, S., Manolopoulou, M., and Papastefanou, C.: Measure-ment of radon emanation factor from granular samples: effects of additives in cement, Appl. Radiat. Isotopes, 60, 49–54, 2004. Stranden, E., Kolstad, A. K., and Lind, B.: The influence of
moisture and temperature on radon exhalation, Radiat. Prot. Dosim., 7(1–4), 55–58, 1984.
Strong, K. P. and Levins, D. M.: Effect of moisture content on radon emanation from uranium ore and tailings, Health Phys., 42, 27– 32, 1982.
Tanner, A. B.: Radon migration in the ground: a review, edited by: Adams, J. A. S., and Lowder, W. M., Natural Radiat. Environ., University of Chicago Press, 161–190, 1964.