Article
1
In-situ study of road marking durability using glass
2
microbeads and antiskid aggregates as drop-on
3
materials
4
Andrés Coves-Campos 1, Luis Bañón 1, José Andrés Coves-García 1,2 and Salvador Ivorra 1,*
5
1 Department of Civil Engineering, University of Alicante, Ctra. San Vicente del Raspeig s/n, 03690 San
6
Vicente del Raspeig, Alicante, Spain; [email protected]; [email protected]; [email protected]
7
2 Servicio Territorial de Carreteras de Alicante, Conselleria de Vivienda, Obras Públicas y Vertebración del
8
Territorio, Generalitat Valenciana, Avda. Aguilera 1, 03007 Alicante, Spain
9
* Correspondence: [email protected]; Tel.: +34-965-903707
10
11
Abstract: Road markings play an important role in road safety because they provide significant
12
information to drivers about the road. For that reason, they must be replaced when they are not
13
correctly perceived by road users. To analyse which are the main factors that affect road marking
14
perception over time, a test section was designed in a two-lane rural highway, running actual traffic
15
over 18 different types of markings fabricated with different combinations of drop-on materials.
16
Chromatic coordinates, luminance and retroreflectivity of each sample were measured during 18
17
months in order to study their evolution over time. The results obtained show different behaviours
18
depending on the aggregates and application method used. An increment of the durability has been
19
observed with the use of different layers and mixtures of glass microbeads with different sizes.
20
Keywords: road markings; glass microbeads; drop-on materials; retroreflectivity; skid resistance;
21
road safety22
23
1. Introduction24
Until now, four main engineering treatments have generally been carried out in order to
25
improve road safety: (i) highway updating; (ii) road signing refurbishment; (iii) repainting of road
26
markings; and (iv) pavement resurfacing. Updating the horizontal or vertical signage is the most
27
affordable option and, in addition to this, road safety increases up to 35% [1].
28
Road markings provide continuous information to road users about roadway alignment and
29
vehicle positioning [2]. Whether lines or pictograms, both should transmit an understandable
30
message for any user. In rural highways, where the traffic average speed is high, it is especially
31
important that this kind of signs is clear and understandable [3].
32
Road marking should meet certain standards of durability, resistance and visibility [4]. The
33
service threshold is established according to drivers’ safety needs and traffic requirements, and for
34
that reason it is requested [5]:
35
• Defining road marking’s essential features for that they achieve their function, from
36
the users’ point of view.
37
• Setting the minimum acceptable value for these features, according to traffic
38
circumstances and the intended objectives.
39
To ensure a good road marking quality, it is very important to make a proper selection of the
40
materials to be used, for which we should consider economic, environmental, application and use or
41
location criteria. But amongst all them, their specific characteristics and suitability for use must be
42
principally considered; road marking must fulfil some requirements of durability, skid resistance and
43
visibility [6].
44
Daytime visibility is achieved through visual contrast between road marking and pavement
45
[3,4]. Nighttime visibility is reached by using glass microbeads embedded in the paint surface, so the
46
drivers can receive a proper amount of reflected light, providing them an adequate road visibility at
47
night and increasing their safety [7]. The correct retroreflection value is attained through the
48
combination of good quality microbeads and base material (white painting) in a correct dosage.
49
Microbeads efficiency must be assessed for their different compositions and densities in the painting
50
embedment [8]. Previous studies show that microbeads must be embedded from 1/3 to 2/3 of their
51
diameter to optimise light retroreflection [7].
52
Furthermore, road markings must ensure safety for any road user that drives on them. For this
53
reason, it is also necessary to provide them with antiskid properties (skid resistance) [9].
54
Road marking should be replaced when their colour, retroreflectivity or skid resistance
55
measurements drop below a certain value established by regulations [10]. The evolution of these
56
properties (daytime and nighttime visibility, skid resistance and durability) depends on the quality
57
of the products used, their resistance against traffic conditions, application system, connection
58
between the paint coating and the pavement, base material, traffic volume, etc. [9].
59
Another aspect that has a vital importance for the behaviour of drivers is how they perceive road
60
safety because of the road markings. On one hand, depending on the situation, this perception makes
61
the users feel more comfortable and protected, but on the other hand it is more likely that if they do
62
not feel like this, they will react impulsively increasing the risk of having an accident on road. It is a
63
delicate issue that must be studied and considered thoroughly by the responsible of every road
64
marking project [11].
65
This paper is focused on obtaining the best composition for road markings by using different
66
combinations of drop-on materials and postmix application systems: glass microbeads, transparent
67
and non-transparent antiskid aggregates, mixed in different proportions with the same base material,
68
and applied in one or two layers, in order to determine which key aspects should be considered in
69
order to improve visibility distance and skid resistance of road markings, both crucial factors for road
70
safety.
71
2. Experimental program
72
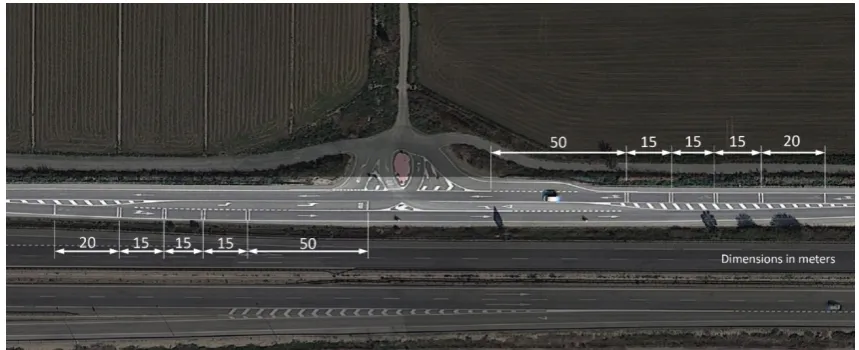
2.1. Test section
73
For this piece of research, an in-situ test section was set on the CV-904 rural two-lane highway
74
from Crevillente to Catral, located at the existing intersection on 4+400 kilometric point (KP), in the
75
municipality of Catral, province of Alicante, Spain (see Figure 1). There is virtually no traffic
76
diversion in this junction because this section is only connected with minor rural paths, so it
77
guarantees a continuous traffic flow along the testing samples (transversal stripes). In addition, speed
78
reduction of passing vehicles is negligible, preventing skid marks that could pollute the samples,
79
altering the wearing process. Furthermore, placing the test section in a crossing makes easier to create
80
a third virtual traffic lane to divert the traffic while making or measuring the samples. The tests were
81
performed under actual traffic and weather conditions, which provide more accurate results than
82
those obtained in laboratory simulations.
(a) (b)
Figure 1. Test section location: (a) in Spain; (b) at CV-904 two-lane highway (Crevillente-Almoradí).
84
In the technical datasheet of the traffic count station ID 904020, located at the CV-904 highway,
85
covering traffic flow from 1+300 KP to 7+000 KP [12], we can observe that traffic volume is balanced
86
between the two lanes, approximately 50% in direction to Catral (ascending) and 50% in direction to
87
Crevillente (descending).
88
Table 1 shows that that traffic flow is regular over time, with Annual Average Daily Traffic
89
(AADT) values around 4,000 vehicles/day, and a decreasing percentage of trucks (PT).
90
Table 1. AADT and PT (2009-2013), traffic count station ID 904020.
91
AADT2009 PT,2009 AADT2010 PT,2010 AADT2011 PT,2011 AADT2012 PT,2012 AADT2013 PT,2013
4,055 - 4,507 6.0% 4,276 4.9% 4,406 3.6% 3,734 3.4%
92
We also notice (see Table 2) that the average traffic flow rates during working days are greater
93
than on weekends, what means that it is a rural road with a predominant mobility function. Annual
94
Average Daily Truck Traffic (AADTT) remains stable throughout the year, being less intense on
95
weekends as well.
96
Table 2. Traffic flow rates in 2013, traffic count station ID 904020.
97
Month Average day Working days Saturdays Sundays AADT AADTT PT AADT AADTT PT AADT AADTT PT AADT AADTT PT
May 3,897 134 3.4% 4,144 169 4.1% 3,555 64 1.8% 3,007 29 1.0%
November 7,144 280 3.9% 7,659 356 4.6% 6,566 124 1.9% 5,146 58 1.1%
2.2. Materials and application systems
98
We have analysed different compositions of road marking materials and application systems in
99
order to study their damage over time.
100
2.2.1. Base material
101
Base material used in all testing samples is white styrene acrylic painting. Technical
102
specifications are described in Table 3.
Table 3. White styrene acrylic painting specifications.
105
Parameter Standard Value and unit
Consistency UNE 48076 86 ± 10 KU
Relative density EN ISO 2811 1.59 ± 0.02 g/cm3
Drying time UNE 135202 15 minutes
Colour EN ISO 11664-1 (x,y) inside the polygon specified by regulations
Solids content EN 12802 β = 0.89 ± 0.02 – LF7 class
Coating powder UNE 135213 72 ± 2 %
Bleed resistance EN 1871 Rc = 0.96 ± 0.01
Bleed stability EN 1871 β ≤ 0.05 – BR2 class
Stability in full
container UNE 48083
Consistency variation ≤ 5 KU. Without skins, neither clots, nor solid traces
UV ageing EN 1871 ∆β ≤ 0.05 - type UV1. (x,y) inside the polygon, without alterations
Storage stability EN 1871 8
Alkali resistance EN 1871 Non-skin effect
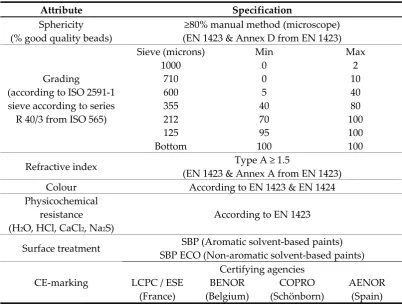
2.2.2. Glass microbeads
106
We used four different types of glass microbeads, with different grading and surface treatment:
107
(i) Echostar 5 (125 - 710 µm); (ii) Echostar 20 (1180 - 125 µm); (iii) Duolux 125 H1 (425 – 850 µm); and
108
(iv) Ultralux (600 - 850 µm). Technical information provided by their manufacturers is shown from
109
Table 4 to Table 8, according to EN 1423 [13] and EN 1424/A1 [14] European Standards.
110
Table 4. Echostar 5 glass microbeads specifications.
111
Attribute Specification Sphericity
(% good quality beads)
≥80% manual method (microscope) (EN 1423 & Annex D from EN 1423)
Grading
(according to ISO 2591-1 sieve according to series R 40/3 from ISO 565)
Sieve (microns) Min Max
1000 0 2 710 0 10 600 5 40 355 40 80 212 70 100 125 95 100 Bottom 100 100
Refractive index Type A ≥ 1.5
(EN 1423 & Annex A from EN 1423)
Colour According to EN 1423 & EN 1424
Physicochemical resistance (H2O, HCl, CaCl2, Na2S)
According to EN 1423
Surface treatment SBP (Aromatic solvent-based paints) SBP ECO (Non-aromatic solvent-based paints)
CE-marking
Certifying agencies
LCPC / ESE BENOR COPRO AENOR
(France) (Belgium) (Schönborn) (Spain)
112
Table 5. Echostar 20 glass microbeads specifications.
114
Attribute Specification Sphericity
(% good quality beads)
≥80% manual method (microscope) (EN 1423 & Annex D from EN 1423)
Grading (according to ISO
2591-1 sieve according to series R 40/3 from ISO
565)
Sieve (microns) Min Max
1400 0 2 1180 0 10 1000 5 20 850 10 30 600 20 60 355 50 90 212 70 100 125 95 100 Bottom 100 100
Refractive index Type A ≥ 1.5
(EN 1423 & Annex A from EN 1423)
Colour According to EN 1423 & EN 1424
Physicochemical resistance (H2O, HCl, CaCl2, Na2S)
According to EN 1423
Surface treatment SBP (Aromatic solvent-based paints)
CE-marking
Certifying agencies
LCPC / ESE BENOR COPRO AENOR
(France) (Belgium) (Schönborn) (Spain)
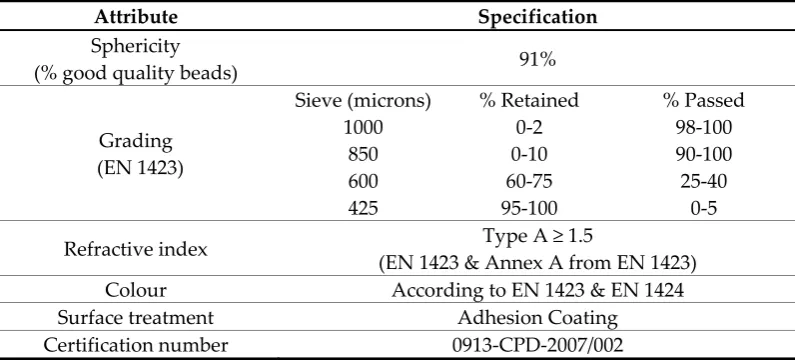
Table 6. Duolux 125 H1 glass microbeads specifications.
115
Attribute Specification Sphericity
(% good quality beads) 91%
Grading (EN 1423)
Sieve (microns) % Retained % Passed
1000 0-2 98-100 850 0-10 90-100 600 60-75 25-40 425 95-100 0-5
Refractive index Type A ≥ 1.5
(EN 1423 & Annex A from EN 1423)
Colour According to EN 1423 & EN 1424
Surface treatment Adhesion Coating
Certification number 0913-CPD-2007/002
116
Table 7. Duolux 121 H1 glass microbeads specifications.
118
Attribute Specification Sphericity
(% good quality beads) 91%
Grading (EN 1423)
Sieve (microns) % Retained % Passed
1400 0-2 98-100
1180 0-10 90-100
1000 5-15 85-95
820 10-30 70-90
600 20-50 50-80
425 40-80 20-60
250 80-100 0-20 180 90-100 0-10 125 95-100 0-5
Refractive index ≥ 1,54
Colour According to EN 1423 & EN 1424
Surface treatment Adhesion Coating
Certification number 0913-CPD-2007/002
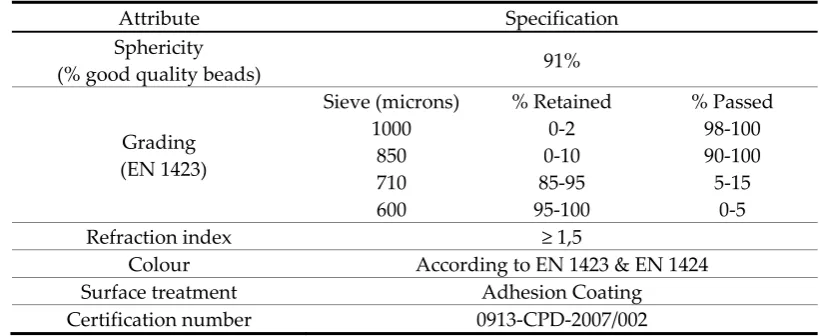
Table 8. Ultralux glass microbeads specifications.
119
Attribute Specification Sphericity
(% good quality beads) 91%
Grading (EN 1423)
Sieve (microns) % Retained % Passed
1000 0-2 98-100
850 0-10 90-100
710 85-95 5-15 600 95-100 0-5
Refraction index ≥ 1,5
Colour According to EN 1423 & EN 1424
Surface treatment Adhesion Coating
Certification number 0913-CPD-2007/002
2.2.3. Antiskid aggregates
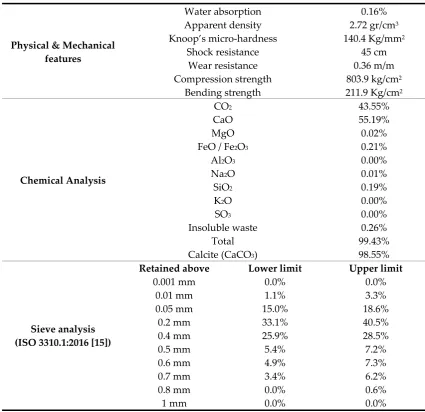
120
We have used white marble sand (Macael 400) as non-transparent antiskid aggregate and
121
sodium-calcium glass particles (Glass 600) as transparent antiskid aggregate. Macael 400 aggregate
122
properties are described in Table 9.
Table 9. Macael 400 white marble sand specifications.
125
Physical & Mechanical features
Water absorption 0.16%
Apparent density 2.72 gr/cm3
Knoop’s micro-hardness 140.4 Kg/mm2
Shock resistance 45 cm
Wear resistance 0.36 m/m
Compression strength 803.9 kg/cm2
Bending strength 211.9 Kg/cm2
Chemical Analysis
CO2 43.55% CaO 55.19% MgO 0.02%
FeO / Fe2O3 0.21%
Al2O3 0.00% Na2O 0.01%
SiO2 0.19%
K2O 0.00%
SO3 0.00%
Insoluble waste 0.26%
Total 99.43%
Calcite (CaCO3) 98.55%
Sieve analysis (ISO 3310.1:2016 [15])
Retained above Lower limit Upper limit
0.001 mm 0.0% 0.0%
0.01 mm 1.1% 3.3%
0.05 mm 15.0% 18.6%
0.2 mm 33.1% 40.5%
0.4 mm 25.9% 28.5%
0.5 mm 5.4% 7.2%
0.6 mm 4.9% 7.3%
0.7 mm 3.4% 6.2%
0.8 mm 0.0% 0.6%
1 mm 0.0% 0.0%
126
Transparent antiskid Glass 600 calcium and sodium granules have irregular shapes and sharp
127
edges to be mixed with glass microbeads, in order to generate roughness. Technical specifications are
128
shown in Table 10.
Table 10. Glass 600 granules specifications.
131
Physical & Mechanical features
Colour Transparent
Hardness 6/7 Mohs
Apparent density 2.60 g/cm3
Impurities:
Non-magnetic metals: ˂ 5 g/Tn Magnetic metals: 0 g/Tn (However it is acceptable one particle smaller than 0.05 g in
each delivery) Infusible: ˂ 25 g/Tn
Chemical analysis
SiO2 70.00-74.00%
Na2O 12.00-1400%
CaO 7.00-11.00% MgO 3.00-5.00% Al2O3 0.50-2.00%
FeO/Fe2O3 ˂0.3%
K2O 0.20-1.00%
Sieve analysis (ISO 3310.1:2016)
Sieve size (mm) Quantity (%)
< 0.3 10.0 Max
> 0.6 5.0 Max
2.2.4. Application systems
132
Two different types of application systems were used in this study:
133
(1) “Monolayer” or single layer system (AS1): it is the traditional system of application. First, the
134
base material is sprayed and immediately after, mixture of drop-on material is projected (it can
135
be just glass microbeads or a mixture of microbeads with transparent or non-transparent
136
antiskid aggregates).
137
(2) “Bilayer” or double layer system (AS2): the first step is to create a complete AS1 layer, as
138
explained before; once it is dry, another identical layer is applied over the previous one.
139
2.3. Test section design and sample fabrication
140
Following the indications of the Spanish regulations on road surface marking design, included
141
in the Ministerial Order FOM/3053/2008 [16], we sketched the placement of the testing samples on
142
the pavement with chalk and adhesive tape. As shown in Figure 2, stripes were painted in pairs
143
(except the first one, that is just one stripe), spaced 15 m between groups, except for the single stripe,
144
that is 20 m apart. The last stripe is 50 m away from the intersection, considered as a conflict point.
145
146
Figure 2. Test section general layout.
There are 9 stripes per traffic direction. In addition, every stripe is divided into 2 testing samples
148
covering half of the lane, so that both are treaded by a tyre at the same time, totalizing 18 testing
149
samples with different combinations of road marking materials (see Table 11). The scheme was
150
repeated in the opposite direction, obtaining a total of 36 testing samples, labelled as shown in Figure
151
3. As AADT is similar in both directions, it is possible to compare and contrast the results obtained
152
from each testing sample.
153
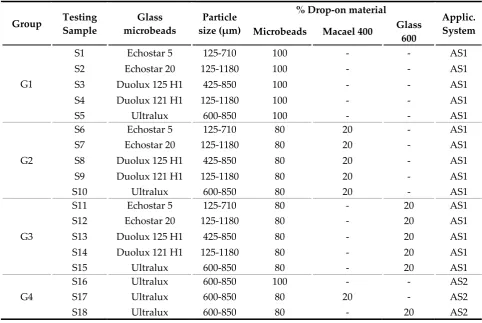
Table 11. Test samples composition and application system.
154
Group Testing Sample
Glass microbeads
Particle size (µm)
% Drop-on material
Applic. System Microbeads Macael 400 Glass
600
G1
S1 Echostar 5 125-710 100 - - AS1
S2 Echostar 20 125-1180 100 - - AS1
S3 Duolux 125 H1 425-850 100 - - AS1
S4 Duolux 121 H1 125-1180 100 - - AS1
S5 Ultralux 600-850 100 - - AS1
G2
S6 Echostar 5 125-710 80 20 - AS1
S7 Echostar 20 125-1180 80 20 - AS1
S8 Duolux 125 H1 425-850 80 20 - AS1
S9 Duolux 121 H1 125-1180 80 20 - AS1
S10 Ultralux 600-850 80 20 - AS1
G3
S11 Echostar 5 125-710 80 - 20 AS1
S12 Echostar 20 125-1180 80 - 20 AS1
S13 Duolux 125 H1 425-850 80 - 20 AS1
S14 Duolux 121 H1 125-1180 80 - 20 AS1
S15 Ultralux 600-850 80 - 20 AS1
G4
S16 Ultralux 600-850 100 - - AS2
S17 Ultralux 600-850 80 20 - AS2
S18 Ultralux 600-850 80 - 20 AS2
157
Figure 3. Testing samples labelling: (a) Crevillente direction; (b) Catral direction.
158
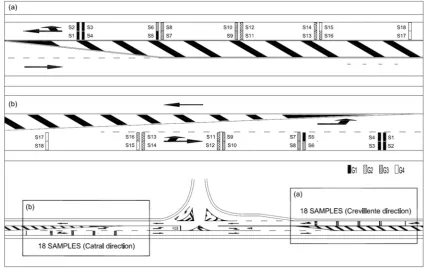
While fabricating each of in-situ testing samples, we obtained specimens in a 15x30 cm metal
159
plate placed on the pavement while painting to examine them under a laboratory microscope. Figure
160
4 shows the sample fabrication process.
162
Figure 4. Sample fabrication process: (a) traffic diversion; (b) sample sketching with chalk and
163
adhesive tape; (c) spraying of base material; (d) application of drop-on material; (e) in-situ test sample
164
finished; (f) laboratory specimen fabrication; (g) transversal stripe completed; (h) finished test section,
165
ready to be opened to traffic.
166
2.4. Tests performed
167
We have tested the fundamental parameters of the in-situ testing samples: (i) luminance factor
168
β and colour (chromatic coordinates X,Y) for daytime visibility, using a Spectro-Guide 45/0 gloss
169
spectrophotometer; (ii) retroreflective luminance coefficient (retroreflectivity) in dry (RL) and wet
170
conditions (RW) for nighttime visibility, using a ZRM 6013 retroreflectometer; and (iii) skid resistance
171
coefficient (SRT) using the TRRL pendulum. All the tests were performed inside the wheel path area.
172
a b
c d
e f
As standards require, each factor was measured a minimum of three times in every testing sample
173
per driving direction, and subsequently the average value is calculated. Therefore, for each kind of
174
mixture tested (S1 to S18), at least six values for each parameter and period of time assessed were
175
determined.
176
For the durability study, we have measured those parameters at different times: just produced,
177
after 1 month, 6 months, 12 months and 18 months, for a quantitative and qualitative analysis
178
supported by data charts, pictures of in-situ testing samples and laboratory specimens using a Leica
179
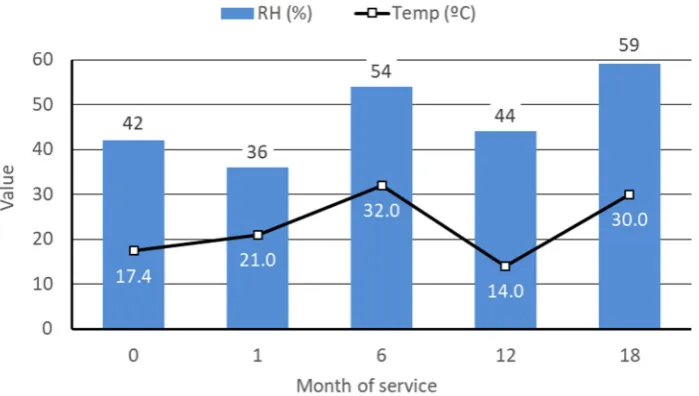
EZ4D microscope. The weather conditions during data collection are shown in Figure 5.
180
181
Figure 5. Surface temperature and relative humidity (RH) measured in the test section during data
182
collection.
183
3. Results and discussion
184
3.1. Daytime visibility
185
Figure 6 shows the average results of the chromatic coordinates (X,Y) measured on the 18 in-situ
186
testing samples over time. The results obtained are all inside the colour polygon defined by its
187
vertices for the white permanent colour, hence this parameter is not a limiting condition according
188
to the aspects studied in this paper.
190
Figure 6. Chromatic coordinates (X,Y) of the 18 testing samples during the 18-month testing period.
191
The luminance factor evolution over time is shown in the Figure 7. An analysis of the collected
192
data shows that between the sample groups with AS1 application system (monolayer), the best
193
performance is obtained by the group G1 samples, that only use glass microbeads as drop-on
194
material, followed by group G3, which samples contain glass microbeads (80%) and glass 600 (20%)
195
and the last one is G2, that has a mixture of glass beads and non-transparent antiskid aggregates as
196
drop-on materials. We should underline that group G4 (bilayer) results follow a similar trend, but
197
getting better outcomes than the equivalent AS1 group with the same kind of drop-on aggregates.
198
0.30 0.31 0.32 0.33 0.34 0.35 0.36 0.37 0.38
0.28 0.29 0.30 0.31 0.32 0.33 0.34 0.35 0.36
Y
X
Acceptance Criteria: Inside the Polygon
199
Figure 7. Evolution of the average luminance factor β in the 18 testing samples.
200
From the qualitative analysis of the in-situ pictures taken from every testing sample over time,
201
we notice that larger glass microbeads become detached first, leaving craters which are filled by dust,
202
dirt and rubber from tyres, making the road markings darker and losing its luminance factor, as
203
observed in Figure 8a. However, we realize that glass microbeads with an adhesive coating (as in
204
sample S4) are detached with more difficulty, even if they are in bigger sizes. Therefore, a lesser
205
number of craters are created, and the luminance stays better over time, as seen in Figure 8b.
206
207
Figure 8. In-situ surface detail after 1 month of service: (a) S2 sample; (b) S4 sample.
208
Regarding G2 and G3, apart from the craters caused by the detached microbeads, the antiskid
209
aggregates retain dust and rubber particles, which also contributes to reduce luminance (Figure 9).
210
0.25 0.30 0.35 0.40 0.45 0.50 0.55 0.60 0.65 0.70 0.75
S1 S2 S3 S4 S5 S6 S7 S8 S9 S10 S11 S12 S13 S14 S15 S16 S17 S18
Luminance (β)
Sample
0 Months 1 Month
6 Months 12 Months
18 Months Acceptance criteria > 0.30
G1 G2 G3 G4
211
Figure 9. In-situ surface detail after 12 months of service: (a) S8 sample; (b) S13 sample.
212
From the global analysis of the luminance factor in all the 18 testing samples, we notice that they
213
fulfil the minimum acceptance standard of β = 0.30 established by the Spanish regulations [17, 18],
214
being some testing samples slightly under this value in at 18 months age, as in S12 and S17, but could
215
be still acceptable. That is why we consider the luminance factor β is not the main limiting factor for
216
durability.
217
3.2. Nighttime visibility
218
Figure 10 shows the evolution of the retroreflectivity in dry conditions, RL. Samples from groups
219
G2 and G3 reached lower RL values than those from G1, which only has glass microbeads as drop-on
220
material.
221
222
Figure 10. Evolution of RL on test samples during the first 18 months of service.
223
From the qualitative analysis of the pictures taken in laboratory, we realized that in G2 the
non-224
transparent antiskid particles were taking up spaces that could be covered with glass microbeads.
225
Consequently, these opaque particles do not let the light go through them. Moreover, they cast
226
shadows to the glass microbeads placed just behind them (Figure 11). That is the reason why this
227
sample group has a considerable loss of retroreflectivity compared to G1.
228
0 100 200 300 400 500 600 700
S1 S2 S3 S4 S5 S6 S7 S8 S9 S10 S11 S12 S13 S14 S15 S16 S17 S18
RL
(mcd/m
2/lx)
Sample
0 Months 1 Month
6 Months 12 Months
18 Months 0-30 days ≥ 300 (mcd/m2/lx)
30-180 days ≥ 200 (mcd/m2/lx) 180-365 days ≥ 150 (mcd/m2/lx)
365-730 days ≥ 100 (mcd/m2/lx)
G1 G2 G3 G4
229
Figure 11. Microscope detail of S9 sample: (a) x16 magnifications; (b) x35 magnifications.
230
Something similar happens with G3 samples. As they have mixed glass beads plus transparent
231
antiskid aggregates, the last ones let part of the light go through them and be retroreflected (Figure
232
12). That is why G3 samples obtain better results than in G2 but not as good as in G1.
233
234
Figure 12. Microscope detail of S15 sample: (a) x16 magnifications; (b) x35 magnifications.
235
Following the acceptance criteria [17, 18], we find that from the eighteenth month, some G2
236
testing samples have a RL value below Spanish standard requirements (100 mcd/m2/lx). For G3,
237
testing samples S13 and S14 are those whose perform best along the different tests, achieving the best
238
results during service life.
239
From both qualitative and quantitative analysis, we can conclude that initial retroreflectivity
240
results improve when microbeads used have a greater size. On the other hand, the smaller the glass
241
beads are, the more they embed in the base material, getting less retroreflectivity at first. However,
242
as they detach with more difficulty, retroreflectivity is preserved better along time, extending road
243
marking service life. The samples fabricated with medium-sized glass microbeads (425-850 µm)
244
obtained good results initially and over time. Another important aspect to consider is that glass
245
microbeads with an adhesive coating are detached from the paint with more difficulty, extending
246
road marking performance.
247
In the G4 testing samples group, a retroreflection increase is observed after twelve months of
248
service. This behaviour could be explained because the upper paint layer is progressively worn out
249
by traffic, revealing the microbeads embedded in the lower layer (Figure 13), improving
250
retroreflectivity. This process starts from the sixth month of service and extends the service life of
251
bilayer road markings, reducing retroreflectivity decay over time.
252
a b
253
Figure 13. S18 sample in-situ detail after 12 months of service. Emergence of glass microbeads from
254
the bottom layer is observed.
255
Figure 14 shows retroreflectivity evolution over time in wet conditions. From this figure, it can
256
be confirmed that from six months old, none of the G1, G2 and G3 testing samples reach the minimum
257
value required by Spanish regulations [17, 18]. We also notice that samples with bigger microbeads
258
get better RW results than those with smaller ones, because they protrude over the water surface.
259
Furthermore, as bigger microbeads are detached easier, RW drops quickly over time, as seen on Figure
260
14.
261
262
Figure 14. Evolution of RW on test samples during the first 18 months of service.
263
As happened with RL values, RW increase from the sixth to the twelfth month is observed in G4
264
samples, due to the same reason explained before. This effect makes that these 3 samples achieve the
265
minimum RW values established by the Spanish regulations [17, 18].
266
3.3. Skid resistance
267
Figure 15 shows skid resistance results of the 18 testing samples over time. Results were the
268
opposite of those obtained for β, RL and RW. So, the best group for SRT value is G2, followed by G3
269
0 15 30 45 60 75 90 105 120 135 150
S1 S2 S3 S4 S5 S6 S7 S8 S9 S10 S11 S12 S13 S14 S15 S16 S17 S18
RW
(mcd/m
2/lx)
Sample
0 Months 1 Month
6 Months 12 Months
18 Months 0-30 days ≥ 50 (mcd/m2/lx)
30-180 days ≥ 35 (mcd/m2/lx) 180-730 days ≥ 25 (mcd/m2/lx)
and finally G1. Therefore, non-transparent aggregates have better roughness results than transparent
270
ones.
271
272
Figure 15. SRT evolution on test samples during the first 18 months of service.
273
For G4, testing samples follow same the trend that those testing samples that have the same
274
drop-on materials but are applied using AS1 system. Sample S17 shows the best results in this group,
275
followed by S18 and S16.
276
4. Conclusions
277
All sample groups reach the luminance factor acceptance requirements over time. Thus,
278
luminance is not the most determining factor in order to choose the optimum combination of
279
materials for road marking selection amongst all the samples studied. The craters left on the base
280
material by the detached drop-on aggregates are filled with dust and rubber particles, darkening the
281
road markings and making them lose luminance and therefore daytime visibility over time.
282
Regarding the chromatic coordinates, all the testing samples analysed are inside the polygon
283
that defines permanent white colour during the 18-month testing period. As happens as the
284
luminance factor, colour is not determinant to find the optimum drop-on mixture.
285
Retroreflectivity of road marking samples made of just microglass beads as drop-on material is
286
greater than those which have a mixture of microbeads and transparent antiskid aggregates, and
287
these ones obtain better results than those made with opaque antiskid aggregates.
288
Macael 400 particles take the space that could have be covered by glass microbeads and blocking
289
the incident light, what reduces RL values in G2 samples. Glass 600 particles also fill that space,
290
reducing RL value; however, as they are transparent, they let that part of the light goes through them,
291
obtaining slightly better RL values in the G3 sample group.
292
As the size and quality (less impurities and defective beads) of microbeads increase, better initial
293
RL values are obtained. On the other hand, largest microbeads are detached from the painting easier
294
and faster than the smaller ones, because the first ones are poorly embedded in the base material,
295
losing retroreflection capacity over time. Moreover, microcraters left by missing beads are posteriorly
296
filled by dirt, dust and rubber from tyres, causing also extra luminance loss. Microbeads’ surface
297
coating gives them extra adhesion to remain embedded in the base material, getting really good
298
results, even in the largest diameters. Best RW values are obtained with the largest microbead sizes,
299
because their upper part remains above the water and continues providing some retroreflection
300
capacity.
301
40 45 50 55 60 65
S1 S2 S3 S4 S5 S6 S7 S8 S9 S10 S11 S12 S13 S14 S15 S16 S17 S18
SRT
Sample
0 Months 1 Month 6 Months
12 Months 18 Months Acceptance criteria > 45
Bilayer road markings (G4 samples) results follow the trend of their equivalent monolayer
302
sample. It should be pointed out that what we achieve with this application system is to decrease the
303
wearing of road markings from the first month and to keep constant retroreflectivity values from the
304
sixth month to the end of the testing period, even recovering this feature from the sixth to the twelfth
305
month of service because of the emergence of the bottom layer after the wearing of the upper layer.
306
The relation between skid resistance is opposite to daytime and nighttime visibility: road
307
markings having better SRT results (G2 sample group) obtain lower values of luminance and
308
retroreflectivity. That is because rougher mixtures capture a greater amount of dirt and rubber
309
particles, darkening the markings surface.
310
Author Contributions: conceptualization, A.C-C. J.A.C-G. and S.I.; methodology, A.C-C and S.I.; validation, L.B
311
and S.I.; formal analysis, A.C-C. and L.B.; investigation, A.C-C. and J.A.C-G.; resources, J.A.C-G.; writing—
312
original draft preparation, A.C-C. and L.B.; writing—review and editing, L.B. and S.I.; visualization, L.B.;
313
supervision, S.I. and L.B.; project administration, S.I.
314
Funding: This research received no external funding.
315
Acknowledgments: The authors gratefully acknowledge the Conselleria de Vivienda, Obras Públicas y
316
Vertebración del Territorio from the Valencian Government for their collaboration to develop this study. They
317
also want to acknowledge the Ministerio de Economía y Competitividad from the Spanish Government for
318
funding the PhD grant for Mr. Andrés Coves-Campos.
319
Conflicts of Interest: The authors declare no conflict of interest.
320
References
321
1. Pérez, I. Safety impact of engineering treatments on undivided rural roads. Accid. Anal. Prev. 2006,
322
38(1), 192-200, https://doi.org/10.1016/j.aap.2005.09.008
323
2. Carlson, P.; Park, E.; Andersen, C. Benefits of pavement markings: A renewed perspective based on
324
recent and ongoing research. Transp. Res. Rec. 2009, 2107, 59-69, https://doi.org/10.3141/2107-06
325
3. Mammeri, A.; Boukerche, A.; Tang, Z. A real-time lane marking localization, tracking and
326
communication system. Comput. Commun. 2015, 73, 132-143,
327
https://doi.org/10.1016/j.comcom.2015.08.010
328
4. Mirabedini, S.M.; Jamali, S.S.; Haghayegh, M.; Sharifi, M.; Mirabedini, A.S.; Hashemi-Nasab, R.
329
Application of mixture experimental design to optimize formulation and performance of
330
thermoplastic road markings. Prog. Org. Coat. 2012, 75(4), 549-559,
331
https://doi.org/10.1016/j.porgcoat.2012.05.012
332
5. Masliah, M.; Bahar, G.; Hauer, E. Application of innovative time series methodology to
333
relationship between retroreflectivity of pavement markings and crashes. Transp. Res. Rec. 2007, 2019,
334
119-126, https://doi.org/10.3141/2019-15
335
6. Cao, Y. A design of experimental approach to study the road marking luminance contrast and variable
336
message signs. Doctoral dissertation. University of Rhode Island, Kingston, RI, 2004
337
7. Hummer, J.; Rasdorf, V.; Zhang, G. Linear Mixed-Effects Models for Paint Pavement-Marking
338
Retroreflectivity Data. J. Transp. Eng. 2011, 137(10), 705-716,
https://doi.org/10.1061/(ASCE)TE.1943-339
5436.0000283
340
8. Grosges, T. Retro-reflection of glass beads for traffic road stripe paints. Opt. Mater. 2008, 30(10),
1549-341
1554, https://doi.org/10.1016/j.optmat.2007.09.010
342
9. Pasetto, M.; Barbati, S.D. Experimental investigation on road marking distress evolution: beyond
343
testing, quality assurance and maintenance improvement. Adv. Mat. Res. 2013, 723, 846-853,
344
https://doi.org/10.4028/www.scientific.net/AMR.723.846
345
10. Ozelim, L.; Turochy, R.E. Modeling retroreflectivity performance of thermoplastic pavement markings
346
in Alabama. J. Transp. Eng. 2011, 140(6), 1-6, https://doi.org/10.1061/(ASCE)TE.1943-5436.0000661
347
11. Havard, C.; Willis, A. Effects of installing a marked crosswalk on road crossing behaviour and
348
perceptions of the environment. Transp. Res. Part F Traffic Psychol. Behav. 2012, 15 (3), 249-260,
349
https://doi.org/10.1016/j.trf.2011.12.007
12. Generalitat Valenciana. Memòria anual d’aforaments [Traffic counts annual report]. Available online:
351
http://www.habitatge.gva.es/web/carreteras/aforos-car/informes-anuales-car (accessed on 8 March
352
2018).
353
13. CEN. EN 1423 — Road marking materials — Drop on materials — Glass beads, antiskid aggregates
354
and mixtures of the two, 2012
355
14. CEN. EN 1424/A1 — Road marking materials — Premix glass beads, 2003
356
15. International Organization for Standardization. ISO 3310.1:2016 — Test sieves — Technical
357
requirements and testing — Part 1: Test sieves of metal wire cloth, 2016
358
16. Ministerio de Fomento. Instrucción Técnica para la instalación de reductores de velocidad y bandas
359
transversales de alerta en carreteras de la Red de Carreteras del Estado. Orden FOM/3053/2008 [Technical
360
Instruction for the installation of speed bumps and rumble strips in state highways. Ministerial Order
361
FOM/3053/2008], 1st ed.; Centro de Publicaciones de la Secretaría General Técnica del Ministerio de
362
Fomento: Madrid, Spain, 2008, 978-8449808746.
363
17. Ministerio de Fomento. Guía para el proyecto y ejecución de obras de señalización horizontal [Guidelines for
364
design and implementation of road marking works], 1st ed.; Centro de Publicaciones de la Secretaría
365
General Técnica del Ministerio de Fomento: Madrid, Spain, 2008, 978-8449809262
366
18. Ministerio de Fomento. Pliego de Prescripciones Técnicas Generales para Obras de Carreteras y Puentes
(PG-367
3). Orden FOM/2523/2014 [General Technical Specifications for highway and bridge works. Ministerial Order
368
FOM/2523/2014]. 1st ed.; Centro de Publicaciones de la Secretaría General Técnica del Ministerio de
369
Fomento: Madrid, Spain, 2008