Nutrients2019, 11, x; doi: FOR PEER REVIEW www.mdpi.com/journal/nutrients Article
1
Effects of Stevia extract on postprandial glucose
2
response, satiety and Energy intake: A three-arm
3
crossover trial.
4
Grace Farhat1*, Victoria Berset2 and Lauren Moore1
5
1School of Health sciences, Liverpool Hope University, Taggart Avenue, Liverpool, UK L16 9JD
6
2School of Agricultural, Forest and Food Sciences, Bern University of Applied Sciences, Bern, Switzerland.
7
*Correspondence: [email protected];
8
Received: date; Accepted: date; Published: date
9
Abstract: Non-nutritive sweeteners (NNS) are suggested to lower Energy intake in the diet, but they
10
have been paradoxically involved in the epidemic of obesity and Type 2 diabetes. Stevia is the least
11
studied sweetener. This study aims to investigate the effect of stevia on postprandial glucose levels,
12
appetite and food intake. Methods: Thirty participants (20 females/10 males; 26.1 (10.56) years; BMI
13
23.44 (3.42) Kg/m2) took part in a three-arm crossover trial where they received preloads of water,
14
sugar (60g) and stevia (1g) on 3 different days, followed by an ad-libitum pizza lunch. Breakfast was
15
standardized. A one-day diet diary was collected on each test day. Visual analogue scales (VAS)
16
were used to assess subjective feelings of appetite. Blood glucose samples were collected at
30-17
minute intervals until 120-min post lunch. Results: Energy intake did not significantly differ
18
between preloads for ad libitum meal (p=0.78) and overall day (p=0.33). VAS scores for hunger and
19
desire to eat (DTE) were lower following stevia preload compared to water (p<0.05). After adjusting
20
for the sugar preload Calorie content, postprandial glucose levels did not significantly differ
21
between interventions. Conclusion: Stevia lowers appetite sensation and does not further increase
22
food intake and postprandial glucose levels. It could be a useful strategy in obesity and diabetes
23
prevention and management.
24
Keywords: Non-nutritive sweeteners; stevia; glucose; appetite; food intake; diabetes; obesity
25
26
1. Introduction
27
Non-nutritive sweeteners are sugar substitutes, which popularity have increased over the past
28
two decades. The interest in NNS resides in their strong sweetening effect, without further addition
29
of sugar or Energy to the diet. NNS include aspartame, saccharin, sucralose, stevia, cyclamate and
30
acesulfame K [1].
31
NNS have been increasingly consumed to lower Energy intake [2] and therefore tackle the
32
obesity and Type 2 diabetes epidemic; the latter currently accounts for 451 million cases worldwide.
33
The continuous increase in the prevalence of Type 2 diabetes [3], along with its micro and
34
macrovascular complications [4], constitutes a major burden on the health system. Postprandial
35
glycaemia is an important predictor of diabetes risk and is suggested to precede the onset of fasting
36
hyperglycaemia [5]. It is also strongly associated with diabetes complications including
37
cardiovascular diseases [6]. Therefore, approaches to lower postprandial glycaemia could have
38
significant effects on diabetes prevention and management.
39
Despite their lack in Energy, NNS have been paradoxically involved in weight again and Type
40
2 diabetes risk [7], through several mechanisms including i) increase in appetite and Energy intake ii)
41
intake of NNS iv) change in taste preferences and v) alterations in gut microbiota [8]. Most of these
43
effects have been identified in either animal or observational human studies [2]. Even though the
44
interest in research on sweeteners has increased, there does not seem to be a current recommendation
45
for NNS in relation to weight control and glucose management [9], which have left the public
46
indecisive on whether the consumption of NNS is detrimental or beneficial to health.This is mainly
47
due to the mixed results, the heterogeneity of the studies, the difference in study design and quality
48
and the resultant complexity in drawing appropriate conclusions. The difficulty also relies in the
49
significant difference in the chemical structure between NNS. Although they all have the ability to
50
activate some taste receptors [10], NNS possess a different metabolic profile and can potentially exert
51
varied effects on gut microbiota [7]. This affects the reliability of extrapolating the outcomes of one
52
non-nutritive sweetener to another.
53
Stevia extract is a natural sweetener commonly referred to as stevia, and is obtained from the
54
leaves of the Stevia plant. It is native to South America and has been used as a sweetener by the
55
indigenous people hundred years ago [11]. Research on stevia has been limited and controversial;
56
while some studies showed a beneficial effect of stevia on improving glucose tolerance [12] and
57
lowering postprandial glucose levels [13], others reported a larger increase in postprandial glucose
58
levels after stevia consumption compared to sugar [14]. Furthermore, stevia did not significantly
59
affect self-reported satiety levels and food intake in one study [13], whereas an increase in appetite
60
and food consumption has been reported by Tey et al. (2016) [14]. Most studies were, nevertheless,
61
limited by a lack of control group, as they compared stevia to sugar. The aim of this study was
62
therefore to investigate whether stevia leads to an increase in glucose levels, appetite and/or food
63
intake when compared to water and sugar.
64
2. Materials and Methods
65
2.1. Participants
66
Participants were recruited through University email and word of mouth. Inclusion criteria
67
included males and females; 18-65 years; BMI: 18.5-29.9 Kg/m2 . Exclusion criteria included history of
68
diabetes or other chronic disease; allergies to stevia or the test meal and a diagnosed eating disorder.
69
All subjects gave their informed consent for inclusion before they participated in the study. The study
70
was conducted in accordance with the Declaration of Helsinki (2013), and the protocol was approved
71
by the Ethics Committee of Liverpool Hope University.
72
2.2.Intervention
73
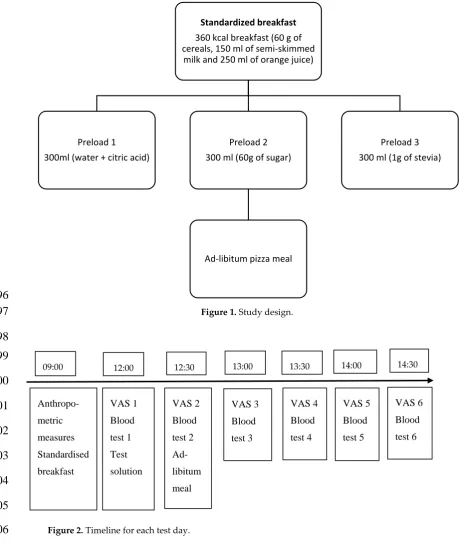
The study was a three-arm single-blinded randomised crossover trial where participants
74
received one of the three different preloads (300 ml) containing a) water mixed with small amounts
75
of citric acid, b) sugar (60g) and c) stevia (1g) on 3 different days, and separated by 4-5 days washout
76
period. The quantity of sugar was selected to match the amounts commonly used in commercial
77
sugary beverages. As for stevia, 1 g of this sweetener has been linked to a decrease in fasting blood
78
glucose levels in the study of Ritu (2016) [15]; we therefore aimed to study how this dose affects
79
postprandial glucose levels. The order of preloads was balanced in participants. On each test day,
80
they were asked to attend the Lab at 9 am after an 8-hour fast. Anthropometric measures were taken
81
and a general questionnaire was filled only during the first visit. Participants then received a 360-kcal
82
breakfast consisting of 60 g of cereals, 150 ml of semi-skimmed milk or unsweetened soya milk, and
83
250 ml of orange juice. Three hours later, they received one of the three different preloads followed
84
by an ad-libitum pizza lunch after 30 minutes (Figure 1). Pizzas and leftovers were weighed before
85
and after consumption, and Energy intake for each meal was calculated. A one-day diet diary was
86
collected three times, on each study day. Timeline for each intervention day is summarised in Figure
87
2.
88
Volunteers were asked to rate their hunger, desire to eat (DTE), fullness and satisfaction on
100-89
and negative rating over a 180-minute period before and after lunch, and every 30 mins throughout
91
the afternoon until 120 minutes post lunch.
92
Blood glucose samples were collected before preload and lunch, and then at 30-minute intervals
93
until 120 min after lunch. Area under the curve (AUC) for glucose was calculated. Blood samples
94
were obtained by finger prick tests (Biosen C-Line) (Figure 2).
95
96
Figure 1. Study design.
97
98
99
100
101
102
103
104
105
Figure 2. Timeline for each test day.
106
VAS: Visual analogue scale.
107
2.3. Anthropometric measures
108
Height was measured with person bare foot using a stadiometer, with minimal clothes on so that
109
the posture is clear, and to stand in a straight position, the head being in the Frankfurt plane, and the
110
palms facing the thighs.
111
Standardized breakfast
360 kcal breakfast (60 g of cereals, 150 ml of semi-skimmed
milk and 250 ml of orange juice)
Preload 1 300ml (water + citric acid)
Preload 2 300 ml (60g of sugar)
Ad-libitum pizza meal
Preload 3 300 ml (1g of stevia)
09:00 12:30 14:00
VAS 1
Blood
test 1
Test
solution
Anthropo-metric
measures
Standardised breakfast
VAS 3
Blood
test 3 VAS 2
Blood
test 2
Ad-libitum
meal
VAS 6
Blood
test 6 VAS 5
Blood
test 5 VAS 4
Blood
test 4
Weight was measured in the morning at fasting using an electronic scale (Tanita BF-533, Body
112
Fat Monitor/Scale) positioned on a flat surface, with light clothing.
113
Waist circumference was measured via a metal measuring tape, and was placed around the
114
waist at the middle point between the lowest rib and the top of the hip bone, based on the protocol
115
described by WHO (2008) [16].
116
2.4. Sample size and Statistical analysis
117
The determination of sample size was based on its ability to have 90% power to detect a clinically
118
significant difference of 30% in AUC for glucose between interventions, with an alpha error of 0.05.
119
Considering 20% attrition, 30 participants were recruited.
120
Continuous normally distributed data were expressed as mean ± SD. VAS, AUC for glucose,
121
food, Energy and macronutrient intakes were analysed using one-way repeated measures ANOVA
122
(Analysis of variance). Values for VAS and postprandial glucose levels were adjusted form baseline.
123
For significant differences, changes over time were assessed via pairwise comparisons using
124
Bonferroni test. Diet diaries were analysed using Micro diet (v.3; v.4). Analysis was repeated with
125
weight status (normal weight versus overweight) used as covariate. Significant changes were set at
126
p≤ 0.05.
127
3. Results
128
Thirty participants completed the study. The characteristics of the population are summarised
129
in Table 1. The population was Caucasian and one participant had mixed ethnicity. Twelve
130
participants were normal weight (BMI between 18.5-24.9 Kg/m2) and nine were overweight (BMI>25
131
Kg/m2).
132
Table 1. Characteristics of the studied population.
133
Age (years) 26.1 (10.56)
Gender (M/F) 10/20
BMI (Kg/m2) 23.44 (3.42)
Waist circumference (cm) 75.22 (8.77)
Age, BMI and waist circumference are expressed as mean (standard deviation).
134
3.1. AUC for glucose and postprandial glucose levels
135
Analysis showed a significant effect of intervention (water, sugar and stevia) on AUC for glucose
136
(F (2, 58) 11.83, p< 0.0001). Sugar preload resulted in a higher AUC for glucose compared to water
137
(p=0.001) and stevia (p=0.007), while no significant difference between water and stevia preloads was
138
noted (p=0.2).
139
Postprandial glucose levels were significantly higher after sugar preload (p<0.05). However,
140
after adjusting for blood glucose values following preload, the difference was no longer significant.
141
3.2. Ad libitum lunch
142
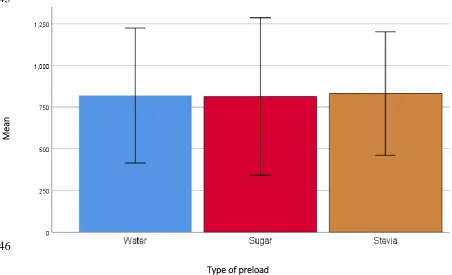
Despite the difference in Energy content between preloads, there were no significant effect of
143
145
146
147
148
Figure 3: Energy intake from ad libitum meal following water, sugar and stevia preload
149
consumption.
150
p>0.05
151
152
3.3. Daily Energy intake during each test day
153
There were no significant differences in daily Energy intake between water, sugar and stevia
154
interventions (F (1.59, 44.59), p=0.33). Participants did not compensate by consuming more Energy
155
during the day after the stevia preload (1660 ± 584 Kcal) compared to sugar preload (1771 ±763 Kcal,
156
p = 0.82) (Table 2).
157
Table 2. Daily Energy and macronutrient intake during the three test meal days:
158
Daily Energy intake (Kcal) Carbohydrates (g) Protein (g) Fat (g)
Water 1564 (981) 225.14 (124.38) 62.64 (41.67) 51.1 (43.1) Sugar 1771 (763) 251.64 (122.66) 69.37 (39.8) 53.29 (27.7) Stevia 1660 (584) 223.30 (87.67) 66.7 (30.42) 57.51 (22.44)
p>0.05.
159
3.4. Visual analogue scales
160
There were no significant differences in reported scores of satisfaction and fullness between
161
preloads after adjusting values form baseline (VAS1) (p>0.05). However, there was a significant effect
162
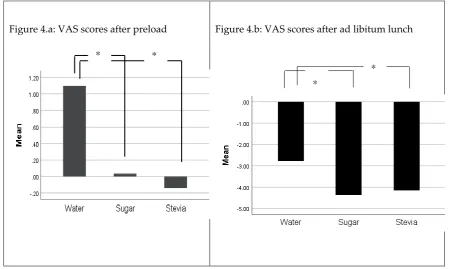
of preload on scores of hunger 30 minutes after preload (F (1.6, 45.2) =4.35, p=0.027). Participants
163
scored higher rates of hunger following the intake of water preload compared to sugar and stevia
164
preloads (p<0.05), while no significant differences were noted between sugar and stevia. Similar
165
results were reported in the VAS scores for hunger following lunch (F (2, 58) =5.82, p=0.05). Stevia
166
resulted in lower subjective feelings of hunger compared to water (p=0.039), while no significant
167
differences between sugar and stevia were noted (p>0.05) (Figure 4).
168
Mean
There was a significant effect of preload on DTE after preload intake (F (2.58) =14.15, p<0.0001).
169
Participants scored a higher desire to eat following water intake (p=0.001) compared to stevia and
170
sugar intake, while there were no significant differences in ratings between sugar and stevia.
171
172
Figure 4.a: VAS scores after preload
Figure 4.b: VAS scores after ad libitum lunch
Figure 4. Hunger scores following preloads and ad-libitum lunch. *p<0.05.
173
3.5. Effect of weight status on response to NNS
174
A subgroup analysis based on BMI status (normal weight versus overweight) showed no
175
significant differences between groups for VAS scores for fullness, hunger, satisfaction and desire to
176
eat between groups. There were also no significant differences in Energy intake at lunch time
177
(F(2,54)=1.41, p=0.25)) or during the day (F(1.6, 43.4)= 1.06, p=0.35)). Similar outcomes were noted for
178
AUC levels for glucose (F (2, 56) = 1.52, p=0.23)).
179
4. Discussion
180
This study aimed to assess whether stevia increased appetite and food intake compared to sugar
181
and water, and leads to higher postprandial glucose levels following a meal. In our study, the higher
182
Calorie content of the sugar preload (240 Kcal) compared to water and stevia (virtually no Calories)
183
did not lead to a significant difference in Energy intake at lunch or during the day between preloads.
184
Results are in line with the study of Anton et al. (2010) [13], which reported that stevia did not result
185
in short-term compensation of food at lunchtime or during the day, when compared to sugar. Tey et
186
al. (2016) [14] reported similar results. However, whether the compensation occurs over the long term
187
remains to be investigated.
188
Compared to water, stevia led to lower subjective feelings of hunger and DTE after preload, and
189
lower VAS of hunger before lunch (p<0.05), with no resultant significant differences in Energy intake.
190
Interestingly, sugar and stevia resulted in similar satiety ratings compared to water. Outcomes are
191
novel and have not been reported before. They could suggest that stevia has the potential to reduce
192
appetite and consequently Energy intake, yet the consumption of food in a laboratory setting might
193
have affected the outcomes. Further research looking at the satiety effects of stevia compared to water
194
and sugar need to be considered.
195
AUC for glucose was significantly higher after the sugar preload compared to water and stevia.
196
This could be solely due to the Caloric content of sugar. In fact, when we corrected for glucose levels
197
after preloads, there were no significant differences in postprandial glucose levels (after ad libitum
198
* *
*
meal) between the three preloads. This finding does not match with the study of Anton et al. (2010)
199
[13], which noted a potential role of stevia in lowering postprandial glucose levels and managing
200
postprandial hyperglycaemia. Furthermore, these results do not support in vitro and animal studies,
201
which showed that stevia extract enhances insulin secretion and glucose absorption [17,18].
Long-202
term human intervention studies using stevia doses within the Acceptable daily intakes (as set up by
203
the European Food Safety Authority (EFSA)), could help elucidating these effects.
204
Our findings suggest that stevia has at least a neutral effect on short-term food intake (it did not
205
increase food palatability) and its consumption led to lower postprandial glucose levels compared to
206
sucrose, providing another evidence that the link between type 2 diabetes, obesity and the
207
consumption of NNS is due to reverse causality.
208
Outcomes did not show significant effects of weight status (normal weight versus overweight)
209
on the different outcomes. This might be due to the fact that our study was not powered enough to
210
detect significant differences based on weight status. Further studies solely focused on the
211
overweight and obese population need to be considered.
212
Our study has several limitations. In addition to the inclusion of free-living individuals, the
213
study took place in a Laboratory setting which could have affected participants’ usual eating patterns.
214
Our study was also single-blinded; while this is an advantage over open label studies, participants
215
were not aware of the preload content, which might have affected Energy compensation after lunch
216
or during the day. However, the strengths of the study include the presence of a control group (water)
217
and the measurement of glucose and satiety at several intervals during the study.
218
In conclusion, stevia intake did not lead to Energy compensation during lunch or dinner, and
219
lowered postprandial glucose levels compared to sugar. Stevia might be a useful strategy to assist
220
with weight loss and help manage hyperglycaemia in diabetes. Further studies looking at how stevia
221
(in both foods and drinks) affects taste preferences are needed. Moreover, research looking at the
222
long-term effects of stevia on weight regulation in both normal weight and overweight people, could
223
help public recommendations to incorporate stevia into an overall healthful dietary pattern and
224
reduce the intake of free sugars and Energy intake. However, it is important to bear in mind that
225
stevia, similarly to other NNS, does not make the diet healthier; it makes it less unhealthy.
226
Author Contributions: GF conceived the study, developed methodology, analysed results and wrote the
227
manuscript. VB and LM carried out data collection, reviewed, and edited the manuscript. All authors read and
228
approved the submitted version.
229
Funding: This research received no external funding.
230
Acknowledgments: We would like to express our gratitude to all participants who took part in the study
231
Conflicts of Interest: The authors declare no conflict of interest.
232
References
233
1. Diabetes UK. Available online:
https://www.diabetes.org.uk/guide-to-diabetes/enjoy-food/carbohydrates-234
and-diabetes/sugar-sweeteners-and-diabetes (accessed 25 November 2019).
235
2. Rogers, P. J.; Hogenkamp P.S; De Graaf C; Higgs S; Lluch A; Ness A. R.; Penfold C; Perry R; Putz P;
236
Yeomsnd MR; Mela DJ. Does low-Energy sweetener consumption affect Energy intake and body weight?
237
A systematic review, including meta-analyses, of the evidence from human and animal studies."
238
International Journal of Obesity 2016, 40, 381-394.
239
3. IDF. Available online: http://www.diabetesatlas.org/across-the-globe.html (accessed 9 October 2019).
240
4. WHO. Available online:
241
http://www.who.int/healthinfo/global_burden_disease/GlobalHealthRisks_report_full.pdf (accessed 24
242
November 2019)
243
5. Monnier, L.; Lapinski, H.; Colette, C. Contributions of fasting and postprandial plasma glucose increments
244
to the overall diurnal hyperglycemia of type 2 diabetic patients: variations with increasing levels of HbA1c.
245
Diabetes care 2003, 26, 881-885.
246
6. Ceriello, A. The possible role of postprandial hyperglycaemia in the pathogenesis of diabetic complications.
247
Diabetologia 2003, 46, M9-M16.
7. Swithers, S. E. Artificial sweeteners produce the counterintuitive effect of inducing metabolic
249
derangements. Trends in Endocrinology & Metabolism 2013, 24, 431-441.
250
8. Sylvetsky, A. C.; & Rother, K. I. Nonnutritive sweeteners in weight management and chronic disease: a
251
review. Obesity 2018, 26, 635-640.
252
9. BDA. Available online:
253
https://www.bda.uk.com/improvinghealth/healthprofessionals/policy_statements/sweetners (accessed 20
254
November 2019).
255
10. Pepino, M.Y. Metabolic effects of non-nutritive sweeteners. Physiology & behavior 2015, 152, 450-455.
256
11. Ashwell, M. Stevia, nature’s zero-calorie sustainable sweetener: A new player in the fight against obesity.
257
Nutrition today 2015, 50: 129-134.
258
12. Curi, R.; Alvarez, M.; Bazotte, R.B.; Botion, L.M.; Godoy, J.L.; Bracht, A. Effect of Stevia rebaudiana on
259
glucose tolerance in normal adult humans. Brazilian J. Med. Biol. Res. 1986, 19, 771–774.
260
13. Anton, S. D.; Martin, C. K.; Han, H.; Coulon, S.; Cefalu, W. T.; Geiselman, P.; & Williamson, D. A. Effects
261
of stevia, aspartame, and sucrose on food intake, satiety, and postprandial glucose and insulin levels.
262
Appetite 2010, 55, 37-43.
263
14. Tey, S.L.; Salleh, N.B.; Henry, J; Forde, C.G. Effects of aspartame-, monk fruit-, stevia-and
sucrose-264
sweetened beverages on postprandial glucose, insulin and Energy intake. International Journal of Obesity
265
2017, 41, 450-465.
266
15. Ritu, M.; Nandini, J. Nutritional composition of Stevia rebaudiana, a sweet herb, and its hypoglycaemic
267
and hypolipidaemic effect on patients with non-insulin dependent diabetes mellitus. J. Sci. FoodAgric. 2016,
268
96, 4231–4234.
269
16. WHO. Waist Circumference and Waist-Hip Ratio: Report of a WHO Expert Consultation. Available online:
270
http://whqlibdoc.who.int/publications/2011/9789241501491_eng.pdf (accessed 10 October 2019).
271
17. Jeppesen, P. B.; Gregersen, S.; Poulsen, C. R.; Hermansen, K. Stevioside acts directly on pancreatic β cells
272
to secrete insulin: Actions independent of cyclic adenosine monophosphate and adenosine triphosphate—
273
sensitivie K+-channel activity. Metabolism 2000, 49, 208-214.
274
18. Jeppesen, P. B.; Gregersen, S.; Alstrup, K. K.; Hermansen, K. Stevioside induces antihyperglycaemic,
275
insulinotropic and glucagonostatic effects in vivo: studies in the diabetic Goto-Kakizaki (GK) rats.
276
Phytomedicine 2002, 9: 9-14.
277
278
279
© 2019 by the authors. Submitted for possible open access publication under the terms and conditions of the Creative Commons Attribution (CC BY) license (http://creativecommons.org/licenses/by/4.0/).
280