RVC OPEN ACCESS REPOSITORY – COPYRIGHT NOTICE
This author’s accepted manuscript may be used for non-commercial purposes in accordance
with
Wiley Terms and Conditions for Self-Archiving
.
The full details of the published version of the article are as follows:
TITLE: Integrating morphology and in vivo skeletal mobility with digital models to infer
function in brittle star arms
AUTHORS: Elizabeth G. Clark, John R. Hutchinson, Simon A. F. Darroch, Nicolás
Mongiardino Koch, Travis R. Brady, Sloane A. Smith, Derek E. G. Briggs
JOURNAL: Journal of Anatomy
PUBLISHER: Wiley
PUBLICATION DATE: 23 October 2018 (online)
3
6 1
2
Integrating morphology and in vivo skeletal mobility
4
with digital models to infer function in brittle star
5arms
7
Elizabeth G. Clark,
1John R. Hutchinson,
2Simon A. F. Darroch,
3Nicola's Mongiardino Koch,
18 9 10 11 12 13 14 15 16 17 18 19 20 21 22 23 24 25 26 27 28 29 30 31 32 33 34 35 36 37 38 39 40 41 42 43 44 45 46 47 48 49 50
Travis R. Brady,
4Sloane A. Smith
4and Derek E. G. Briggs
1,51Department of Geology and Geophysics, Yale University, New Haven, CT, USA
2Structure and Motion Laboratory, Department of Comparative Biomedical Sciences, The Royal Veterinary College,
Hertfordshire, UK
3Department of Earth and Environmental Science, Vanderbilt University, Nashville, TN, USA 4Department of Biomedical Engineering, Yale University, New Haven, CT, USA
5Yale Peabody Museum of Natural History, Yale University, New Haven, CT, USA
Abstract
Brittle stars (Phylum Echinodermata, Class Ophiuroidea) have evolved rapid locomotion employing muscle and skeletal elements within their (usually) five arms to apply forces in a manner analogous to that of vertebrates. Inferring the inner workings of the arm has been difficult as the skeleton is internal and many of the ossicles are sub-millimeter in size. Advances in 3D visualization and technology have made the study of movement in ophiuroids possible. We developed six virtual 3D skeletal models to demonstrate the potential range of motion of the main arm ossicles, known as vertebrae, and six virtual 3D skeletal models of non-vertebral ossicles. These models revealed the joint center and relative position of the arm ossicles during near-maximal range of motion. The models also provide a platform for the comparative evaluation of functional capabilities between disparate ophiuroid arm morphologies. We made observations on specimens of Ophioderma brevispina and Ophiothrix angulata. As these two taxa exemplify two major morphological categories of ophiuroid vertebrae, they provide a basis for an initial assessment of the functional consequences of these disparate vertebral morphologies. These models suggest potential differences in the structure of the intervertebral articulations in these two species, implying disparities in arm flexion mechanics. We also evaluated the differences in the range of motion between segments in the proximal and distal halves of the arm length in a specimen of O. brevispina, and found that the morphology of vertebrae in the distal portion of the arm allows for higher mobility than in the proximal portion. Our models of non-vertebral ossicles show that they rotate further in the direction of movement than the vertebrae themselves in order to accommodate arm flexion. These findings raise doubts over previous hypotheses regarding the functional consequences of ophiuroid arm disparity. Our study demonstrates the value of integrating experimental data and visualization of articulated structures when making functional interpretations instead of relying on observations of vertebral or segmental morphology alone. This methodological framework can be applied to other ophiuroid taxa to enable comparative functional analyses. It will also facilitate biomechanical analyses of other invertebrate groups to illuminate how appendage or locomotor function evolved.
Key words: 3D digital modeling; locomotion; mobility; Ophiuroidea; range of motion.
Introduction
Deuterostomia, the superphylum containing chordates,
51 52 53
54 55
1 2 3 4 5 6 7 8 9 10 11 12 13 14 15 16 17 18 19 20 21 22 23 24 25 26 27 28 29 30 31 32 33 34 35 36 37 38 39 40 41 42 43 44 45 46 47 48 49 50 51 52 53 54 55
when acted on by muscles, allows for a variety of motions, permitting these organisms to run, swim and fly. Extensive biomechanical research has been conducted on motion in chordates, in particular vertebrates (Leach & Dagg, 1983; Alexander, 1992a,b, 2003; Bels et al. 2003). However, muscle physiology and mechanical properties of the other major deuterostome clade, the echinoderms, is much less well known. Study of this group is critical to obtaining a deeper picture of the evolution of deuterostome locomotion.
The phylum Echinodermata includes an estimated 13 000 extinct and 7000 extant species (Pawson, 2007), the latter representing five body plans: crinoids (class Crinoidea); sea stars (class Asteroidea); sea cucumbers (class Holothuroidea); sea urchins (class Echinoidea); and brittle stars (class Ophi- uroidea). The five living echinoderm classes each employ a unique locomotion strategy (and additional locomotion strategies were presumably used by extinct echinoderm classes). Crinoids, although typically sessile, can crawl or swim using their many arms (Moore, 1924; Shaw & Fon- taine, 1990; Baumiller & Messing, 2007). Sea stars use water pressure to control tube feet to move themselves across the ocean floor (Smith, 1947; Kerkut, 1953). Sea cucumbers gen- erally crawl or burrow using wave-like body movements (Glynn, 1965), but certain forms can walk using modified tube feet (Hansen, 1972; Gebruk, 1995) or swim (Glynn, 1965; Ohta, 1985; Gebruk, 1995). Sea urchins move using a combination of tube feet and muscle-actuated spines (Domenici et al. 2003). These four extant classes are typically slow moving as they generally do not rely on rapid locomo- tion for survival.
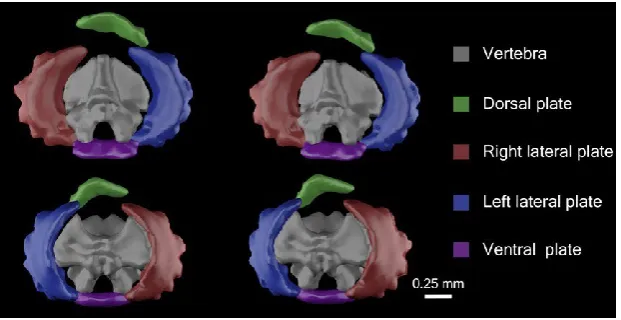
Many extant ophiuroids, in contrast, coordinate move- ments in each of their (usually) five arms to produce rela- tively rapid locomotion. Their arms consist of modular segments (sometimes more than 100 per arm; LeClair, 1996) composed of skeletal elements (ossicles), which are joined via connective tissue and muscle. Connective tissue between successive ossicles is made of specialized material that can change its tensile stiffness and strength under nervous con- trol (Wilkie, 1978a, 2005). Arm segments are typically com- posed of five internal ossicles: a vertebra and a dorsal, ventral and two lateral plates (laterals; Fig. 1). The vertebral ossicles are the most critical for movement as they incorpo- rate the intervertebral muscle attachments and joint inter- faces. Four intervertebral muscles, two aboral and two oral, attach to each vertebra surrounding a central intervertebral joint (Wilkie, 1978b; Byrne, 1994; Clark et al. 2017). Contrac- tion of the intervertebral muscles allows the distal of the two segments to pivot around the joint (LeClair, 1996). A series of spines extends from the laterals, varying in thick- ness, length and number between species.
The ophiuroid fossil record dates back to the Ordovician (Shackleton, 2005) , but the crown group did not evolve until the Late Paleozoic (O’Hara et al. 2014). Although superficially similar, there are distinct morphological differ- ences between stem and crown ophiuroids, particularly in
the arms. Specifically, they generally differ in the ossicles that run along the axis of the arm. Modern ophiuroids have one massive vertebra at the center of each segment. Many Paleozoic forms, in contrast, have two sets of small ossicles (ambulacra) through the center of the arm resembling a zipper, and the morphology of these small ossicles differs among Paleozoic taxa. Paired, fused ambulacra are hypoth- esized to be an autapomorphy of crown group ophiuroids (Smith et al. 1995). Most Paleozoic taxa lack dorsal and ven- tral plates. The functional capabilities of these fossil ossicle arrangements are largely unknown.
During locomotion of modern ophiuroids, each arm performs a series of repetitive actions depending on its position relative to the direction of motion. These actions are redistributed during direction changes so that the organism can move omnidirectionally without turning the central disk (Astley, 2012; Kano et al. 2012; Mao et al. 2014). Ophiuroids adjust the actions performed by the arms in response to arm damage or loss to minimize decrease in movement capability, and they can continue locomotion using tube feet on the ventral surface of the disk even when all the arms are removed (Arshavskii et al. 1976a; Kano et al. 2017; Matsuzaka et al. 2017). They coordinate arm movements using decentralized con- trol (Kano et al. 2012, 2017; Watanabe et al. 2012). Fea- tures of ophiuroid arms and locomotion have been applied to robotics (Lal et al. 2008; Kano et al. 2012, 2017; Watanabe et al. 2012; Mao et al. 2014), biomaterial development (Wilt, 2005; Barbaglio et al. 2012, 2013) and regenerative medicine (Dupont & Thorndyke, 2007; Can- dia Carnevali & Burighel, 2010; Green et al. 2016).
Despite these powerful applications and the unique nat- ure of ophiuroid locomotion, it has been the subject of rela- tively little experimental research, in particular on how ossicle morphology and articulation influence range of motion. The gait patterns of ophiuroid arms (i.e. the differ- ent distributions of rhythmic coordinated actions of the arms to produce locomotion) have been studied (Arshavskii et al. 1976a,b; Astley, 2012; Watanabe et al. 2012; Kano et al. 2017; Matsuzaka et al. 2017), and ranges of lateral motion in the arms have been measured externally on living specimens (LeClair & LaBarbera, 1997). However, it has been difficult to infer the functions of the arm joints in an anatomical context, due to their small size and because the key areas of interest are obscured by soft tissue and ossicles (Fig. 1).
1
A 2
3
4 Fig. 1 Stereo images of 3D polygonal 5 meshes of 24th most proximal segment of 6 Ophiothrix angulata (YPM 7415), (A) distal 7 face and (B) proximal face (see details in 8 Table S1). The position of the dorsal ossicle
mesh is tilted as the segment was rotated B 9 slightly internally during the micro-computed 10 tomography (CT) scan; the dorsal ossicle was 11 flat in scans of O. angulata where the arm 12 was straight. Meshes visualized and imaged 13 using Autodesk Maya (see Materials and 14 methods).
15
16 greater than that allowed by the zygospondylous joint
17 (Hyman, 1955; Byrne, 1994; LeClair, 1996). The strep-
18 tospondylous joint is a trait that exhibits homoplasy: it is
19 present in the Euryalida and in the non-euryalid families
20 Ophiacanthidae and Hemieuryalidae (LeClair, 1996; Sto€hr,
21 2012).
22 Non-euryalid ophiuroids, in contrast, form a polyphyletic
23 group comprising over 90% of ophiuroid species (Sto€hr
24 et al. 2012; O’Hara et al. 2014, 2017). They show greater
25 interspecific vertebral disparity (LeClair, 1994) and greater
26 complexity in their vertebral articulations (LeClair, 1994;
27 LeClair & LaBarbera, 1997), and they inhabit a greater
28 breadth of ecological niches than the euryalids (Warner,
29 1982; LeClair, 1996; LeClair & LaBarbera, 1997). The
30 zygospondylous articulation has a multifaceted process on
31 the proximal face accommodated by a socket on the distal
32 face (Hyman, 1955).
33 Two major categories of zygospondylous articulation
34 are recognized based on morphometrics: non-keeled
35 (Group I); and keeled (Group II; LeClair, 1994, 1996;
36 Fig. 2). Non-keeled and keeled zygospondylous vertebrae
37 differ in the nature of their distal and proximal pro-
38 cesses, particularly in the presence or absence of a large
39 keel on the distal surface of the vertebra and a corre-
40 sponding groove on the aboral proximal surface (LeClair,
41 1996, fig. 2; Fig. 2).
42 The ecological and taxonomic radiation of ophiuroids has
43 been attributed to the evolution of different vertebral joint
44 types (Hendler & Miller, 1991; Litvinova, 1994; LeClair, 1996;
45 LeClair & LaBarbera, 1997). Specific joint morphologies are
46 thought to facilitate certain modes of locomotion and feed-
47 ing (Hendler & Miller, 1991; LeClair & LaBarbera, 1997).
48 These inferences rely on the assumption that vertebral mor-
49 phology influences motion capabilities (Emson & Wilkie,
50 1982; Hendler & Miller, 1991; Litvinova, 1994). However,
51 experimental data suggest that interspecific variation in lat-
52 eral mobility is not significantly correlated with vertebral
53 morphology or feeding ecology (LeClair & LaBarbera, 1997).
54 Here, we use ‘mobility’ to refer to intersegmental range of
55 motion; thus, ‘flexibility’ (sensu LeClair & LaBarbera, 1997;
Hendler & Miller, 1991) is equivalent to how we use mobil- ity here.
The first step in addressing the larger question of the relationship between ophiuroid vertebral morphology, mobility and ecology is to evaluate functional differences between their disparate intervertebral joints. In order to build a platform to analyze the impact of vertebral mor- phology on the potential range of motion of the ophi- uroid arm, we created 3D digital models based on micro-computed tomography (CT) scans that were used to view the relative positions of the arm ossicles during flexion. The models were validated using in vivo range of motion data from the same specimens. We used spec- imens of two living ophiuroids, Ophioderma brevispina (Say, 1825) and Ophiothrix angulata (Say, 1825), repre- senting non-keeled (Group I) and keeled (Group II) zygospondylous vertebral morphologies, respectively. The analysis was conducted using zygospondylous morpholo- gies so that disparate yet homologous morphological structures could be compared, setting up a framework that could be used to analyze the vast majority of ophi- uroid vertebral disparity in future studies. This frame- work allows for the investigation of three hypotheses regarding the relationship between ophiuroid vertebral shape and function; we provide an initial consideration of these hypotheses here.
1 Range of motion does not correlate with disparity in interspecific non-euryalid vertebral morphology: In vivo behavioral observations by LeClair & LaBarbera (1997) suggested that variation in lateral mobility is not related to vertebral morphology. Our considera- tion of this hypothesis involved comparing the inter- segmental joints during near-maximal dorsal and lateral arm flexion in two specimens each of O. bre- vispina and O. angulata zygospondylous vertebrae, focusing on the functional consequences of the mor- phological features that define vertebral groups I and II.
1
2 A B
3 4 5 6 7 8 9 10 11 12 13 14 15 16 17 18 19 20 21
22 Fig. 2 Stereo images of 3D vertebral meshes showing terminology used to describe vertebral features (after LeClair, 1996, fig. 2). (A) The 11th 23 most proximal vertebra of Ophioderma brevispina; (B) the 24th most proximal vertebra of Ophiothrix angulata (YPM 7415; see details in Table S1). 24 Right lateral view shown in O. brevispina, left lateral view in O. angulata. Vertebral meshes visualized and imaged using Autodesk Maya. 25
26 vertebra that directly contacts the adjacent vertebra): 27 Hendler & Miller (1991) speculated that reduced size 28 of the articular surface of the vertebral face relative 29 to the area of muscle insertion correlates with 30 increased arm mobility. We provide an initial evalua- 31 tion of this hypothesis by comparing near-maximal 32 mobility in segments of the proximal and distal areas 33 of the total free arm (by dividing the arm in two 34 halves by length) in a specimen of O. brevispina [the 35 proportion of articular surface area to surface area of 36 the muscle insertions is relatively smaller in vertebrae 37 of the proximal half of the arm than in those of the 38 distal half (LeClair, 1996)].
39 3 The presence of dorsal, lateral or ventral plates 40 reduces mobility: Litvinova (1994) regarded it as an 41 ‘obvious conclusion’ that large, developed plates 42 restrict motion of the arm. We observed the posi- 43 tions of these external ossicles before and during 44 near-maximal flexion in four specimens of O. bre- 45 vispina and O. angulata to determine if they are 46 the factor-limiting range of motion in these ophi- 47 uroids.
48
49 The 3D digital models constructed here were used to 50 document the mobility of the intervertebral joint as the 51 arm engaged in lateral and dorsal flexion. As hypotheses 52 of the relationship between morphology and range of 53 motion prior to this had only been based on superficial 54 features of isolated ossicles, we used the models to 55 develop our understanding of the extent to which
morphological differences between ophiuroid arm seg- ments affect function. To do so, we adapted methods used in the study of vertebrate biomechanics; this approach can be applied to the analysis of a broader range of ophiuroid taxa in the future, and to the investi- gation of mobility in other invertebrates.
Materials and methods
Experimental overview
1 and Yale University protocols for working with invertebrate 2 animals.
3
4 In vivo range of motion
5
6 We measured the near-maximal range of dorsal and lateral arm 7 flexion in vivo in the proximal and distal halves (determined by dividing the total length of the arm in half). Live animals were used 8
because measurements of museum specimens preserved in alcohol 9 might result in artifacts due to unnaturally flaccid or stiffened post 10 mortem soft tissues controlling joint motions. Dorsal and lateral 11 deviations from the straightened arm are critical directions of flex- 12 ion for locomotion and feeding in non-euryalid ophiuroids. The 13 term ‘dorsal’ here refers to direction of motion; ‘aboral’ is used in 14 names of morphological features (e.g. ‘aboral groove’, ‘aboral pro- cess’, ‘aboral muscle area’, etc.). The specimens were anesthetized 15
using MgCl2 hexahydrate (as in Arafa et al. 2007; see also Deheyn 16 et al. 1996, 2000) by gradually increasing the concentration until 17 they became motionless and unresponsive. The proximal portion of 18 an arm was bent near-maximally in a dorsal direction from the oral 19 disk by curving the arm until it offered strong resistance. Near-maxi- 20 mal positioning was used because measuring maximal range of 21 motion would have potentially damaged the arm ossicles, and did so in some early trials with other specimens. The fragility of these 22 specimens meant that true maximal (i.e. at failure point) and near- 23 maximal motion were similarly subjective and, in our view, not far 24 apart. The specimen was braced in this position using pins and pho- 25 tographed with a Canon Powershot G16 (12.1 megapixel) camera 26 (Fig. 3A,B). We repeated this process four times using the same arm 27 that was straightened and re-submerged in the anesthetizing solu- 28 tion for 30 s between trials. Multiple trials were conducted to assess the consistency of near-maximal flexion. The flexion of the distal 29
portion of the same arm was determined in the same way. This pro- 30 cess was repeated with a second specimen of each species to mea- 31 sure the range of lateral motion. Only proximal flexion was 32 measured in O. angulata, as the arm is too small distally to allow 33 accurate data to be collected with our equipment.
34 When the in vivo flexion trials were complete, we immediately 35 micro-CT scanned each specimen with both the proximal and distal 36 portions of the arm in a near-maximally flexed position correspond- ing to that in the in vivo measurements. The micro-CT scans were 37 obtained using the North Star Imaging ImagiX (North Star Imaging, 38 Minnesota, USA) in the Darroch Lab at Vanderbilt University (Ten- 39 nessee, USA; see Table S1 for scan settings and output information). 40 Volumes were reconstructed using EFX-CT software (North Star 41 Imaging, Minnesota, USA), and the micro-CT scans were visualized 42 with VG Studio MAX v. 2.2 and 3.0 software (Volume Graphics, 43 Heidelberg, Germany).
44 The 3D volume from the micro-CT scans of the specimens in near- maximally flexed position provided a view equivalent to that in the 45 photographs of the in vivo trials. In every case, we measured 46 the angle formed by each segment from the photographs and from 47 the equivalent view of the 3D volume in ImageJ software (https:// 48 imagej.nih.gov/ij/; Fig. 3B,C). These measurements were obtained to 49 ensure that the distribution of the flexed articulations in the 3D vol- 50 ume fell within that observed in the specimen in vivo, that is, to val- 51 idate the use of the scan data. We tested this by comparing the distribution of flexion angles between successive segments 52 observed in vivo with those responsible for the range of motion in 53 the 3D volume. Most of the angles between successive vertebrae 54 involved in the flexion were over 6.5 ° in both the in vivo trials and 55 the 3D volumes; we thus considered angles of 6.5 ° and higher to
A
B
C
Fig. 3 (A, B) Setup for in vivo intersegmental angle measurement of the proximal portion of the arm of Ophioderma brevispina. (C) 3D vol- ume from micro-computed tomography (CT) scan of the same speci- men for comparison visualized and imaged in VG Studio MAX (see Materials and methods).
1 of O. brevispina. In each case, values were compared using Mann– 2 Whitney U-test. Statistical analyses were performed in the R soft- 3 ware environment (R Core Team, 2017).
4
5 Construction of the 3D digital models
6
7 After scanning an arm in a near-maximally flexed position, we 8 immediately straightened and re-scanned it. We used a four-step process to integrate data from the flexed and straight arms, and 9
create the mobility models: (i) surface structure of two adjacent ver- 10 tebrae were extracted as polygonal meshes from scans of straight 11 and flexed arms; (ii) the vertebral meshes were imported into Maya 12 software (Autodesk, San Rafael, USA; Fig. 4A); (iii) the straight and 13 flexed orientations of the same proximal vertebral meshes were 14 superimposed (Fig. 4B); and (iv) the location of a joint center was 15 specified through inverse kinematics (Tolani et al. 2000; Nicolas et al. 2007) so that, when rotated, the distal ossicle from the flexed 16
scan was superimposed on that from the straight one while mini- 17 mizing overlap with the distal face of the proximal ossicle (Fig. 4C). 18 1 Extracting surface structure of two adjacent vertebrae as 19 polygonal meshes from scans of straight and flexed arms. We 20 extracted two articulated vertebrae from both the proximal 21 and distal portions of the micro-CT scan of the flexed ophi- 22 uroid arm using VG Studio MAX 3.0, referred to as ‘flexed proximal’ and ‘flexed distal’, respectively. We then extracted 23 corresponding articulated vertebrae from the scan of the 24 straight arm (‘straight proximal’ and ‘straight distal’; Fig. 4A). 25 2 Importing the vertebral meshes into Maya software. The four 26 segmented vertebrae were exported from VGStudio as water- 27 tight polygonal meshes in STL format 3D image files and 28 imported into Maya (Fig. 4A). During import and setup, we 29 maintained the position of the vertebral meshes as they were articulated in the 3D volume (i.e. ‘flexed proximal’ with 30
‘flexed distal’ and ‘straight proximal’ with ‘straight distal’). 31 We used the articular morphology of the ‘straight proximal’ 32 and ‘straight distal’ vertebral meshes as a neutral (or refer- 33 ence) pose (Gatesy et al. 2010; Fig. 5B). We assessed the joint 34 angle and articulation of the ‘flexed proximal’ and ‘flexed 35 distal’ vertebral meshes in reference to this neutral pose. We 36 used this pose to compare flexion in the proximal and distal
portions of the arm. 37
3 Superimposing the straight and flexed orientations of the 38 same proximal vertebral meshes. To compare arm orienta- 39 tions, we superimposed the ‘flexed proximal’ and ‘straight 40 proximal’ vertebral meshes in Maya (Fig. 4B). We added col- 41 ored axes in Maya to link ‘flexed proximal’ and ‘flexed dis- 42 tal’ (as in Otero et al. 2017; Figs 4B and 5A). The center of 43 each axis became a joint center with three rotational degrees of freedom: mediolateral, dorsoventral and internal/ 44
external. We designated the new joint center as the center 45 of rotation of ‘flexed distal’, allowing motions in 3D to be 46 expressed relative to the axis of rotation. The coordinate sys- 47 tem aligned the x (red)-axis dorsoventrally so that rotation 48 resulted in lateral flexion. The y (green)-axis was orthogonal 49 to the x (dorsoventral)-axis. The z (blue)-axis corresponded 50 to the longitudinal axis of the straight arm; rotations around
it corresponded to internal/external rotation.
51 4 Locating the joint center. We used inverse kinematics to locate 52 the position of the joint center along the x- and z-axes in the 53 dorsal flexion models, and along the z-axis in the lateral flex- 54 ion models. Translation along the y-axis was not considered 55 for either dorsal or lateral flexion models, as ophiuroid
A
B
C
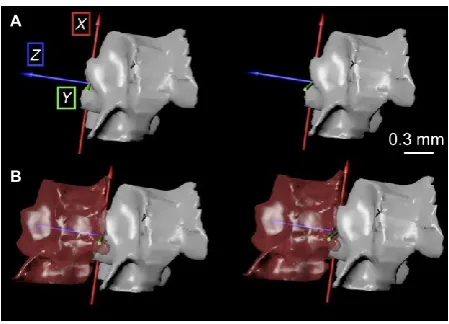
Fig. 4 Process for construction of digital models in Autodesk Maya using polygonal meshes of ophiuroid vertebrae from micro-computed tomography (CT) scans. (A) Left lateral view of vertebral meshes of Ophioderma brevispina (see details in Table S1). Intervertebral joint flexed dorsally (left pair) and straight (right pair). Vertebral meshes labeled as used in the text. (B) Proximal vertebral meshes superim- posed for direct comparison of relative orientations of distal ossicles; ‘flexed distal’ at 50% transparency. Tri-colored axis inserted at joint center. (C) Joint axis rotated to superimpose distal ossicle meshes.
1 A 2
3 4 5 6 7
8 B
9 10 11 12 13 14
15 Fig. 5 Stereo images of neutral reference pose in left lateral view of 16 vertebral mesh of Ophioderma brevispina visualized using Autodesk 17 Maya (see details in Table S1) without ‘straight distal’ (A) and articu- 18 lated with ‘straight distal’ at 50% transparency (B). Tri-colored axes rep- 19 resent coordinate system of joint center (see Materials and methods). 20
21 in the neutral reference pose (Fig. 4C). As each model focused 22 on movement in a single plane, we used the joint center to 23 rotate ‘flexed distal’ into the neutral pose of the other two 24 planes to correct for minor rotation along the other axes. This approach allowed us to build six mobility models: dorsal flex- 25
ion of: (i) the proximal and (ii) distal arms in O. brevispina; lat- 26 eral flexion of (iii) the proximal and (iv) distal arms in 27 O. brevispina; and (v) the dorsal and (vi) lateral flexions of the 28 proximal arm in O. angulata.
29
We also assessed the shift in position of the dorsal, ventral and 30 lateral ossicles relative to the vertebra during flexion. The five ossi- 31 cles from the segments in the ‘flexed distal’ and ‘straight distal’ ver- 32 tebral meshes were extracted as watertight polygonal meshes from 33 their respective micro-CT scans and imported into a new Maya file. 34 We maintained the position of the four non-vertebral ossicle 35 meshes relative to their respective vertebral meshes. The vertebral 36 mesh from the flexed scan was superimposed over that in the straight scan. The orientations of the four non-vertebral arm ossicles 37 were compared between the two orientations.
38 39
40 Using digitized morphology of physical specimens
41 The watertight polygonal meshes used in the construction of the 42 3D digital models were built using an algorithm within VG Studio 43 MAX based on the structure of the surface of a selected volume in 44 the micro-CT scan. We noticed that reconstructing ossicle shape 45 using this method resulted in minor differences between the shape 46 of the meshes of the same ossicles extracted from different scans. Features of the minute ossicles in the micro-CT scans approached 47
the size limits of the resolution of the mesh-building software. 48 Some of the edges of the vertebrae, for example, appear rough or 49 punctured as their width approaches this limit (e.g. Group I proxi- 50 mal face aboral muscle area in Fig. 2A). In addition, the close prox- 51 imity of the ossicles often made it difficult to discern the outline of 52 separate structures. Some features of the ossicles were edited after 53 extraction, such as 2D surfaces outside the main volume of each object, but such editing was minimal in order to adhere to the orig- 54 inal morphology as closely as possible and to minimize subjectivity. 55
Another artifact of micro-CT imaging is ‘beam hardening’, which can falsely represent the edges or relative densities of imaged objects. Acknowledging these downsides, the utility of this imaging method for studying ophiuroid functional morphology significantly outweighs the shortcomings.
Ancestral state reconstruction
We performed an ancestral state reconstruction to look at the evo- lutionary history of Group I and Group II vertebral morphologies across Ophiuroidea. Ancestral state reconstruction was performed in R package phytools (Revell, 2012) using 100 replicates of stochas- tic character mapping (Bollback, 2006) under an equal rates model. The topology employed corresponded to that of O’Hara et al. (2017) with terminals pruned to the set of taxa coded by LeClair (1996).
Results
3D segment morphology
The vertebral meshes of the two taxa revealed the differ- ences between the proximal and distal faces that distin- guish the two groups of zygospondylous articulations (LeClair, 1996; Figs 2, 6 and 7). The vertebral meshes of the O. brevispina specimens showed the prominent proximal and distal aboral articulating processes, and the absence of a proximal aboral groove and distal keel characteristic of Group I (Figs 2A, 6A,B and 7A,B). The vertebral meshes of the O. angulata specimens showed the relatively reduced proximal aboral articulating process, large distal keel and proximal aboral groove characteristic of Group II (Figs 2B, 6C and 7C).
The distal aboral muscle attachments in the vertebral mesh of the Group I O. brevispina specimens appear rela- tively shallow compared with those of Group II O. angulata specimens in lateral view, as do the proximal aboral attach- ments (Fig. 8). The median process slopes gently in the O. brevispina specimens compared with the sharp, promi- nent feature in the O. angulata specimens (Fig. 8). We also observed notable differences in the relative size of the ver- tebra and the other four ossicles. The articulating surface of the vertebra adjoining the lateral ossicles is relatively larger in the O. brevispina specimens than in the O. angulata specimens. The dorsal plate extends farther beyond the proximal dorsal edge of the vertebra in the segments of O. brevispina than in the segments of O. angulata, where it rests on the vertebral keel. The vertebra does not extend distally beyond any of the other ossicles in the segments of O. brevispina, whereas it approaches or extends slightly beyond their distal margins in the segments of O. angulata (Figs 6–8).
1
A 2
3 4 5 6
B 7
8 9 10
11 C
12 13 14 15
16 Fig. 6 Stereo images of 3D meshes of distal face of micro-computed tomography (CT) scanned ophiuroid vertebrae from (A) Ophioderma bre- 17 vispina proximal (11th segment), (B) distal (43rd segment), and (C) Ophiothrix angulata (24th segment; YPM 7415). The position of the dorsal ossi- 18 cle mesh in (C) is tilted as the segment was rotated slightly internally during the micro-CT scan; the dorsal ossicle was flat in scans of O. angulata 19 where the arm was straight. Furthest left in row shows vertebral morphology; second to left shows vertebra articulated with non-vertebral ossicles. 20 See Table S1 for scan and rendering details. Meshes visualized and imaged using Autodesk Maya.
21 22
23 A
24 25 26 27
28 B
29 30 31
32 C
33 34 35 36 37
Fig. 7 Stereo images of 3D meshes of proximal face of micro-computed tomography (CT) scanned ophiuroid vertebrae from (A) Ophioderma bre- 38
vispina proximal (11th segment), (B) distal (43rd segment), and (C) Ophiothrix angulata (24th segment; YPM 7415). The position of the dorsal ossi- 39 cle mesh in (C) is tilted as the segment was rotated slightly internally during the micro-CT scan; the dorsal ossicle was flat in scans of O. angulata 40 where the arm was straight. Furthest left in row shows vertebral morphology; second to left shows vertebra articulated with non-vertebral ossicles. 41 See Table S1 for scan and rendering details. Meshes visualized and imaged using Autodesk Maya.
42 43
44 observed that the proximal vertebral meshes in the O. bre-
45 vispina specimens (Group I) are proportionally shorter on
46 the proximal–distal axis, have smaller articulating surfaces
47 to the lateral ossicles (Fig. 8), and are larger dorsoventrally
48 relative to the rest of the segment than the distal vertebral
49 meshes (Figs 6 and 7).
50 51
Comparing range of motion measurements in vivo
52
and with micro-CT
53
54 Angle measurements from the in vivo trials and digitized
55 micro-CT scans can be found in Table S2. We were
1
2 A
3 4 5 6 7
8 B
9 10 11 12 13 14
15 C
16 17 18 19 20
21 Fig. 8 Stereo images of 3D meshes of right lateral face of micro-computed tomography (CT) scanned ophiuroid vertebrae from (A) Ophioderma 22 brevispina proximal (11th segment), (B) distal (43rd segment), and (C) Ophiothrix angulata (24th segment; YPM 7415). The position of the dorsal 23 ossicle mesh in (C) is tilted as the segment was rotated slightly internally during the micro-CT scan; the dorsal ossicle was flat in scans of O. angu- 24 lata where the arm was straight. Furthest left in row shows vertebral morphology; second to left shows vertebra articulated with non-vertebral 25 ossicles. See Table S1 for scan and rendering details. Meshes visualized and imaged using Autodesk Maya.
26
27 between the O. brevispina and O. angulata specimens
28 during lateral flexion of the proximal arm region, but
29 not during dorsal flexion of the same region.
30
31 Dorsal flexion in Ophioderma brevispina
32
33 Proximal vertebral ossicles
34 In the digital model of articulated vertebrae from the
35 proximal half of the arm, the joint center for dorsal
36 flexion was located on the ventral half of the median
37 saddle on the distal face of the ossicle. During dorsal
38 flexion, the vertebra swung out from the median pro-
39 cess of the distal face of the adjacent vertebra and
40 rotated towards the aboral process (Figs 2 and 11A). The
41 distal vertebra appeared to maintain contact with por-
42 tions of the median saddle, the ventral ridge of the
43 aboral process and the dorsal side of the median process
44 during flexion, while contact was lost between the med-
45 ian socket and the distal portion of the median process
46 (Figs 2 and 11A).
47
48 Distal vertebral ossicles
49 In the digital model of articulated vertebrae from the distal
50 half of the arm, the pattern of flexion was similar to that in
51 the proximal portion of the arm. The joint center was
52 located along the dorsal half of the median saddle, which
53 was positioned slightly more dorsally than in the vertebrae
54 in the proximal portion of the arm (Fig. 11B). The aboral
55 process of the proximal face of the distal ossicle seemed to
roll more fully over the surface of the aboral process of the proximal ossicle than in the model of the proximal part of the arm.
Non-vertebral ossicles
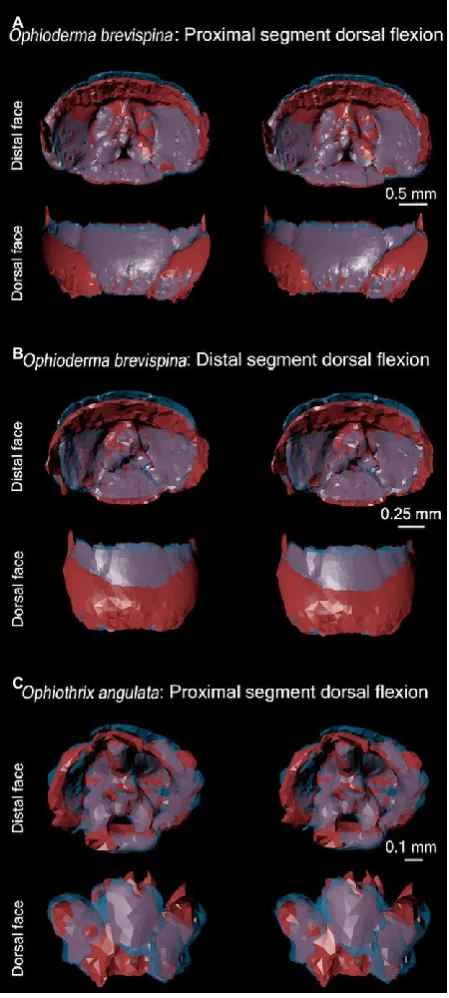
In the proximal half of the arm, the distal end of the dorsal ossicle was lifted dorsally when the segment rotated (Fig. 12A), allowing the next segment to be rotated in turn. The lateral and ventral ossicles appeared to be rotated slightly dorsally as well (Fig. 12A). The distal non-vertebral ossicles behaved in a similar way to those in the proximal half of the arm (Fig. 12B).
Lateral flexion in Ophioderma brevispina
Proximal vertebral ossicles
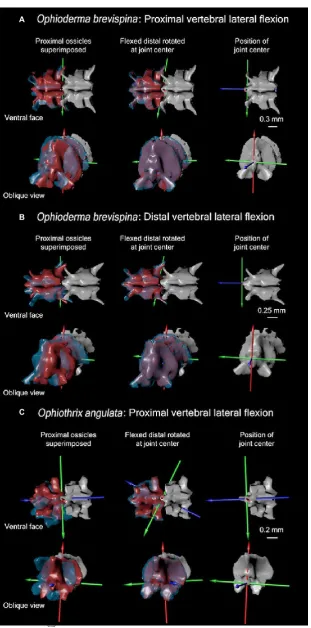
In the digital model of articulated vertebrae from the proximal half of the arm, the joint center was located on a line passing through the median process and the bilateral plane of symmetry. The oral process/median socket glided over the median process of the adjacent vertebra. The aboral processes on the opposing faces rocked over each other about the median saddle (Figs 2 and 13A).
Distal vertebral ossicles
1 2 3 4 5 6 7 8 9 10 11 12 13 14 15 16 17 18 19 20 21 22 23 24 25 26 27 28 29 30 31 32 33 34 35 36 37 38 39 40 41 42 43 44 45
46 bilateral plane of symmetry. The distal face slid over the
47 median saddle and rolled over the aboral process of the
48 proximal face. The dorsal surface of the median socket
49 glided over the dorsal surface of the median process
50 (Fig. 13B).
51
52 Non-vertebral ossicles
53 The lateral ossicles rotated farther in the direction of flexion
54 than the vertebral ossicle in the models of both the
55 proximal and distal halves of the arm (Fig. 14A,B).
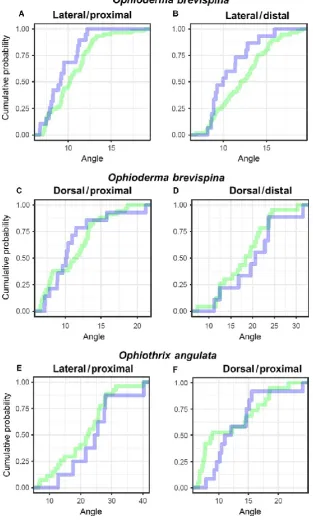
Fig. 9 Comparison of the range of motion observed in vivo and in the micro-computed tomography (CT) scan. (A–F) Cumulative density functions of joint angles formed during CT scans (blue) and in vivo assays (green). In all cases, we are unable to reject the hypothesis that both samples are drawn from the same distribution (P = 0.15, 0.12, 0.32, 0.79, 0.73 and 0.08 for A–F, respectively).
Dorsal flexion in Ophiothrix angulata
Vertebral ossicles
1 A 2
3 4
O. angulata
5 6 7 8
9 O. brevispina
10 11 12
Dorsal flexion of proximal arm region, P = 0.38 B
O. angulata
O. brevispina
Lateral flexion of proximal arm region, P = 1.15 × 10⁻¹¹
13 10 15 20 10 20 30 40
14
C
15 16 17
Distal
18 19 20 21 22
Proximal
23 24 25
Dorsal flexion in O. brevispina, P = 2.25 × 10⁻⁹ D
Distal
Proximal
Lateral flexion in O. brevispina, P = 1.21 × 10⁻⁴
26 10 20 30 10 15
27 Angles
28
Angles
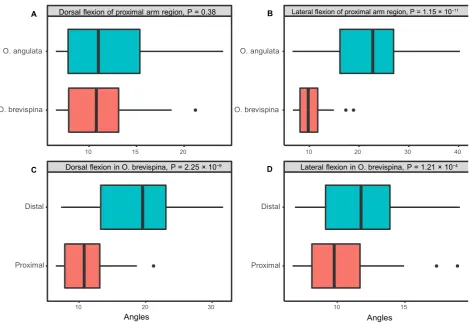
29 Fig. 10 Comparison of the angles formed between segments during arm flexion between species and arm regions. Values are pooled from angles taken from in vivo photographs and micro-computed tomography (CT) scans. Angles formed by the proximal part of the arms of Ophiothrix angu- 30 lata and Ophioderma brevispina were significantly different during lateral flexion (B), but not during dorsal flexion (A). Differences were also signif- 31 icant for the proximal and distal parts of the arm during both lateral and dorsal flexion in O. brevispina (C,D). P-values are reported in the figure. 32 See Table S2 for angle measurements.
33
34 the ventral area of the median saddle/aboral process on the 35 distal face. Although this joint center was more dorsal in 36 position on the articular facet than that in O. brevispina, 37 the articular facet was more ventral in O. angulata, the 38 median saddle was located deeper and the median process 39 was more pronounced so the ossicle did not appear to 40 swing away from the ventral half of the adjacent ossicle 41 during dorsal flexion (Fig. 11C).
42
43 Non-vertebral ossicles
44 The position of the lateral and ventral ossicles remained rel- 45 atively constant in the straight to flexed positions. The dor- 46 sal ossicle appeared to be raised towards the distal face of 47 the vertebral ossicle presumably to accommodate the artic- 48 ulation, as it slightly overlapped the next ossicle; however, 49 the thickness of this ossicle approached the size limits of the 50 extraction software (Fig. 12C).
51
Lateral flexion in Ophiothrix angulata
52
53 Vertebral ossicles
54 In the digital model of articulated vertebrae from the proxi-
55 mal half of the arm, the joint center was located along a
line bisecting the center of the median process on the distal face and the bilateral line of symmetry dividing the ossicle. The median socket on the proximal face of the vertebra slid over the aboral process on the adjacent vertebra, and the dorsal part of the oral process slid over the median saddle. The proximal aboral process rolled over the distal process (Figs 2 and 13C). In near maximal flexion, the median socket was observed to rotate away from the median process, maintaining contact on the right side alone.
Non-vertebral ossicles
The lateral ossicles rotated in the same direction as the arm (Fig. 14C): when the vertebral ossicles rotated, the lateral ossicles rotated even further. This allowed the lateral ossicle on the concave side to fit between its neighboring vertebral ossicle and the lateral ossicle of the adjacent segment (Fig. 14C).
Discussion
1
2 A
3 4 5 6 7 8 9 10 11 12 13 14 15 16
17 B
18 19 20 21 22 23 24 25 26 27 28 29 30 31
C 32
33 34 35 36 37 38 39 40 41 42 43 44 45 46 47 48
49 and Early Devonian fossil ophiuroids of South Africa (Reid 50 et al. 2015). The present study, however, is the first to use 51 digital models based on micro-CT scans for mobility analysis 52 of the brittle star skeleton. This technique has high utility as 53 a non-destructive tool for imaging internal ophiuroid anat- 54 omy for two main reasons. (i) micro-CT imaging makes it 55 possible to view whole ossicles in 360 ° without damage.
Fig. 11 Comparison of orientation of ‘flexed distal’ (blue) and ‘straight distal’ (red) vertebral meshes in left lateral and oblique views during experiment in which arm is flexed dorsally. The first column shows the original orientation of flexed distal and straight distal relative to superimposed proximal vertebra. The second column shows the degree of overlap obtained once rotated at hypothesized joint center. The third column shows the point of hypothesized joint center on distal surface of ‘flexed proximal’. Ossicles are 3D meshes of micro-computed tomography (CT) scanned ophiuroid arms (see Table S1 for scan details) visualized using Autodesk Maya.
1
A 2
3 4 5 6 7 8 9 10 11 12 13 14
15 B
16 17 18 19 20 21 22 23 24 25 26 27 28
29 C
30 31 32 33 34 35 36 37 38 39 40 41 42 43
44 Fig. 12 Assessment of the shift in position of the dorsal, ventral and 45 lateral ossicles relative to the vertebra during dorsal flexion. Whole 46 segments from the ‘flexed distal’ (in blue) and ‘straight distal’ (in red; 47 see Fig. 4A) vertebral meshes were extracted as watertight polygonal meshes from their respective micro-computed tomography (CT) scans. 48 The vertebral meshes were superimposed to compare the relative posi- 49 tion of the four non-vertebral arm ossicles. 3D meshes are micro-CT 50 scanned ophiuroid arm segments (see Table S1 for scan details) visual- 51 ized using Autodesk Maya. Presented as stereo images.
52
53 calcified ossicles are tightly articulated and immersed in soft
54 tissues so the articulations both within and between seg-
55 ments can only be observed in full with 3D digitization.
Micro-CT scanning allows for the virtual removal of soft tis- sues while the positions of the ossicles, as articulated in life, are maintained. This technique allowed us to view individ- ual ossicles and their articulations in vivo in 360 °. Our digital models suggest that, during dorsal flexion, the intervertebral joint center lies on the articular facet dor- sally to the median process in both the specimen of O. bre- vispina (Group I) and that of O. angulata (Group II). The articular surface is more ventral and more deeply recessed in the O. angulata specimen than in the O. brevispina speci- men. In the proximal portion of the arm of the O. angulata (Group II) specimen, the joint center is more deeply recessed than in that of O. brevispina (Group I), correlating with the relative positions of the articular surfaces. Within the articu- lar surface, the joint center is more dorsal in position in the O. angulata specimen than in the O. brevispina specimen. During lateral flexion, the joint center is located within the median process in both the specimens of O. angulata and O. brevispina. We observed that the median socket pivoted away from the median process during maximal lateral flex- ion observed in the O. angulata specimen, extending the range of motion; however, we could not attribute this dif- ference in function to any specific feature. Additional taxa will need to be examined to determine the range of taxa capable of this extended motion and to identify the factors responsible for this interesting aspect of lateral flexion in ophiuroids.
1
2 A
3 4 5 6 7 8 9 10 11 12 13 14 15 16 17
18 B
19 20 21 22 23 24 25 26 27 28 29 30 31 32 33 34
35 C
36 37 38 39 40 41 42 43 44 45 46 47 48 49 50 51 52 53 54 55
Fig. 13 Comparison of orientation of ‘flexed distal’ (blue) and ‘straight distal’ (red) vertebral meshes in ventral and oblique views during experiment in which arm is flexed laterally. The first column shows the original orientation of flexed distal and straight distal relative to superimposed proximal vertebra. The second column shows the degree of overlap obtained once rotated at
hypothesized joint center. The third column shows the point of hypothesized joint center on distal surface of ‘flexed proximal’. Ossicles are 3D meshes of micro-computed
1
A 2
3 4 5 6 7 8 9 10 11 12 13 14 15
16 B
17 18 19 20 21 22 23 24 25 26 27 28 29
30 C
31 32 33 34 35 36 37 38 39 40 41 42 43
44 Fig. 14 Assessment of the shift in position of the dorsal, ventral and 45 lateral ossicles relative to the vertebra during lateral flexion. Whole 46 segments from the ‘flexed distal’ (in blue) and ‘straight distal’ (in red;
see Fig. 4A) vertebral meshes were extracted as watertight polygonal 47 meshes from their respective micro-computed tomography (CT) scans. 48 The vertebral meshes were superimposed to compare the relative posi- 49 tion of the four non-vertebral arm ossicles. 3D meshes are micro-CT 50 scanned ophiuroid arm segments (see Table S1 for scan details) visual- 51 ized using Autodesk Maya. Presented as stereo images.
52
53 species are known to be predators, scavengers and deposit
54 feeders, while Ophiothrix species are known as primarily
55 suspension feeders (Warner, 1982); future work will explore
the wider relationship between form and function in taxa with drastically different ecologies and day-to-day move- ment needs.
LeClair (1996) suggested that ‘keeled vertebral ossicles are derived relative to non-keeled forms’ (i.e. Group II morphology is derived relative to Group I), based on the presence of non-keeled vertebrae at the base of the arms in keeled species. Our ancestral state reconstruction confirmed that the non-keeled state represents the ancestral condition for ophiuroids, but also revealed that the keeled state is likely to have evolved convergently in two clades (Fig. 15).
The area of the articular surfaces is smaller relative to the surface area of the muscle attachment sites in vertebrae in the proximal vs. the distal portion of the arm of O. bre- vispina (LeClair, 1996); thus, Hendler & Miller’s (1991) hypothesis predicts greater mobility in the proximal part of the arm. However, we found that the angles created by suc- cessive vertebrae during arm flexion were significantly smal- ler in the proximal arm region than in the distal one in the specimen we analyzed (Fig. 10). This seems to be related to the disparate morphologies of proximal and distal arm seg- ments: the joint center during dorsal flexion of vertebrae in the proximal portion of the arm lies in a more ventral posi- tion on the joint interface than in those distal (represented by the tricolored axes in Fig. 11A,B). In the model con- structed, the rounder, more prominent articular surface on the distal face of vertebrae in the distal portion of the arm allows the joint interface to roll over the aboral process, whereas the more flattened distal face in the proximal por- tion limits flexion from the joint center. During lateral flex- ion, the joint center for both the proximal and distal portions of the arm bisected the median process. Our obser- vations do not support the hypothesis of Hendler & Miller (1991), as we found that a reduced articular surface decreases mobility. Analysis of additional specimens of this taxon is required to determine how widely this conclusion applies.
16 Models reveal mobility in ophiuroid arms, E. G. Clark et al.
1 2 3 4 5 6 7 8 9 10 11 12 13 14 15 16 17 18 19 20 21 22 23 24 25
Fig. 15 Ancestral state reconstruction of the evolutionary history of ophiuroid vertebral morphologies. The topology employed corresponded to 26 that of O’Hara et al. (2017), with terminals pruned to the set of taxa coded by LeClair (1996) as having either non-keeled (Group I) or keeled 27 (Group II) vertebrae. Results suggest that the non-keeled vertebral morphology was present in the most recent common ancestors of Ophiuroidea, 28 Ophintegrida (C) and the two major clades represented in our study, Amphilepidida (A) and Ophiacanthida (B). Furthermore, the keeled morphol- 29 ogy evolved convergently at least twice within the Amphilepidida (A).
30
31 driven by the diameter and joint density along its length, as
32 well as the ossicle morphology described.
33 The presence of non-vertebral arm plates might appear
34 to inhibit flexion of the arm (Litvinova, 1994); our observa-
35 tions show, however, that the dorsal and lateral arm plates
36 rotate to accommodate the changing positions of the adja-
37 cent segment during dorsal and lateral flexion, projecting
38 further in the direction of flexion than the vertebral ossicle
39 itself. Although further work is needed to determine the
40 limits on the range of ophiuroid arm motion, as well as the
41 pervasiveness of this behavior in non-vertebral plates
42 throughout ophiuroids, our models do not support the
43 hypothesis that non-vertebral arm plates are the limiting
44 factor hindering flexion.
45
46
Implications
47
48 Using 3D digital modeling of ophiuroid arms built with
49 micro-CT scan data, we identified the joint center and docu-
50 mented arm mobility in four specimens in order to build a
51 framework for relating morphology to range of motion.
52 Several aspects of our findings challenge longstanding
53 hypotheses about ophiuroid arm mobility that were based
54 on vertebral and arm segment morphology, and future
55 work will expand the dataset from the two taxa examined
to investigate broad-scale patterns in the relationship between arm form and function within ophiuroids. Our results suggest that observations of ophiuroid arm mor- phology from isolated ossicles alone may not be sufficient for estimating functional capabilities, because the relation- ship between form and function among the many parts of the arm can be more complex than is easily predicted based on any single component. Further comparisons between other Group I and II species using the methods described here are required to determine the prevalence of our findings.
The morphology of lateral arm plates has been docu- mented in terms of inter- and intra-specific disparity and relative differences along the length of the arm (Thuy & Sto€hr, 2011). The functional implications of disparity in lat- eral arm plate morphology, and within dorsal and oral arm ossicles, could be analyzed by modifying the methods used in this study.
Models reveal mobility in ophiuroid arms, E. G. Clark et al. 17
1 feeding and reproduction. Thus, drawing ecological infer-
2 ences regarding Paleozoic taxa is contingent on under-
3 standing the mechanical abilities of their arms. It has been
4 hypothesized that some taxa utilized tube feet for locomo-
5 tion, as do modern asteroids (Glass & Blake, 2004). Deter-
6 mining the locomotion strategy of stem-group Paleozoic
7 ophiuroids using the methods described herein is crucial to
8 infer how the agile muscular-driven locomotion strategy of
9 modern ophiuroids evolved.
10 This study lays the groundwork for understanding the
11 relationship between ossicle form and function in brittle
12 stars, and creates a framework for the analysis of move-
13 ment in invertebrate groups outside the Ophiuroidea.
14 Our results show that 3D digital models of articulated
15 skeletal structures can reveal important information
16 about echinoderm mobility. Thus, this method has the
17 potential to yield important insights into the biomechan-
18 ics of stem-group echinoderms, such as stylophorans
19 (Lefebvre, 2003), shedding critical insight into the
20 evolutionary history of deuterostome movement and
21 locomotion.
22 23
24
Acknowledgements
25 The authors thank Rachel Racicot and Brandt Gibson (Vanderbilt 26 University) for assistance setting up and carrying out experi- 27 ments; the Structure and Motion Laboratory (Royal Veterinary 28 College) and Steve Gatesy (Brown University) for valuable scien- 29 tific discussions; Anjan Bhullar, the Bhullar Lab, Holger Peter- 30 mann and the Briggs Lab (Yale University) for VG Studio 31 support and scientific input; Aurora Krom (Duke University) for scientific input; Gulf Specimen Ordering and Yale Peabody 32 Museum Division of Invertebrate Zoology for access to speci- 33 mens; and the reviewers for their constructive feedback. Funding 34 was provided by the Yale Peabody Museum Invertebrate Paleon- 35 tology Division, the Yale University Department of Geology and 36 Geophysics, the George Schulz Fellowship, and the Pierson Col- 37 lege Richter Fellowship. There are no conflicts of interest. 38
39
Author contributions
40
41 J.R.H. and E.G.C. designed the experiments. E.G.C. and 42 S.A.F.D. performed the micro-CT scans and reconstructions. 43 N.M.K. conducted the statistical analyses. N.M.K. and E.G.C. 44 conducted the ancestral state reconstruction. T.R.B. and 45 S.A.S. identified structures of interest and segmented the 46 micro-CT data with input from E.G.C. E.G.C. extracted the 47 3D structures and created the Maya models. E.G.C., J.R.H. 48 and D.E.G.B. interpreted the results and prepared the 49 manuscript with scientific and editorial input from the 50 other authors.
51
52
References
53
54 Alexander RM (1992a) Exploring Biomechanics: Animals in 55 Motion. New York: Scientific American Library.
Alexander RM (ed.) (1992b) Comparative and Environmental Physi- ology 11: Mechanics of Animal Locomotion. Berlin: Springer. Alexander RM (2003) Principles of Animal Locomotion. Prince-
ton: Princeton University Press.
Arafa S, Sadok S, El Abed A (2007) Assessment of magnesium chloride as an anaesthetic for adult sea urchins (Paracentrotus lividus): incidence on mortality and spawning. Aquac Res 38, 1673–1678.
Arshavskii YI, Kashin SM, Litvinova NM, et al. (1976a) Coordina- tion of arm movement during locomotion in ophiurans. Neu- rophysiology 8, 404–410.
Arshavskii YI, Kashin SM, Litvinova NM, et al. (1976b) Types of locomotion in ophiurans. Neurophysiology 8, 398–404. Astley HC (2012) Getting around when you’re round: quantita-
tive analysis of the locomotion of the blunt-spined brittle star, Ophiocoma echinata. J Exp Biol 215, 1923–1929.
Barbaglio A, Tricarico S, Ribeiro A, et al. (2012) The mechani- cally adaptive connective tissue of echinoderms: its potential for bio-innovation in applied technology and ecology. Mar Environ Res 76, 108–113.
Barbaglio A, Tricario S, Di Benedetto C, et al. (2013) The smart connective tissue of echinoderms: a materializing promise for biotech applications. Cah Biol Mar 54, 713–720.
Baumiller TK, Messing CG (2007) Stalked crinoid locomotion, and its ecological and evolutionary implications. Palaeontolo- gia Electronica 10, 1–10.
Bels VL, Gasc J-P, Casinos A (eds) (2003) Vertebrate Biomechan- ics and Evolution. Oxford: BIOS Scientific Publishers.
Bisby FA, Roskov Y, Orrell T, et al. ((2010) Species 2000 & ITIS Catalogue of Life: 2010 Annual Checklist. Digital resource at http://www.catalogueoflife.org/annual-checklist/2010. Species 2000: Reading, UK.
Brusca RC, Brusca GJ (1990) Invertebrates, 2nd edn. Sunderland: Sinauer Associates.
Byrne M (1994) Ophiuroidea. In: Microscopic Anatomy of the Invertebrates, Vol. 14. (eds Harrison FW, Chia F-S), pp. 247– 343. New York: Wiley-Liss.
Candia Carnevali MD, Burighel P (2010) Regeneration in echino- derms and ascidians. In: Encyclopedia of Life Sciences (ELS). (ed. ???? ????), pp. ????–????. Chicester: John Wiley.
Clark EG, Bhullar B-AS, Darroch SAF, et al. (2017) Water vascular system architecture in an Ordovician ophiuroid. Biol Let 13, 1–5. Conover WJ (1971) Practical Nonparametric Statistics. New York:
Wiley.
Deheyn D, Alva V, Jangoux M (1996) Fine structure of the pho- togenous areas in the bioluminescent ophiuroid Amphipholis squamata (Echinodermata, Ophiuridea). Zoomorphology 116, 195–204.
Deheyn D, Mallefet J, Jangoux M (2000) Cytological changes during bioluminescence production in dissociated photocytes from the ophiuroid Amphipholis squamata (Echinodermata). Cell Tissue Res 299, 115–128.
Domenici P, Gonza'lez-Caldero'n D, Ferrari RS (2003) Locomotor performance in the sea urchin Paracentrotus lividus. J Mar Biol Assoc UK 83, 285–292.
Dupont S, Thorndyke M (2007) Bridging the regeneration gap: insights from echinoderm models. Nat Rev Genet 8,
Edgecombe GD, Giribet G, Dunn CW, et al. (2011) Higher-level metazoan relationships: recent progress and remaining ques- tions. Organ Divers Evol 11, 151–172.
1 of the International Conference, Tampa Bay. (ed. Lawrence 2 JM), pp. 11–18. Rotterdam: A. A. Balkema.
3 Etnier SA (2001) Flexural and torsional stiffness in multi-jointed 4 biological beams. Biol Bull 200, 1–8.
Gatesy SM, Baier DB, Jenkins FA, et al. (2010) Scientific roto- 5 scoping: a morphology-based method of 3-D motion analysis 6 and visualization. J Exp Zool 313A, 244–261.
7 Gebruk A (1995) Locomotory organs in the elasipodid holothuri- 8 ans: functional-morphological and evolutionary approaches. 9 In: Echinoderm Research 1995. (eds Emson RH, Smith AB, 10 Campbell AC), pp. 95–102. Rotterdam: A. A. Balkema. 11 Glass A, Blake DB (2004) Preservation of tube feet in an ophi-
uroid (Echinodermata) from the Lower Devonian Hunsru€ck 12 Slate of Germany and a redescription of Bundenbachia bene- 13 ckei and Palaeophiomyxa grandis. Pala€ontologische Zeitschrift 14 78, 73–95.
15 Glynn PW (1965) Active movements and other aspects of the 16 biology of Astichopus and Leptosynapta (Holothuroidea). Biol 17 Bull 129, 106–127.
18 Green DW, Ben-Nissan B, Yoon K-S, et al. (2016) Bioinspired materials for regenerative medicine: going beyond the human 19 archetypes. J Mater Chem B 4, 2396–2406.
20 Halanych KM (2004) The new view of animal phylogeny. Annu 21 Rev Ecol Evol Syst 35, 229–256.
22 Hansen B (1972) Photographic evidence of a unique type of 23 walking in deep-sea holothurians. Deep-Sea Res 19, 461–462. 24 Hendler G, Miller JE (1991) Swimming ophiuroids – real and 25 imagined. In: Biology of Echinodermata, Proceedings of the Seventh International Echinoderm Conference. (eds Yanagi- 26 sawa T, Yasumasu I, Oguro C, Suzuki N, Motokawa T), pp. 27 179–190. Rotterdam: A.A. Balkema.
28 Hyman LH (1955) The Invertebrates: Echinodermata, Vol. IV. 29 New York: McGraw-Hill.
30 Kano T, Suzuki S, Watanabe W, et al. (2012) Ophiuroid robot 31 that self-organizes periodic and non-periodic arm movements. 32 Bioinspir Biomim 7, 1–8.
Kano T, Sato E, Ono T, et al. (2017) A brittle star-like robot cap- 33 able of immediately adapting to unexpected physical damage. 34 Royal Soc Open Sci 4, 1–14.
35 Kerkut GA (1953) The forces exerted by the tube feet of the 36 starfish during locomotion. J Exp Biol 30, 575–583.
37 Lake JA (1990) Origin of the Metazoa. PNAS 87, 763–766. 38 Lal SP, Yamada K, Endo S (2008) Emergent motion characteristics 39 of a modular robot through genetic algorithm. In: Advanced Intelligent Computing Theories and Applications. 4th Interna- 40 tional Conference on Intelligent Computing. (eds Huang D-S, 41 Wunsch DC, Levine DS, Jo K-H), pp. 225–234. Berlin: Springer. 42 Landschoff J, Plessis AD, Griffiths CL (2015) A dataset describing 43 brooding in three species of South African brittle stars, com- 44 prising seven high-resolution, micro X-ray computed tomogra- 45 phy scans. GigaScience 4, 1–3.
46 Leach DH, Dagg AI (1983) A review of research on equine loco- motion and biomechanics. Equine Vet J 15, 93–102.
47 LeClair EE (1994) Quantitative morphological variation in the 48 vertebral ossicles of the Ophiurae (Ophiuroidea). In: Echino- 49 derms Through Time: Proceedings of the Eighth International 50 Echinoderm Conference. (eds David B, Guille A, Fe'ral J-P, Roux 51 M), pp. 443–448. Rotterdam: A. A. Balkema.
52 LeClair EE (1996) Arm joint articulations in the ophiuran brit- 53 tlestars (Echinodermata: Ophiuroidea): a morphometric analy-
sis of ontogenetic, serial, and interspecific variation. J Zool 54 240, 245–275.
55
LeClair EE, LaBarbera MC (1997) An in vivo comparative study of intersegmental flexibility in the ophiuroid arm. The Biological Bulletin 193, 77–89.
Lefebvre B (2003) Functional morphology of stylophoran echin- oderms. Palaeontology 46, 511–555.
Litvinova NM (1994) The life forms of ophiuroidea (based on the morphological structures of their arms). In: Echinoderms through Time: Proceedings of the Eight International Echino- derm Conference. (eds David B, Guille A, Fe'ral J-P, Roux M), pp. 449–454. Rotterdam: A. A. Balkema.
Mao S, Dong E, Jin H, et al. (2014) Gait study and pattern gen- eration of a starfish-like soft robot with flexible rays actuated by SMAs. J Bionic Eng 11, 400–411.
Massey FJ Jr (1951) The Kolmogorov-Smirnov Test for Goodness of Fit. J Am Stat Assoc 46, 68–78.
Matsuzaka Y, Sato E, Kano T, et al. (2017) Non-centralized and functionally localized nervous system of ophiuroids: evi- dence from topical anesthetic experiments. Biol Open 6, 425–438.
Moore AR (1924) The nervous mechanism of coordination in the crinoid, Antedon rosaceus. J Gen Physiol 6, 281–288.
Nicolas G, Multon F, Berillon G, et al. (2007) From bone to plau- sible bipedal locomotion using inverse kinematics. J Biomech 40, 1048–1057.
O’Hara TD, Hugall AF, Thuy B, et al. (2014) Phylogenomic reso- lution of the Class Ophiuroidea unlocks a global microfossil record. Curr Biol 24, 1874–1879.
O’Hara TD, Hugall AF, Thuy B, et al. (2017) Restructuring higher taxonomy using broad-scale phylogenomics: the living Ophi- uroidea. Mol Phylogenet Evol 107, 415–430.
Ohta S (1985) Photographic observations of the swimming behavior of the deep-sea pelagothuriid holothurian Enypni- astes (Elasipoda, Holothurioidea). J Oceanogr Soc Jpn 41, 121– 133.
Otero A, Allen V, Pol D, et al. (2017) Forelimb muscle and joint actions in Archosauria: insights from Crocodylus johnstoni (Pseudosuchia) and Mussaurus patagonicus (Sauropodomor- pha). PeerJ 5, e3976.
Pawson DL (2007) Phylum Echinodermata. Zootaxa 1668, 749– 764.
R Core Team (2017) R: A language and environment for statisti- cal computing. R Foundation for Statistical Computing, Vienna, Austria. URL https://www.R-project.org/
Reid M, Bordy EM, Taylor W (2015) Taphonomy and sedimentol- ogy of an echinoderm obrution bed in the Lower Devonian Voorstehoek formation (Bokkeveld Group, Cape Supergroup) of South Africa. J Afr Earth Sc 110, 135–149.
Say T (1825) On the species of the Linnaean genus Asterias inhabiting the coast of the U.S. J Acad Nat Sci Phil 5, 141–154. Shaw GD, Fontaine AR (1990) The locomotion of the comatulid Florometra serratissima (Echinodermata: Crinoidea) and its adaptive significance. Can J Zool 68, 942–950.
Smith JE (1947) The activities of the tube feet of Asterias rubens L. I. The mechanics of movement and of posture. J Cell Sci 88, 1–14.
Sto€hr S (2012) Ophiuroid (Echinodermata) systematics – where do we come from, where do we stand and where should we go? Zoosymposia 7, 147–161.
Sto€hr S, O’Hara TD, Thuy B (2012) Global diversity of brittle stars (Echinodermata: Ophiuroidea). PLoS ONE 7, 3.