Impacts of feeding system and season on milk composition and Cheddar cheese yield in a subtropical environment
8
0
0
Full text
(2) 300. Australian Journal of Experimental Agriculture. One reason for developing such strategies is to improve the suitability of the milk for cheesemaking. The study reported in this paper was part of a broader research program examining various strategies in intensive dairy production systems with the objectives of increasing profitability and labour efficiency (Andrews et al. 2002). It compared the milk produced by cows on 2 different subtropical dairy feeding systems for composition, processability and Cheddar cheese yield efficiency. A small-scale experimental cheesemaking plant was developed for the cheese trials. Materials and methods Small-scale cheesemaking plant A small-scale cheesemaking plant consisting of two 30-L capacity cheese vats was built inside a 225-L capacity stainless steel cheese vat. Electric motor driven agitators equipped with stainless steel blades were positioned on each side of the main vat to provide continuous agitation of the cheesemilk during cheesemaking. Temperature was controlled by directly injecting steam or cold water as required into water contained in the main vat. Cheesemaking Milk standardisation On arrival in the laboratory, milk for cheesemaking was subsampled and analysed for fat and protein to enable standardisation of the milk. On each cheesemaking day, 10 L of the bulk whole milk was warmed to 50◦ C and skimmed with a cream separator, for use in standardising the cheesemilk. Cheesemilk was standardised to a casein : fat ratio of 0.7 by altering the fat content through addition of cream or skim milk as required. Following standardisation, the milk was batch-pasteurised at 63◦ C for 30 min, cooled to 32◦ C and weighed into the 2 vats (20 kg in each). Starter preparation A commercial freeze-dried DVS starter (O-Culture R-704 pHage Control, Mesophilic Homofermentative Culture, type O. CHR Hansen A/S, Denmark) was inoculated into the sterile skim milk according to the manufacturer’s specification at a rate of 0.7 g per 200 mL sterile skim milk for the first dilution (mother culture). Ten mL of the diluted culture was inoculated into 1 L of sterile skim milk (bulk culture) and incubated at 22◦ C for 16 h. For consistency within each cheesemaking day, a single container of mother culture made from the same frozen starter concentrate and similar sterile skim milk were used. Bulk culture (400 mL) was added to the cheesemilk in each vat. After agitation for 5 min, rennet was added. Rennet addition and curd formation time Commercial rennet (Naturen, CHR Hansen; Hørsholm, Denmark) consisting of 80% (w/w) bovine chymosin and 20% pepsin with a rennet strength of 1200 international milk clotting units/g of coagulant was used. Two mL of rennet mixed with 40 mL distilled water was added to each vat containing 20 kg cheesemilk. Curd formation time (CFT), the time from addition of rennet to cutting of the curd, was determined by observation and was established as about twice the gel formation or rennet coagulation time (RCT), the time from rennet addition to the first increase in viscosity of the rennetted milk. Cheesemaking was performed as described by Mayes and Sutherland (1984). Sampling and analysis Fat was analysed using the Babcock standard procedure and protein by formol titration (Pearson 1991). Casein percentage was determined by multiplying the total protein value with 0.833 (Scott 1986). Milk samples for compositional analysis were preserved with 0.04% bronopol. They were analysed for total solids, fat, lactose,. B. Amenu et al.. total nitrogen (N), non protein N, calcium, phosphorus, total ash, total casein, αs1 -casein, αs2 -casein, β-casein and κ-casein. Gross compositional analyses were performed according to the procedures described in Standards Association of Australia (1998). Individual casein components, αs1 -, αs2 -, β- and κ-casein, were determined using reversed-phase high-performance liquid chromatography (HPLC) (Visser et al. 1991). Nitrogen content was converted to protein content using the factor 6.38 for total protein and casein (Karman and van Boekel 1986). Cheese and cheese whey sampling, sample preparation and handling followed the procedures described in AOAC (1990) and Kosikowski (1977). Cheese fat was analysed by the Babcock procedure, total N was analysed by the Kjeldahl method and peptides soluble in 12% trichloroacetic acid (TCA) in cheese were analysed by the method of Everett and Jameson (1993) using HPLC. Total solids in cheese whey and cheese samples were determined from the moisture content obtained using a HR73 Halogen Moisture Analyzer Meter (Toledo GmbH 1999, Switzerland). Cheese pH was determined according to Broome et al. (1998) in a slurry made from a 1 : 1 mixture of grated cheese and water (40◦ C) by inserting pH meter electrode (85 ion analyzer; Radiometer Pacific, Burwood 3125, Australia). Samples were tested in duplicate. Acidity was determined by titration of 10 mL of slurry with 0.1 mol/L NaOH solutions; the acidity, expressed as percent lactic acid, was calculated as the number of mL of alkali used divided by 10. Cheese yield Cheese yield for each vat was determined as the weight of cheese after pressing, expressed on the basis of 100 kg of milk. The percentage recoveries of fat and protein in cheese and whey were calculated. Total weights of whey collected during draining, cheddaring, salting and pressing were used in the mass balance calculations. Theoretical and adjusted cheese yields were calculated using the modified Van Slyke and Publow formula (Mistry et al. 2002): Theoretical Cheddar cheese yield = [(F × Rf + C − 0.1) × 1.016]/ 1 − SC − M/(1 − WS) where F is percent fat in milk, Rf is percent of fat in milk recovered in cheese/100, C is percent casein in milk, SC is percent salt in cheese/100, M is percent moisture in cheese/100, WS is percent solids in whey/100. Targeted cheese composition for this calculation is indicated below. Cheese yield was adjusted for moisture and salt, casein and fat, and fat recovery as follows: Yadj = Yact × TYadj /TYact where Yadj is adjusted yield, Yact is actual yield, TYact is theoretical yield where actual values are used, and TYadj is theoretical yield where only the components to be adjusted are changed to target values. Target values were experimental means: 4.4% fat in milk, 2.7% casein in milk, 36.7% moisture in cheese, 1.7% salt in cheese, 88% fat recovery, and 6.8% whey solids. Repeatability of cheesemaking A trial was carried out to determine the repeatability of cheesemaking in the 2 vats of the experimental plant. In order for the plant to be used successfully for comparing milk produced under different conditions, it was imperative that differences between the vats were minimal. Cheese was made on 10 separate days from different milk. On each day, 2 vats of cheese were made simultaneously in the experimental plant from the same milk. The cheesemaking parameters and characteristics of the cheeses made in the 2 vats during the trial were compared statistically. Feeding trial Sixteen pairs of Holstein–Friesian cows were used in a 2 × 2 factorial experiment (2 feeding systems and 2 seasons, autumn and spring) with.
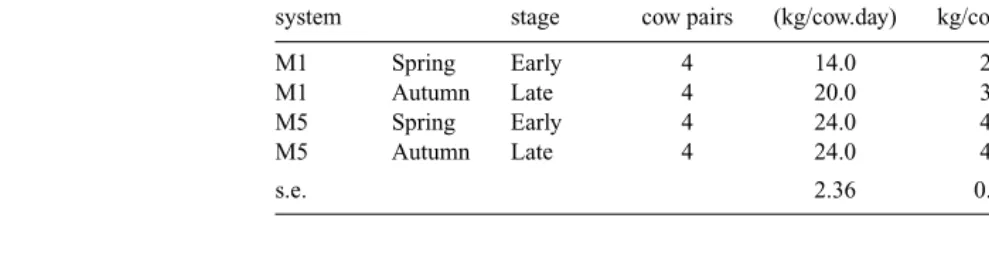
(3) Impacts of feeding system and season on cheese manufacture. Australian Journal of Experimental Agriculture. 4 replicates at Mutdapilly Research Station, south-east Queensland. The tropical pastures system (M1) consisted of 10.24 ha (2.11 ha oats and 8.13 ha Rhodes grass) with a stocking rate of 1.95 cows/ha. Tropical pasture hay and silage were fed as required. The feedlot (M5) consisted of 4.65 ha (2 ha maize/barley and 2.65 ha lucerne), with an estimated stocking rate of 4.12 cows/ha though these cows were not grazing on paddocks. In addition, cows in both systems received concentrate at about 3 t/cow.year. Concentrate was about 70% barley or sorghum grain, with the balance being molasses, whole cotton seed and cottonseed meal. At the time of milk sampling, green pasture in M1 supplied only about 1 kg dry matter (DM)/cow.day as a consequence of drought conditions. The dominant forages used during the trial were silages of forage sorghum and oats for M1 and of maize and lucerne for M5. Total DM, crude protein [(CP) kg/cow.day] and ME (MJ/cow.day) intakes were 17, 2.7, and 187, for M1 and 24, 4, 260 for M5, respectively (Table 1). Cows were blocked on milk yield and protein content, and paired to minimize differences between cows within a pair. Pairs of cows were then blocked on milk yield and protein content into blocks of 4, and randomly allocated to treatments. All cows calved in early spring. Milk samples were collected in spring and autumn from M1 and M5 paired cows on 4 occasions (runs). Milk collected from each cow within a pair were composited daily and thoroughly mixed, then sampled. Milk sampling and analysis, cheesemaking, and cheese and whey sampling and analysis were performed as described above.. 301. Experimental design and statistical analysis The repeatability trial results were analysed as a randomised block with 2 treatments (vats) and 10 replicates (cheesemaking days). Statistical analysis was performed using the 2-way analysis of variance (ANOVA) procedure of SAS Institute (1996). The feeding trial was analysed as a 2 × 2 factorial experiment (2 feeding systems and 2 seasons, autumn and spring) with 4 replicates. Data analysis was performed using SAS version 6.12, using the PROC GLM procedure of SAS Institute (1996).. Results Repeatability trial Over the 10 manufacturing days, there were no significant differences between vats on the same day in cheese yield, cheesemaking parameters (e.g. CFT, cooking and cheddaring temperature, curd pH and acidity) and cheese characteristics, however, there were significant differences in CFT, curd pH, acidity and cheese yield among the days of manufacture. Table 2 summarises the key data from the repeatability trial. Feeding trial Milk yield was greater for M5 than M1 cows, and the difference was greater in autumn than spring (Fig. 1). Yield. Table 1. The daily dry matter (DM), crude protein (CP) and metabolisable energy (ME) intakes of cows in tropical pastures (M1) and feedlot (M5) systems of production Feeding system. Season. Lactation stage. M1 M1 M5 M5. Spring Autumn Spring Autumn. Early Late Early Late. No. of cow pairs. DM intake (kg/cow.day). CP intake kg/cow.day). ME intake (MJ/cow.day). 4 4 4 4. 14.0 20.0 24.0 24.0. 2.4 3.0 4.0 4.0. 154 220 271 250. 2.36. 0.40. 25.5. s.e.. Table 2. Percentage of milk components recovered and cheese yield (kg/100 kg milk) for Cheddar cheese made in duplicate vats in the repeatability trial Values for vat 1 and vat 2 are the means of 10 trials conducted over 10 cheesemaking days. The mean of vats 1 and 2 values (n = 20) is presented and significant differences between means for cheesemaking days is indicated. n.s., not significant Curd formation time (min). Milk components recovered (%)A Cheese. Fat Whey. Total. Cheese. Protein Whey. Total. Cheese yield (kg/100 kg milk) Actual Moisture adjustedC. MassB. Vat 1 Vat 2. 33.50 33.40. 99.25 99.25. 84.01 84.02. 9.22 9.11. 93.23 93.13. 75.70 75.53. 22.56 22.47. 98.26 98.00. 10.44 10.40. 11.11 11.16. s.e. Signif.. 0.165 n.s.. 0.057 n.s.. 0.109 n.s.. 0.085 n.s.. 0.171 n.s.. 0.175 n.s.. 0.176 n.s.. 0.189 n.s.. 0.030 n.s.. 0.114 n.s.. Mean s.e. Signif.. 33.45 0.369 P<0.01. 99.25 0.127 P<0.01. 84.02 0.243 P<0.01. 9.17 0.189 P<0.01. 93.18 0.381 P<0.01. 75.61 0.391 P<0.01. 22.50 0.219 P<0.01. 98.12 0.423 P<0.01. 10.42 0.067 P<0.01. 11.13 0.081 P<0.01. A. Component recovered per kg milk. Weight of cheese + weight of whey as a percent of the total weight of milk. C Moisture was adjusted to 370 g/kg for cheese yield. B.
(4) 302. Australian Journal of Experimental Agriculture. B. Amenu et al.. cheese yields were similar (P>0.05) for the 2 feeding systems, but different for the 2 seasons (P<0.01). Cheese yield was linearly related to the fat plus casein content of milk by the following equation:. 40 c. Milk yield (L/cow.day). 35 30. b. b. 25. Cheese yield = 1.53 ± 0.638 milk fat % + 2.18 ± 0.921 milk casein % − 0.977 ± 1.183 (R2 = 0.66).. a. 20 15 10 5 0 Spring. Autumn. Fig. 1. Mean milk yield (L/cow.day) during spring and autumn for spring calving dairy cows in the M1 feeding system (black bars) and the M5 feeding system (white bars). Vertical bars indicate s.e. Columns with different letters are significantly different (P<0.05).. differences between seasons can be largely attributed to the stage of lactation. The milk composition data are shown in Table 3. Although there were several significant differences between seasons, only the protein and casein contents differed significantly (P<0.01) between the feeding systems. Total solids for autumn milk were higher than for spring milk. Autumn milk contained more casein than spring milk and this was reflected in all casein components (Table 4). Cows on the feedlot (M5) had higher (P<0.05) casein and casein component concentrations than those on the tropical pastures (M1). All casein fractions were reduced during spring. The proportions of casein fractions in total casein were not affected by either feeding system or season. Cheddar cheese yield was higher in autumn. Theoretical yield was very consistent with the actual yield. Feeding system had no significant effect on the actual or theoretical Cheddar cheese yield, or yield efficiency (Table 5). Adjusted. Cheddar cheese moisture and protein contents were higher in autumn than spring (P<0.01), whereas the ratio of moisture to protein was similar for both seasons. Fat contents were similar, whereas MFFS was higher (P<0.01) in autumn than in spring (Table 6). The salt content was higher and pH lower in spring (P<0.01). The 12% TCA-soluble N in 1-day-old Cheddar cheese as a percentage of total N in the cheese was higher (P<0.05) in spring than autumn. However, after a 90-day ripening period, the 12% TCA-soluble N in Cheddar cheese was not significantly different between the 2 seasons. The feeding system used had no significant effect on cheese composition. Discussion The repeatability trial demonstrated the reliability (the coefficient of the multiple correlation value for vats 1 and 2 cheese yields was 0.98) of the experimental cheesemaking methodology and thereby validated its use in the subsequent feeding systems trial. The yields of Cheddar cheese obtained were similar to those reported by Houlihan et al. (2001) for milk from the same region. However, the moisture-adjusted yield (calculated on 370 g moisture/kg) of 11.13 kg/100 L was higher than that reported by Auldist et al. (2001), for cheese made from Friesian milk (10.7 kg/100 L) and lower than the value for Jersey milk (11.9 kg/100 L). Fat recovery in the cheese (84%) was slightly lower than previously reported for several kinds of cheese including Cheddar (85–93%) (Banks and Tamime 1987; Phelan 1981; Posthumus et al. 1964),. Table 3. Effects of feeding system (FS) and season (S) on gross milk composition (%) Total solids. Fat. Spring Autumn. 12.2 13.9. 3.9 4.7. Spring Autumn. 12.7 14.1. s.e.. 0.32. S FS S × FS. Protein. Ca. Pi. Total ash. Tropical pastures (M1) feeding system 2.7 2.6 2.1 3.7 3.5 2.9. 0.11 0.12. 0.08 0.10. 0.70 0.76. 3.8 4.7. Feedlot (M5) feeding system 3.3 3.1 2.5 3.9 3.7 3.0. 0.12 0.12. 0.09 0.10. 0.74 0.74. 0.31. 0.10. 0.07. 0.004. 0.004. 0.016. P<0.01 P<0.01. n.s. n.s.. n.s. n.s.. n.s. n.s.. n.s.. n.s.. n.s.. n.s.. P<0.01 n.s.. P<0.05 n.s.. P<0.01 P<0.01. n.s.. n.s.. n.s.. n.s., not significant.. True protein. 0.11 Significance P<0.01 P<0.01 n.s.. Total casein.
(5) Impacts of feeding system and season on cheese manufacture. Australian Journal of Experimental Agriculture. 303. Table 4. Effects of feeding system (FS) and season (S) on casein and casein fractions. Casein. Concentration in milk (%) αs1 -casein αs2 -casein β-casein. κ-casein. αs1 -casein. Spring Autumn. 2.10 2.90. 0.69 0.89. Tropical pastures (M1) feeding system 0.16 0.95 0.27 0.23 1.25 0.48. Spring Autumn. 2.50 3.04. 0.82 0.95. 0.21 0.23. s.e.. 0.07. 0.03. 0.01. S FS. P<0.01 P<0.01. P<0.01 P<0.05. P<0.01 P<0.01. n.s.. n.s.. P<0.05. S × FS. Feedlot (M5) feeding system 1.18 0.32 1.36 0.50 0.04. 0.02. Significance P<0.01 P<0.01 P<0.01 n.s. n.s.. n.s.. Proportion of total casein (%) αs2 -casein β-casein κ-casein. 33.3 31.3. 7.60 7.90. 45.8 43.9. 13.2 16.8. 32.4 31.3. 8.30 7.70. 46.5 44.7. 12.7 16.3. 0.55. 0.22. 0.58. 0.89. n.s. n.s.. n.s. n.s.. n.s. n.s.. n.s. n.s.. n.s.. n.s.. n.s.. n.s.. n.s., not significant.. Table 5. Effects of feeding system (FS) and season (S) on cheese yield, fat and protein recovery M, moisture in cheese; SC, salt in cheese; C, casein in milk; F, fat in milk; Rf , fat recovery in cheese; n.s. not significant Cheese yield (kg cheese/100 kg milk) ActualA TheoreticalB. M, SC. Adjusted yieldC (%) M, SC, C, F M, SC, C, F, Rf. Yield efficiency (%)E AdjustedD. Milk components recovered (%)F MassG Fat Protein. Spring Autumn. 10.00 12.74. 10.00 12.75. 10.35 12.16. Tropical pastures (M1) feeding system 11.37 11.44 11.44 11.53 11.54 11.55. 100.0 99.92. 96.63 98.53. 86.45 88.52. 70.35 77.27. Spring Autumn. 10.50 12.75. 10.49 12.88. 10.80 12.48. Feedlot (M5) feeding system 11.68 11.47 11.48 11.29 11.36 11.32. 100.09 99.00. 96.87 98.99. 87.25 89.85. 71.60 77.70. 0.323 P<0.05 n.s.. 0.475 P<0.05 n.s.. 0.334 P<0.01 n.s.. 0.407 n.s. n.s.. Significance 0.214 n.s. n.s.. 0.482 n.s. n.s.. 0.253 n.s. n.s.. 0.193 P<0.05 n.s.. 2.464 n.s. n.s.. 3.615 n.s. n.s.. n.s.. n.s.. n.s.. n.s.. n.s.. n.s.. n.s.. n.s.. n.s.. s.e. S FS S × FS. n.s.. Cheese yield (kg) per 20 kg milk × 5. Calculated values using modified Van Slyke and Publow yield equation (Mistry et al. 2002): [(F × Rf + C – 0.1) × 1.016]/ 1 – SC – M/(1 – WS). C Yield was adjusted for following components using the target values specified: M, 36.7%; SC, 1.7%; C, 2.7%; F, 4.4%; Rf , 88%. D Actual yield × M, S, C, F, Kf /theoretical yield. E Actual yield/theoretical yield × 100. F Kilogram of component in cheese per kg in milk. G Weight of cheese + weight of whey as a percent of total weight of milk. A B. whereas protein recovery was 2.5% higher than the value reported by Spreer (1998). In the feeding trial, the average milk yield per cow per day was greater for M5 cows than M1 cows. Casein concentration in the M5 milk was also higher than in the M1 milk (by 2.7 g/kg), a result associated with higher energy (by 28%) and protein intake (by 35%) by the M5 cows. This result suggests an increase in ME intake through the use of high quality forages contributes to an increase in the production of volatile fatty acids (acetate and butyrate), ammonia and microbial CP, whereas the grain supplement is likely to contribute to an. increase in propionate levels, microbial synthesis and the level of rumen ammonia, which overall increase the supply of precursors for milk protein synthesis (Gordon 1977). Yousef et al. (1969) also reported an increase in milk protein concentration with high-grain, low-fibre rations, in which milk protein and casein concentrations were increased by 0.14 and 0.27% units, respectively. Previous studies have attributed improvement in the characteristics of milk for cheesemaking to increased protein or casein concentration (Grandison et al. 1984; O’Keeffe et al. 1984; Vertes et al. 1989). Our results show a high.
(6) 304. Australian Journal of Experimental Agriculture. B. Amenu et al.. Table 6. Effects of feeding system (FS) and season (S) on cheese composition Cheese composition Protein Moisture (g/kg) to protein ratio. Moisture (g/kg). Fat (g/kg). Fat (g/kg DM). Moisture in fat free solids (g/kg). Spring Autumn. 347 394. 358 323. 548 533. 541 584. Spring Autumn. 346 380. 331 334. 507 540. 517 572. 11.58 P<0.01 n.s.. 5.854 n.s. n.s.. 25.90 n.s. n.s.. 25.61 P<0.01 n.s.. 14.36 P<0.05 n.s.. n.s.. n.s.. n.s.. n.s.. n.s.. s.e. S FS S × FS A. Salt (g/kg). Salt (g/kg moisture). Total ash (g/kg). pH. 40.1 44.2. 5.10 5.40. 7.80 5.20. 17.0 17.7. 52.4 45.1. 39.1 47.2. 5.10 5.40. 9.80 5.40. 16.8 16.8. 2.446 P<0.01 n.s.. 4.335 n.s. n.s.. 0.053 P<0.01 n.s.. 1.140 P<0.05 n.s.. 0.927 n.s. n.s.. n.s.. n.s.. n.s.. n.s.. n.s.. Tropical pastures (M1) feeding system 242 1.43 17.9 51.9 283 1.40 16.6 42.2 Feedlot (M5) feeding system 284 1.22 18.0 293 1.31 17.1 Significance 0.089 0.313 n.s. P<0.01 n.s. n.s. n.s.. n.s.. Soluble N (%)A Day 1 Day 90. Soluble nitrogen was determined by 12% TCA and is presented as a percentage of total nitrogen.. correlation (r = 0.81) between milk fat plus casein and cheese yields. On average, for a 0.1% increase in the total casein concentration, moisture-salt adjusted Cheddar cheese yield increased by 0.14 kg/100 kg milk. This increase in cheese yield with casein level was less than that reported by Guinee et al. (2001) in which an approximate increase in milk casein of 0.1% resulted in an increase in moisture-salt adjusted Cheddar cheese yield of 0.5 kg/100 kg milk. Differences in casein levels among M1 and M5 milk, when proportions of casein fractions in total casein were similar, were not reflected in different cheese yields. Although the differences in forage quality were reflected in milk and protein yields, they have not resulted in reduced cheese yields with current experiment. Christian et al. (1999a) reported changes in the concentrations of αs1 - and αs2 -caseins in milk from cows fed different types of energy and protein supplements in conjunction with a control diet of silage and pasture hay (40% silage and 60% pasture hay). A significant increase in αs2 - and decline in αs1 -casein was seen when cows were fed a lupin-wheat concentrate supplement, which increased the energy concentration of the diet by 26% and total ME intake by 54%. The proportions of casein fractions appeared to be unaffected by changes in diet. Mackle et al. (1999) demonstrated that cows fed pasture plus maize grain and pasture silage produced milk with significantly higher β-casein levels than cows fed pasture plus maize grain only, though the proportions did not change. Similarly, Coulon et al. (2001) found no significant effects of feeding 3 levels of protein and energy on proportions of casein fractions in total protein. Further research is needed to determine if the effects of the cow’s diet quality and its impact on cheese yield are mediated. through changes to the proportions of casein fractions in total casein. The similarity in cheesemaking properties observed in milk from the 2 feeding systems may be due to similar milk total solids and proportions (of the total casein) of the different casein fractions. In particular, there was no significant difference in the percentages of κ-casein, the casein that has a major influence on micelle stability (Dalgleish 1993) and hence cheesemaking. Cows in late lactation (autumn milk) in both treatments gave milk yielding the most cheese (2.5 ± 0.457 kg more cheese/100 kg milk) than cows in early lactation (spring milk). Cows in late lactation produced lower yields of milk with higher concentrations of fat, true protein and casein (Table 3). This was governed by the stage of lactation trend in milk protein and casein concentration. Generally, milk protein and casein concentration are higher at the beginning of lactation in the colostrums, which contains a large amount of immunoglobulin, followed by a significant decrease over the first week of lactation. Milk protein and casein concentration decline further to a minimum after about 6 weeks of lactation and during the next 12 weeks, increase until the end of lactation (Holmes et al. 2002). This finding is consistent with results previously reported by Kefford et al. (1995). Stage of lactation associated with season, also had a significant effect on cheese moisture. By contrast, autumn milk in the present experiment was superior to spring milk for cheese yield and quality, whereas autumn milk was inferior to spring milk in temperate Australia (Kefford et al. 1995). The seasonal impact on cheese yield was related to a consistent trend of higher fat and protein recovery. However, the yield differences were eliminated when cheese yields were.
(7) Impacts of feeding system and season on cheese manufacture. adjusted to targeted values for the experiment means. Actual and adjusted cheese yields and composition were similar for the 2 feeding systems, indicating that the processability characteristics were similar. Furthermore, day 1 soluble N, which is mainly owing to plasmin and possibly residual or reactivated chymosin in cooked cheese (Candioti et al. 2002) and secondary proteolysis, was similar (P>0.05) for M1 and M5 cheeses. There was a higher level of peptides in 90-day-old cheeses, but no differences between cheeses from the various treatments. All the cheeses had a moderate aroma and flavor, Cheddar characteristic color, appropriate salty taste and smooth texture, and satisfactory overall quality. This suggests that cows using tropical pasture feeding systems with high-energy concentrate inputs can produce milk suitable for Cheddar cheese manufacture. Milk and Cheddar cheese yield and composition were significantly influenced by seasonality, which in this case was very closely associated with the stage of lactation. Milk from cows in autumn (late lactation) had higher levels of fat and protein and produced significantly more cheese per volume of milk than that in spring (early lactation). The 2 feeding systems had a significant effect on milk yields, and protein and casein percentage; cows in the M5 system (feedlot) produced higher yields and higher protein levels. However, the milk from the 2 systems gave the same yields of cheese per 100 kg milk. Thus, cows in a feeding system using tropical pastures, with substantial concentrate input, produced milk suitable for Cheddar cheese manufacture. More information is needed to understand whether the cheese-yielding performance is mediated through changes in casein fractions as a proportion of total casein. Furthermore, it was beyond the scope of the current work to make a comparison on the basis of profitability and labour efficiency between the 2 feeding systems as the study reported in this paper was only part of a broader research program examining various strategies in intensive dairy production systems. Acknowledgments The authors acknowledge the Mutdapilly Research Station staff who assisted throughout this experiment. Special thanks are also extended to Allan Lisle who assisted in statistical analysis. We are also grateful for financial support from the Tropical Dairy Research Centre, School of Animal Studies, University of Queensland, Gatton, Qld 4343, Australia. References Andrews RJ, Cowan RT, Callow MN, Chataway RG, Bake GK, et al. (2002) Sustainable dairy farm systems for the tropics. Proceedings of the Australian Society of Animal Production 24, 270. AOAC (1990) Standard methods for examination of dairy products. In ‘Association of official analytical chemists AOAC’. 15th edn. (Ed. GH Richardson) pp. 802–850. (Utah State University AOAC: Arlington, VA). Australian Journal of Experimental Agriculture. 305. Auldist M, Johnston K, Fitzsimons P, Boland M (2001) Effect of breed of cow on cheese yield. The Australian Journal of Dairy Technology 56, 178. Banks J (1990) The quality of milk in relation to cheese manufacture. Journal of the Society of Dairy Technology 43, 35–39. Banks JM, Tamime AY (1987) Seasonal trends in the efficiency of recovery of milk fat and casein in cheese manufacture. Journal of the Society of Dairy Technology 40, 64–66. Barber DG, Goblus NR, Hannah IJC, Poppi DP, Cant JP (2001) An approach to identifying factors affecting milk protein concentration in dairy cattle. Australian Journal of Dairy Technology 56, 155. Beever DE, Sutton JD, Reynolds CK (2001) Increasing the protein content of cow’s milk. Australian Journal of Dairy Technology 56, 138–149. Broome MC, Tan SE, Alexander MA, Manser B (1998) Lowconcentration-ratio ultra filtration for cheddar cheese manufacture. 1: Effect on seasonal cheese composition. Australian Journal of Dairy Technology 53, 5–10. Candioti MC, Hynes E, Meinardi CA, Perotti MC, Zalazar CA (2002) Cultures for reggianito cheese. Australian Journal of Dairy Technology 57, 170. Christian MP, Grainger C, Southerland BJ, Mayes JJ, Hannah MC, et al. (1999a) Managing diet quality for cheddar cheese manufacturing milk. 1. The influence of protein and energy supplements. The Journal of Dairy Research 66, 341–355. doi: 10.1017/S0022029999003647 Christian MP, Grainger C, Southerland BJ, Mayes JJ, Hannah MC, et al. (1999b) Managing diet quality for cheddar cheese manufacturing milk. 2. Pasture v. grain supplements. The Journal of Dairy Research 66, 357–363 doi:10.1017/S0022029999003659 Coulon JB, Dupont D, Pochet S, Pradel P, Duployer H (2001) Effect of genetic potential and level of feeding on milk protein composition. The Journal of Dairy Research 68, 569–577. doi: 10.1017/S002202990100512X Dalgleish DG (1993) The enzymatic coagulation of milk. In ‘Cheese chemistry, physics and microbiology. General aspects. Vol. 1.’ 2nd edn. (Ed. PF Fox) pp. 69–100. (Chapman and Hall: New York) Everett DW, Jameson GW (1993) Physicochemical aspects of cheddar cheese made from ultrafiltered milk. Australian Journal of Dairy Technology 48, 20–29. Gordon FG (1977) The effect of protein content on the response of lactating cows to level of concentrate feeding. Animal Production 25, 181–191. Grandison AS, Ford GD, Owen AJ, Millard D (1984) Chemical composition and coagulating properties of renneted Friesian milk during the transition from winter rations to spring grazing. The Journal of Dairy Research 51, 69–78. Guinee TP, Mulholland E, O’Brien B, Murphy J (2001) Effect of diet quality on the suitability of mid-lactation bovine milk for cheddar cheese manufacture. Australian Journal of Dairy Technology 56, 3–8. Holmes CW, Brookes IM, Garrick DJ, Mackenzie DDS, Parkinson TJ, Wilson GF (2002) Lactation: Mammary gland development and maintenance of lactation. In ‘Milk production from pasture, principles and practices’. (Ed. D Swain) pp. 317–368. (Massey University: Wellington, New Zealand) Houlihan A, Lowe K, Cowan T, Deeth H, Dennien G, et al. (2001) The influence of milk composition on processability. Australian Journal of Dairy Technology 56, 177. Karman AH, van Boekel M (1986) Evaluation of the Kjeldahl factor for conversion of the nitrogen content of milk and milk products to protein content. Netherlands Milk and Dairy Journal 40, 315–336..
(8) 306. Australian Journal of Experimental Agriculture. Kefford B, Christian MP, Sutherland BJ, Mayes JJ, Grainger C (1995) Seasonal influences on Cheddar cheese manufacture: influence of diet quality and stage of lactation. The Journal of Dairy Research 62, 529–537. Kosikowski FV (1977) Analysis. In ‘Cheese and fermented milk foods.’ 2nd edn. (Ed. FV Kosikowski) pp. 560–572. (Edwards Brothers, Inc.: Ann Arbor) Mackle TR, Bryant AM, Petch SF, Hill JP, Auldist MJ (1999) Nutritional influences on the composition of milk from cows of different protein phenotypes in New Zealand. Journal of Dairy Science 82, 172–180. Mayes JJ, Sutherland BJ (1984) Coagulum firmness and yield in Cheddar cheese manufacture. Australian Journal of Dairy Technology 39, 69–73. Mistry V, Brouk M, Kasperson K, Martin E (2002) Cheddar cheese from milk of Holstein and Brown Swiss cows. Milchwissenschaft. Milk Science International 57, 19–23. Murphy JJ, O’Mara F (1993) Nutritional manipulation of milk protein concentration and its impact on the dairy industry. Livestock Production Science 35, 117–134. doi:10.1016/03016226(93)90185-K O’Keeffe AM (1984) Seasonal and lactational influences on moisture content of cheddar cheese. Irish Journal of Food Science and Technology 8, 27–37. Pearson D (1991) Composition and Analysis of Foods. Dairy Products II. In ‘Pearson’s Composition and Analysis of Foods’. 9th edn. (Ed. RS Kirk, R Sawyer) pp. 530–680. (Longman: London) Phelan JA (1981) Standardization of milk for cheesemaking at factory level. Journal of the Society of Dairy Technology 34, 152–156. Phelan JA, O’Keeffe AM, Keogh MK, Kelly PM (1982) Studies on milk composition and its relationship to some processing criteria. 1. Seasonal changes in the composition of Irish milk. Irish Journal of Food Science and Technology 6, 1–11.. B. Amenu et al.. Posthumus G, Booij CJ, Klijn CJ (1964) The relationship between the protein content of milk and the cheese yield. Netherlands Milk and Dairy Journal 18, 155–164. SAS Institute (1996) ‘SAS/STAT software. Version 6.12.’ (SAS Institute: Cary, NC) Scott R (1986) Casein by modified acidity titration method. In ‘Cheesemaking practice.’ (Ed. R Scott) p. 104. (Elsevier Applied Science: London) Spreer E (1998) Milk and dairy product technology. In ‘Food science and technology.’ pp. 293–294. (Marcel Dekker, Inc.: New York) Standards Association of Australia (1988) Methods of chemical and physical testing for the dairy industry: AS 2300.1.1. Standards Association of Australia, North Sydney, NSW. Vertes C, Hoden A, Gallard Y (1989) Effect of nutritional level on the composition and cheese making quality of milk from Friesian and Normandy cows. INRA Productions Animales 2, 89–96. Visser S, Slangen CJ, Rollema HS (1991) Phenotyping of bovine milk proteins by reversed phase high performance liquid chromatography. Journal of Chromatography 548, 361–370. doi:10.1016/S00219673(01)88619-2 White CL 2001 Factors affecting milk protein concentration in Australian dairy cows. Australian Journal of Dairy Technology 56, 153. Yousef IM, Huber JT, Emery RS (1969) Milk protein synthesis as affected by high-grain, low-fiber rations. Journal of Dairy Science 53, 734–739.. Received 9 April 2004, accepted 24 March 2005. http://www.publish.csiro.au/journals/ajea.
(9)
Figure


Related documents
In this paper, we propose an algorithm called " Polyhedron Search Algorithm " ( POLYSA ) that manages non-binary CSPs in a natural way as an incremental and non-binary
Carry out a one factor analysis of variance and test at the 5% significance level whether there is a difference in weight loss
conceptualization chapter in the sense that I will discuss theoretical and practical reasons why research on relationships and reputations has emerged to be dominant in the field of
Senate Bill 953 (Session Law 1999-328), passed by the 1999 North Carolina General Assembly, requires the Department of Public Instruction (DPI), in conjunction with the Departments
Please address questions regarding content to Roberto Chang, Research Officer, Federal Reserve Bank of Atlanta, 104 Marietta Street, NW, Atlanta Georgia 30303-2713,
In July 2007 the Building Owners and Managers Association International (BOMA) introduced a 7-Point Challenge to its members, focusing on green building and aiming to achieve market
Our data suggest that a multidisciplinary treatment approach to chronic ischemic stroke patients by combining segmental muscle vibrator with physical therapy interventions show signi
[ 9 ] Assuming continuous deformation, we examine the effect of an obliquely oriented discontinuity of strength on the localization of strain in a continental collision zone
