RVC OPEN ACCESS REPOSITORY – COPYRIGHT NOTICE
This is the author’s accepted manuscript. The final publication is available at IOS Press through http://dx.doi.org/10.3233/JND-170267.
The full details of the published version of the article are as follows:
TITLE: Determination of qPCR Reference Genes Suitable for Normalizing Gene Expression in a Canine Model of Duchenne Muscular Dystrophy
AUTHORS: Hildyard, J C W; Taylor-Brown, F; Massey, C; Wells, D J; Piercy, R J
JOURNAL TITLE: Journal of Neuromuscular Diseases
PUBLICATION DATE: 26 March 2018 (online)
PUBLISHER: IOS
1
Title:
Determination of qPCR reference genes suitable for normalizing
gene expression in a canine model of Duchenne muscular dystrophy
John C.W. Hildyard*, Frances Taylor-Brown, Claire Massey, Dominic J. Wellsb, Richard J. Piercy
Comparative Neuromuscular Diseases Laboratory, Department of Clinical Science and
Services and bDepartment of Comparative Biomedical Sciences, Royal Veterinary College,
London NW1 0TU
*corresponding author
Running Title:
qPCR reference genes in a canine model of DMD
Correspondence address:
Dr John Hildyard, Comparative Neuromuscular Diseases Laboratory, Department of Clinical Science and Services, Royal Veterinary College, London NW1 0TU
BACKGROUND: Dogs with dystrophin-deficient muscular dystrophy are valuable models of
2
these animals present a disease severity and progression that closely matches that found in
human patients. Canine models are however less thoroughly characterised than the
established mdx mouse in many aspects, including gene expression. Analysis of expression in
muscle plays a key role in the study of DMD, allowing monitoring and assessment of disease
progression, evaluation of novel biomarkers and gauging of therapeutic intervention efficacy.
Appropriate normalization of expression data via carefully selected reference genes is
consequently essential for accurate quantitative assessment. Unlike the expression profile of
healthy skeletal muscle, the dystrophic muscle environment is highly dynamic: transcriptional
profiles of dystrophic muscle might alter with age, disease progression, disease severity,
genetic background and between muscle groups.
OBJECTIVES: The aim of this work was to identify reference genes suitable for normalizing
gene expression in healthy and dystrophic dogs under various comparative scenarios.
METHODS: Using the delta-E50 MD canine model of DMD, we assessed a panel of candidate
reference genes for stability of expression across healthy and dystrophic animals, at different
ages and in different muscle groups.
RESULTS: We show that the genes HPRT1, SDHA and RPL13a appear universally suitable for
normalizing gene expression in healthy and dystrophic canine muscle, while other putative
reference genes are exceptionally poor, and in the case of B2M, actively disease-correlated.
CONCLUSIONS: Our findings suggest consistent cross-sample normalization is possible even
throughout the dynamic progression of dystrophic pathology, and furthermore highlight the
importance of empirical determination of suitable reference genes for neuromuscular
3
Keywords: Duchenne Muscular dystrophy, Quantitative PCR, Normalization, Dogs, Dog
4
Introduction
The fatal, X-linked, muscle-wasting disease Duchenne muscular dystrophy (DMD) affects
roughly one in five thousand newborn boys [1], and is caused by insufficiency or absence of
the muscle sarcolemma-associated structural protein dystrophin, a protein responsible for
maintaining a physical link between the intracellular actin cytoskeleton and the extracellular
muscle matrix environment. Loss of dystrophin weakens the sarcolemmal integrity of muscle
fibres, leaving them sensitive to contraction-induced injury (especially eccentric contraction,
where muscle fibres lengthen under tension) [2]. As muscle tissue is highly regenerative, the
disease is typically characterised by continuous cycles of muscle degeneration and
regeneration: regeneration that is sufficient to retain (albeit partially-compromised) muscle
performance for the first few years of life. The ongoing process of muscle damage ultimately
results in a persistent inflammatory state leading to progressive loss of muscle tissue and
accumulation of fatty infiltrates and fibrotic scarring. DMD boys are thus often initially
asymptomatic, displaying early signs of the disease between three and five years of age, losing
ambulation between the ages of eight and fourteen and losing further muscle tissue
thereafter. No cure for DMD presently exists, and while improved disease management (such
as a programme of anti-inflammatory corticosteroid treatment) has led to significantly
increased lifespans, DMD patients today typically die in their late twenties or early thirties
from either cardiac or respiratory failure [3].
Despite being an essentially monogenic condition, DMD varies considerably in severity and
progression, a feature not shared by the dystrophin-deficient mdx mouse model. Dystrophin
is an enormous gene with numerous splice variants: the varied site and nature of causative
5
[4-8]. The disease is further subject to influence from modifier genes, most of which remain
poorly-characterised. Even on the comparatively consistent genetic backgrounds offered by
mouse models, additional mutations in genes such as Annexin 6 substantially alter disease
severity [9]. In human patients, mutations reducing expression of osteopontin [10, 11], or
modulating signalling through TGFβ [12, 13] slow disease progression, and in dogs,
muscle-driven expression of the Notch ligand Jagged1 is associated with retained muscle function
and increased longevity [14], as is downregulation of the phosphatidylinositol protein PITPNA
[15]. It is likely that many thus-far undetected gene variants contribute to disease
progression, and in more genetically outbred models (or indeed the enormous genetic
diversity represented by the human population) such variability likely represents the norm.
Within any given individual, the precise composition of muscle tissue varies considerably as
the disease progresses, and indeed the cellular milieu present within a muscle may vary over
even relatively small timescales in response to atypical muscle activity. Additionally, the
extent of damage, rate of disease progression, and balance of fibrotic/adipogenic
replacement differs considerably between muscle groups and with frequency of muscle use.
In DMD patients, loss of ambulation invariably occurs before loss of upper limb mobility, and
the diaphragm and intercostal muscles (muscle groups subject to essentially constant use and
eccentric contraction) are among the most severely affected: these muscles show
pronounced dystrophic pathology even in the otherwise relatively mildly-affected mdx
mouse. In stark contrast, the extraocular muscles appear to be highly resistant to dystrophic
pathology, retaining essentially unaltered function throughout the course of disease [16].
Taken together, this highlights the importance of ensuring that potential therapies are tested
6
but also illustrates the challenges to performing direct individual-to-individual comparison of
disease progression (and response to therapeutic intervention) in such models.
Quantitative analysis of gene expression in dystrophic muscle
:Measurement of gene expression in dystrophic muscle readily allows monitoring of disease
progression and response to intervention, however such assessment is hampered by the
innate variability described above. While semi-quantitative RT-PCR (and even nested RT-PCR)
via gel densitometry is surprisingly commonplace in the DMD field, truly quantitative gene
expression data is chiefly obtained via qPCR. The accuracy of this technique is
critically-dependent on good normalization: even with identical starting material, slight differences in
the efficiency of RNA isolation or cDNA synthesis can significantly affect subsequent
quantitation. Effective normalization requires appropriate reference genes, and indeed
efforts to identify, validate and publicize such genes are becoming more common in a variety
of disease states [20-24] and model organisms [25-30]. A review of the literature specifically
within the DMD field however reveals a considerable number of candidates: selected
examples in dystrophic dogs include GAPDH [31-33], RPS18 [34], HPRT1 [35, 36], 18S [37]; in
humans, TBP and GUSB [13]; and in mice GAPDH [33, 38], ActB [39], 18S [40]. There appears
to be minimal effort to apply reference genes consistently between studies (even varying
from manuscript to manuscript within a research group), and data supporting the selection
of the gene or genes used is rarely presented. Moreover, use of a single reference gene is
common, despite MIQE guidelines [41]. Use of two or three such genes is, while demonstrably
more expensive and time-consuming, nevertheless necessary for the generation of
high-quality data (especially in more genetically outbred models such as the dog) and is thus highly
7
transcriptionally-static tissues, and becomes particularly challenging under conditions where
a high degree of transcriptional plasticity might be expected (such as a progressive disease
state). mRNA is typically subject to a higher rate of turnover than many proteins, and as a
consequence even genes regarded as canonically ‘stable’ at the protein level (such as GAPDH
or beta-actin) can vary significantly between samples, and indeed alter in expression over
even relatively short timeframes [24, 43, 44]. This inherently dynamic behaviour of mRNA,
combined with the progressive pathological changes associated with DMD, the differing
severity dependent on muscle type and use, and the presence of modifier genes that worsen
or ameliorate disease progression all potentially place severe restrictions on the studies that
may be performed; such limitations make accurate comparisons of gene expression between
individuals, between muscles, or over extended time periods, particularly difficult [45].
Determination of a set of reference genes suitable for normalizing gene expression between
individuals, between muscle groups and between age groups would therefore be beneficial;
a unified set of genes suitable for all these categories combined would (if possible) be
especially useful. The delta-E50 MD dog model of DMD [46] offers a perfect test case for
identification of such reference genes.
Determination of reference genes:
Identification of suitable reference genes for qPCR normalization is by necessity somewhat
convoluted: effective validation of a candidate reference gene would classically require
comparison with an existing validated reference gene, essentially presenting an infinite
regression problem. Several different methodologies have been proposed to circumvent
these difficulties, each assessing suitability of candidate genes by subtly different criteria, and
8
methods, namely geNorm [47], Normfinder [48] and Bestkeeper [49]: all three require a
dataset comprising gene expression data for a representative number of samples, for all the
candidate reference genes, and all three use Microsoft Excel (as an executable macro, an
add-in and a write-protected spreadsheet, respectively) thus all three are readily accessible.
Moreover, each program determines suitable reference genes via different algorithms: genes
identified as high-scoring by all three methodologies are therefore likely to be strong
candidates.
A detailed consideration of the strengths and weaknesses of the three packages is provided
(supplementary information 1), however the essential details and merits (and relevant links
to software) are summarised below.
geNorm analysis uses an iterative pairwise approach, identifying the pair of genes with the
greatest pairwise correlation. The method does not assess overall expression stability, thus is
tolerant of noisy datasets (but relatively sensitive to outliers). As a pairwise approach, the
software identifies a minimum of two suitable genes (single candidates with greater stability
will be ignored). A Microsoft-office compatible copy of the original excel macro is available at
http://ulozto.net/xsFueHSA/genorm-v3-zip.
Bestkeeper analysis compares individual expression profiles for each reference gene to a
geometric mean profile generated from all gene candidates; in essence ranking the extent to
which individual genes reflect the behaviour of the dataset as a whole.
The bestkeeper spreadsheet can be obtained from
9
Normfinder analysis ranks individual gene candidates on overall expression stability, and can
do so for the dataset as a whole, or within/between user-defined groups. Normfinder thus
can identify suitable reference genes based on stability of expression alone: while this analysis
thus handles noisy datasets poorly, it provides a valuable counterpart to the essentially
pairwise methods of Bestkeeper and geNorm.
The Normfinder plugin can be obtained from http://moma.dk/normfinder-software
Study design:
We present studies using a large sample set (81 muscle samples) obtained from the delta-E50
MD dog model of DMD. Canine models offer several key advantages over mouse models:
unlike the relatively mildly-affected mdx mouse model, dogs with dystrophin-deficient
muscular dystrophy exhibit a pattern of disease progression far closer to that shown in human
patients, with pronounced pathological muscle-wasting, progressive accumulation of fibrotic
scarring and fatty infiltrates, and marked reduction in muscle performance [50]. Moreover,
unlike the essentially maximally-inbred mouse model, delta-E50 MD dogs are maintained in
a comparatively outbred state: female carriers are maintained in-house, but mated with
externally-sourced stud males to generate healthy and dystrophic male progeny, reflecting
the genetic diversity of the human population as a consequence. From a practical standpoint,
the larger size of this animal model also readily permits repeated muscle biopsy from different
sites within even a single muscle, thereby enabling within-animal studies and avoidance of
accidental sampling of muscle tissue damaged by previous biopsy, a practicality that cannot
10
The delta-E50 MD model also offers a further advantage: the mutation falls within a common
human hotspot, and is readily amenable to antisense oligonucleotide-based or other
exon-skipping therapeutics, requiring only ‘exon-skipping’ of exon 51 for reading frame restoration.
Our final sample set is comprehensive, comprising both diseased and healthy tissues, multiple
genetically diverse individuals, several different ages and muscle groups, and moreover,
incorporating both elements of consistency (multiple samples of matching muscle and age)
and elements of marked diversity (inclusion of multiple muscle groups, including mandibular
and extraocular muscles that in dogs uniquely express the 2M and EO myosin heavy chains,
respectively). We have combined this collection of samples with a relatively large panel of
reference genes (ActB, UBC, 18S, SDHA, RPL13a, YWHAZ2, B2M and HPRT1 –see table 1) to
generate a dataset for use in the three software algorithms described above. Analysing this
dataset in several configurations allowed us to determine appropriate reference genes for
normalizing expression under various specific constraints, revealing reference genes that
scored highly under all conditions investigated.
Methods
Animal cohorts and tissue collection:
Maintenance of the dystrophic delta-E50 MD dog colony and biopsy for the natural history
study were conducted under Project Licence approval from the UK Home Office and following
approval from the Royal Veterinary College Ethics and Welfare committee.
Nine male dogs (5 dystrophic, 4 healthy) from the colony were used for study of age-related
11
general anaesthesia at three month intervals, up to a maximum age of eighteen months as
part of a larger natural history disease characterisation. Where possible, dystrophic and
healthy littermates were used for each time-point, with samples being collected as dogs of
the appropriate age became available. Final coverage thus consists of: 3 months, N=8 (5:3
DMD:WT); 6 months, N=7 (3:4); 9 months, N=5 (2:3); 12 months, N=4 (2:2); 15 months, N=4
(1:3); 18 months, N=5 (2:3). One healthy dog from this cohort (G2) was subsequently
euthanized at 18 months of age to provide a panel of muscle types, and D1 and D2, two
additional dogs (dystrophic littermates) were added to provide a similar panel of dystrophic
muscles (samples collected post-mortem following humane end-point euthanasia). As the
ages of these latter dogs at euthanasia (14 and 17 months, respectively) were close to the 15
and 18 month age brackets defined above, these samples were also included in several
comparisons of age-related gene expression (see supplementary figure 1 for IDs, litter
matching, genotypes, muscle groups and ages). Immediately following collection, muscle
samples (approximately 1cm3) were mounted on cork blocks on a bed of OCT (Tissue-Tek) and
snap frozen under liquid-nitrogen-cooled isopentane to preserve tissue morphology.
Frozen tissues were used for histological serial cryosectioning (as part of a separate study),
with interleaving (unmounted) sections collected for isolation of the RNA used in this study
(50-100 8um sections per sample, ca. 40-100mg tissue).
RNA isolation and cDNA synthesis:
Frozen tissue sections were rapidly mixed with RNA-Bee reagent (Amsbio) and RNA extracted
following the manufacturer’s instructions (with inclusion of an additional 1:1 chloroform
extraction following phase separation, and inclusion of glycogen at 10ug.ml-1 during
12
samples exhibiting significant guanidium carryover (260/230<1.7) further cleaned by a second
isopropanol precipitation step.
cDNA was prepared from RNA using the RTnanoscript2 kit (PrimerDesign) using random 9mer
and oligodT priming, with 1.6ug of total RNA per 20ul reaction. Following synthesis, cDNA
samples were diluted (1/20) to minimise PCR-inhibitory contributions from cDNA synthesis
buffer components, giving a final cDNA concentration of approximately 4ng/ul (assuming 1:1
conversion of RNA to cDNA).
qPCR and analysis:
qPCR reactions were performed in duplicate or triplicate with 2ul cDNA per well (approx 8ng),
using PrecisionPLUS SYBR green mastermix (PrimerDesign) with primers to ActB, UBC, 18S,
SDHA, RPL13a, YWHAZ2, B2M and HPRT1 (see table 1) taken from the geNorm Canis familiaris
set (PrimerDesign), and primers to Myf5 and MEF2C designed using primer3 software
(http://primer3.ut.ee/). PCR was conducted in a CFX384 light cycler (BioRad) with Cq values
determined via regression.
MEF2C Fwd: 5’-GCAAGCAAAATCTCCTCCCC-3’
MEF2C Rev: 5’-TGGGGTAGCCAATGACTGAG-3’
Myf5 Fwd: 5’-CGGCCTGCCTGAATGTAAC-3’
Myf5 Rev: 5’-AATCCAGGTTGCTCGGAGTT-3’
All primer pairs gave sharp, single amplicon products and single melt peaks: for additional
details (cycling conditions, quality checks, melt curves) see supplementary info 2.
Candidate reference genes were analysed using geNorm, NormFinder and Bestkeeper, using
the Windows 7 operating system and Excel 2003 or 2010 (Microsoft). Bestkeeper analysis
13
by conversion to relative quantities (RQ). Analysis was performed on the dataset as a whole,
or using subsets of data as described below.
geNorm and Bestkeeper:
RQ data (or raw Cq data, respectively) were entered into the geNorm/Bestkeeper excel
macros in the following combinations:
Entire dataset (all dogs, all muscles, all ages)
Natural history samples (vastus lateralis muscles, all ages)
Natural history dystrophic samples (dystrophic vastus lateralis, all ages)
Natural history healthy samples (non-dystrophic vastus lateralis, all ages)
Dystrophic samples (all muscles, all ages, dystrophic only)
Healthy samples (all muscles, all ages, healthy only)
Muscle panel (all muscles, two ages)
Healthy muscle panel (all muscles, single age, healthy only)
Dystrophic muscle panel (all muscles, two ages, dystrophic only)
Normfinder:
As described above, the Normfinder algorithm can be used with datasets as a whole, but also
offers the option of grouping data in a user-dependent fashion: allowing measurement of
between-group and within-group variation for a potentially large number of grouping criteria.
Our Normfinder analysis therefore used two approaches: ungrouped, assessing expression
variation overall, using the entire (RQ) dataset or selected subsets exactly as described for
geNorm and Bestkeeper (above), or grouped, looking at variation in expression over the entire
dataset (or subsets as above), between specific, user-specified groups. Note: several samples
were necessarily omitted under specific grouping criteria where groups of one sample would
14
analysis can be particularly useful not only for identifying universally-suitable reference genes
but also for isolating group-specific genes (such as a gene showing strong variation with age,
or muscle type). Dataset elements and groupings were as follows:
Entire dataset
o By age
o By individual
o By healthy/diseased
o By litter
Dystrophic animals only
o By age
o By individual
o By litter
Healthy animals only
o By age
o By individual
o By litter
Natural history dogs only
o By age
o By individual
o By healthy/diseased
o By litter
Muscle panel
o By age
15
o By healthy/diseased
All other analyses (Spearman correlations, Mann-Whitney U tests) were carried out using
GraphPad Prism 7.02.
Results
Cq determinations:
Individual Cq values fell within a relatively consistent range for any given gene, with the
greatest sample-to-sample variation observed in ActB and the least in 18S (see supplementary
figure 2). With the exception of the abundantly-expressed 18S ribosomal RNA, the candidate
genes examined covered a total Cq range of over 13 cycles, equivalent to differences in mRNA
expression of around 4 orders of magnitude.
GeNorm analysis:
The iterative pairwise approach of the geNorm algorithm ranks genes by average expression
stability (M), where lower scores represent higher stability. As shown (table 2, figure 1 and
supplementary figure 3), RPL13a, HPRT1, 18S and SDHA were universally scored as the highest
ranking genes (lowest expression stability value), and indeed RPL13a and HPRT1 were ranked
as the highest scoring pair by the geNorm algorithm for all but one of the dataset
combinations (the only exception provided by the dataset of healthy quadriceps samples
alone, where RPL13a was paired with 18S instead, with HRPT1 falling to the next highest
rank). The commonly accepted geNorm threshold for suitable reference gene stability is
16
while 18S and SDHA fall just outside this threshold under several dataset combinations,
RPL13a and HPRT1 are consistently ranked as suitable reference genes by the geNorm
algorithm. Interestingly, by this metric, fully 6 of the 8 genes were ranked as suitable for our
healthy muscle panel (figure 1b), though ActB (beta-actin) scored comparatively poorly under
all dataset combinations, even those assessing healthy muscle alone.
The geNorm algorithm also calculates the pairwise variation arising from inclusion of
additional reference genes, in essence indicating whether the ‘best pair’ is sufficient, or
whether better normalization can be obtained by use of 3 or more genes. In all cases,
increasing number of reference genes to 3 or 4, lowered overall variation (supplementary
figure 4), however values below 0.2 are considered acceptable [47], and the suggested pair
of genes was sufficient to pass this threshold in every instance.
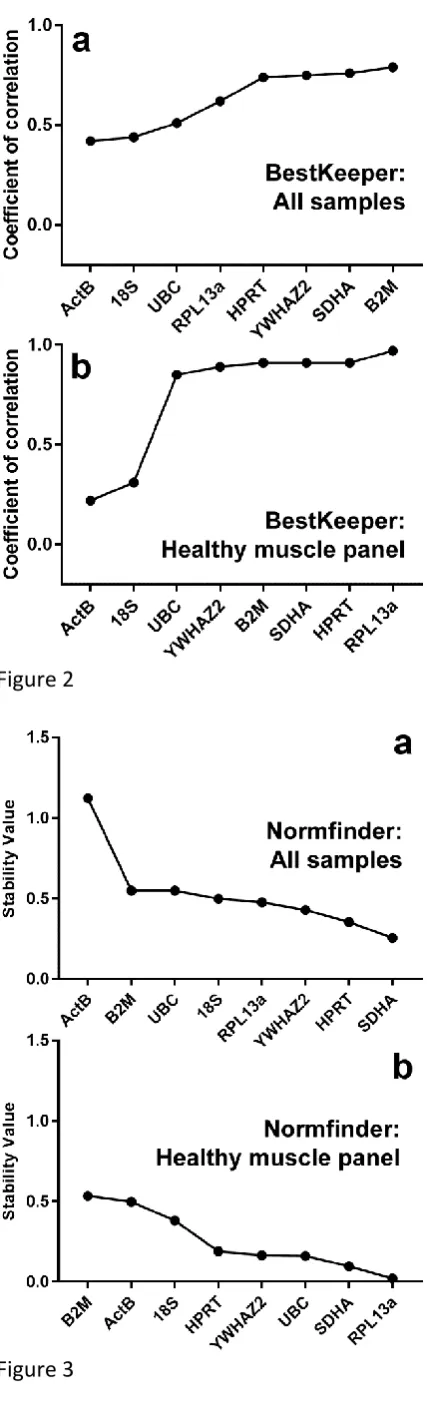
Bestkeeper analysis:
The Bestkeeper spreadsheet generates a large quantity of data, however the most useful
output metric tends to be the coefficient of correlation (r): the extent of correlation between
a given reference gene and the ‘bestkeeper’ (a composite derived from all candidate
reference genes), where higher values represent greater correlation. In essence, this value
reveals the individual gene that best reflects the behaviour of the dataset as a whole. As
shown (table 3, figure 2, supplementary figure 5), HPRT1 and SDHA tended to rank highly
under most combinations, with RPL13a also scoring highly (though usually of lower rank). In
marked contrast to geNorm analysis, YWHAZ2 and B2M also tended to perform well. There is
no established threshold Bestkeeper correlation value for ‘good’ reference genes (thresholds
shown in table 3 are for comparative purposes only), however the data shows a tendency
17
poor candidates are very poor, while often 5 or more of the remaining genes score
comparatively highly.
As with geNorm, ActB was near-universally scored as the least suitable reference gene. Only
UBC and 18S displayed comparably poor suitability. Also in agreement with geNorm analysis,
when our healthy muscle panel was analysed alone (figure 2b), the majority of our candidate
genes (all except ActB and 18S) showed high correlation with the ‘bestkeeper’ (r > 0.85).
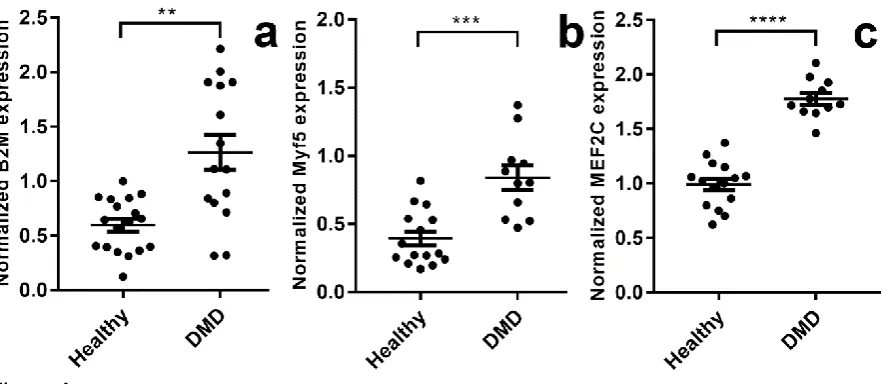
Normfinder analysis:
Ungrouped analysis (table 4, figure 3 and supplementary figure 6), assessing overall
expression stability in the entire dataset, or in subsets as for geNorm and Bestkeeper (above)
revealed that SDHA and HRPT consistently scored highly (low stability value) under essentially
all combinations examined, with YWHAZ2 also performing well (especially under dystrophic
conditions alone). As with the geNorm and Bestkeeper analyses, ActB was again
near-universally ranked as the least appropriate candidate, however (similar to Bestkeeper, but in
marked contrast to its ranking under geNorm), RPL13a here often ranked comparatively
poorly (with the exception of the healthy muscle panel). As with Bestkeeper analysis, there is
no conventional threshold value for Normfinder suitability, however regardless of absolute
value, a stark difference was observed between ActB and essentially every other candidate
gene: the ‘poor score’ for RPL13a was thus typically only marginally worse than the ‘high
score’ for SDHA. An examination of absolute stability values also reiterates the transcriptional
homogeneity of our healthy muscle panel suggested by geNorm and BestKeeper analysis: fully
5 of our 8 candidate genes exhibited values below 0.2, something no single gene was able to
achieve in the matching dystrophic muscle panel (figure 3b).
Under grouped analysis (table 5, supplementary figure 7, supplementary table 1), a more
18
variation, a similar pattern was observed. Again SDHA and HPRT1 scored highly essentially
regardless of grouping criteria, while RPL13a was less favoured. Normfinder grouped analysis
additionally provides a ‘best pair’: a pair of genes that in combination outperform the highest
scoring single candidate (note: these genes need not themselves be the highest scoring
individually –a pair of genes that vary considerably, but in opposite directions, can combine
to provide more accurate normalization). In almost every instance, SDHA or HPRT1 comprised
one member of the ‘best pair’, further supporting the suitability of these reference genes. We
note however that these genes were rarely suggested together: instead YWHAZ2 was near
universally suggested as a partner. This gene also notably scored reasonably highly under all
combinations and groupings save those of healthy dog samples alone.
Further validation:
HPRT1 and SDHA ranked highly under essentially all algorithms and conditions, both in
pairwise variation and stability, while RPL13a showed marked pairwise correlation with
HPRT1 and a tendency to score (if not necessarily rank) highly under most conditions,
especially those assessing healthy muscle alone. Conversely, Bestkeeper analyses showed a
marked tendency to score B2M (beta-2-microglobulin) highly while both geNorm and
Normfinder algorithms suggested the reverse, especially when comparing both healthy and
dystrophic samples (tables 2, 3 and 4): notably, while showing a high correlation with the
‘bestkeeper’, B2M showed much lower correlation with other individual gene candidates. As
geNorm assesses by pairwise comparison, and Normfinder by overall stability, the implication
is that B2M exhibits low expression stability but also potent influence over the dataset as a
whole: a hallmark of a strongly disease-associated gene. To confirm this hypothesis and
19
were normalized using the geometric mean of SDHA, RPL13a and HPRT1 (in essence, using
high-scoring reference genes to normalize potentially disease-associated genes). As shown in
figure 4a, B2M expression is significantly enhanced in dystrophic muscle, by approximately
two-fold when compared with healthy muscle.
To further confirm the suitability of our nominated reference genes, we additionally
measured (and normalized) expression of the myogenic transcription factors Myf5 and
MEF2C –markers of actively regenerating muscle. As shown in figure 4b and c, both these
genes were also strongly upregulated in dystrophic muscle, and to a similar extent as B2M.
Discussion
Canine models of muscular dystrophy are increasingly coming to represent a key translational
element in the study of this disease, exhibiting disease severity and progression (and
concomitant loss of muscle performance) in a manner that closely-mimics the human
condition [17-19]. As measurement of gene expression is a major component of the
investigative toolset, a panel of reference genes suitable for normalizing measured expression
data in this animal model under a multitude of different conditions would be highly beneficial,
and would moreover support the hypothesis that a similarly broadly-applicable set of genes
might be found for human samples. The data presented here strongly suggest that HPRT1 and
SDHA (and to a lesser extent, RPL13a) are suitable candidate reference genes for normalizing
gene expression in both healthy and dystrophic canine muscle, being consistently ranked
highly when comparing muscle samples taken at different ages (and thus in dystrophic
20
different muscles (including selectively-spared muscle groups such as the extraocular
muscles). It should be noted that ‘highest ranking’ need not necessarily imply ‘high scoring’:
any panel of genes, even one comprised entirely of those known to be highly dysregulated in
DMD, would be nevertheless ranked in order of expression stability by these software
programs (effectively producing a ranking of ‘terrible stability’ to ‘poor stability’). Our data
here shows however that not only are SDHA, HPRT1 and RPL13a near-consistently
high-ranking, they are also consistently high-scoring: being both the favoured genes from our
candidate panel, and also empirically highly stable.
This finding in itself is somewhat surprising: the transcriptional environments represented by
these different samples are likely to be highly diverse, and it was by no means guaranteed
that any candidate genes would be suitable under all circumstances. Indeed, even if such a
set of genes existed, it was a distinct possibility that these genes would, rather than being
strong reference genes, instead simply be the ‘least poor’ at normalizing expression within
these diverse environments (with distinct condition-specific combinations of reference genes
being genuine strong candidates). As our data show however, this is not the case: the
nominated reference genes are of comparable stability when analysed as specific categories
(age, individual, disease) as they are when employed as an entire dataset.
Interestingly, analysis of a panel of healthy muscles alone (multiple muscles from one healthy
individual) yields markedly greater stability values for all candidate genes than any dystrophic
or combined dataset, and greater values than a single healthy muscle type (vastus lateralis)
over time. This finding highlights the stark differences in transcriptional activity between
healthy and dystrophic muscle and further suggests that age plays a greater factor in
transcriptional profile than muscle type: adult (healthy) muscle tissue appears
21
such a stable environment, however, SDHA, HRPT1 and RPL13a remained very high-scoring
candidates.
RPL13a codes for a protein component of the 60S ribosomal subunit, and thus might
reasonably be expected to show high stability under resting conditions: protein synthesis
being one of the few constant requirements of virtually all cells. Given the stark changes in
cellular composition between healthy and dystrophic muscle, however, it is perhaps
surprising that the translational demands of the tissue as a whole appear to remain
consistent. One might also expect RPL13a to closely-mirror the expression of 18S ribosomal
RNA (a common choice of reference gene [37, 40]): while the two are indeed scored closely
under several conditions, this is not universal. Moreover, only the protein and the rRNA need
strictly correlate: as an mRNA, RPL13a is subject to further amplification at the translation
stage, while 18S ribosomal RNA is not. As our study shows (see Cq values, supplementary
figure 2), while expression of RPL13a is the highest measured for all candidate mRNAs, it is
still lower in absolute expression than 18S by almost 2 orders of magnitude.
HPRT1 codes for hypoxanthine phosphoribosyltransferase 1, an enzyme involved in purine
biosynthesis via the salvage pathway [51]. While such an important function readily suggests
a housekeeping role, the implication that metabolic requirements for purines are similar
between healthy and dystrophic muscle is an unexpected finding (the former being largely a
post-mitotic tissue, the latter a highly dynamic regenerative environment). The authors note
that this gene has been proposed as a suitable reference gene by others [35, 36].
SDHA (succinate dehydrogenase subunit A) represents a more classical finding, being a
ubiquitous mitochondrial enzyme component and thus also a gene strongly associated with
22
over time: all our quadriceps biopsy samples exhibit near-uniform expression regardless of
disease, individual or age. This was unexpected: dystrophic muscle is subject to pathological
wasting as disease progresses, thus the percentage of a given dystrophic sample that is
functional muscle necessarily falls with age. It is however widely recognised that the more
highly-oxidative fibres (i.e. type I) are selectively spared as disease progresses, with losses
primarily incurred by the faster glycolytic fibres (2A and in particular, 2X) [52]. Our data here
thus suggests not only that SDHA is a suitable reference gene, but also by implication that
regardless of fibre loss, the oxidative capacity of dystrophic muscle (as measured by SDHA
expression) does not significantly decrease over time in this model.
The samples used to prepare our dataset were selected to offer relatively comprehensive
coverage of potential variability, and thus included healthy and diseased tissue, tissues of
different ages, taken from different individuals, and including multiple muscle groups. A
number of caveats must nevertheless be acknowledged: the multiple muscle groups included,
while extensive, were derived from only 3 individual animals (D1, D2 and G2), two of whom
were dystrophic littermates. These samples comprise more than half our entire sample set,
thus our ‘total’ dataset is inherently weighted toward these 3 individuals, and toward
dystrophic muscle as a whole (though this latter is perhaps less contentious given the focus
of this work). Similarly, our panel of age-matched healthy/dystrophic biopsy samples,
assessing disease progression over time, are exclusively derived from a single muscle (the
vastus lateralis) thus our analyses ostensibly identify reference genes suitable for normalizing
expression over time in this muscle alone. Lastly, due to the relatively nascent nature of our
delta-E50 MD dog colony, only 5 animals (3 healthy, 2 dystrophic) were of sufficient age to
over-23
represented (see supplementary figure 1). These limitations accepted, we nevertheless feel
that our panel of samples provides a good coverage of the most likely sources of variation
when analysing dystrophic/healthy muscle, and that our conclusions regarding the broad
utility of our reference gene candidates are thus justified.
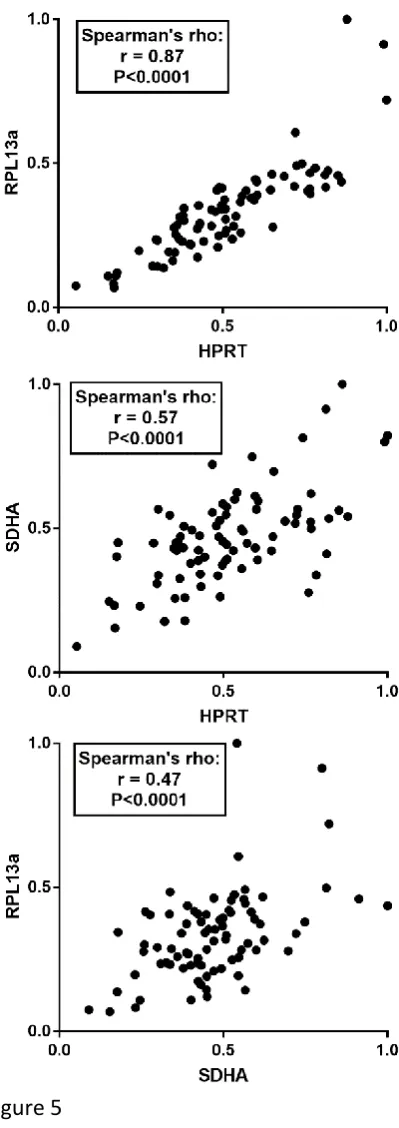
A puzzling finding was the tendency of Normfinder analysis to rank RPL13a among the lowest
scoring genes, while concomitantly nevertheless agreeing with Bestkeeper and geNorm as to
the suitability of SDHA and HPRT1. Indeed, via the pairwise ranking of geNorm, RPL13a and
HPRT1 were almost universally placed as the most closely-correlated pair. As shown in figure
5, the 2 genes exhibit highly-correlated expression values for the dataset (Spearman’s rho
correlation of 0.87, compared to 0.57 and 0.47 for HPRT1/SDHA and RPL13a/SDHA
respectively), thus one might expect these 2 to be ranked similarly by all 3 software
algorithms. As noted above however, our Normfinder analysis tended simply to single out
ActB: this gene was near-consistently placed last, and by a considerable margin, with the
other candidate genes tending to be relatively close-matched in stability (see figure 3 and
supplementary figures 5 and 6). The Normfinder algorithm scores genes by individual stability
of expression (rather than by pairwise comparison to other genes, or to a gestalt of all genes
examined) thus unlike geNorm or Bestkeeper, stability and correlation are not intrinsically
linked. Minor variations in overall expression stability could well account for the lower score
of RPL13a despite its clear pairwise correlation with HPRT1, and we do not thus consider the
poor Normfinder performance of this gene to be sufficient grounds for discarding it from our
lead candidates. All 3 algorithms thus appear (with caveats) to reach near-uniform consensus
regarding strong reference gene candidates, and furthermore all 3 methods also scored ActB
24
exhibited the widest range of Cq values (supplementary figure 2), and we have previously
shown ActB to be an exceptionally poor reference gene in cultured differentiating myoblasts
derived from healthy and dystrophic mice [27]. Our data here thus supports the hypothesis
that ActB is a poor choice of reference gene for muscle-derived samples as a whole (though
we also note this gene has been employed as a reference in mdx mice [39]).
Beyond simple identification of suitable reference genes (and concomitantly, poor reference
genes), an advantage of using such a broad sample set is the potential to identify
condition-specific gene regulation. While the pairwise correlation algorithm of geNorm is less useful in
this respect (as genes are never considered in isolation), the individual gene stability
assessment of Normfinder (and the facility for user-determined grouping) is potentially very
powerful. Our analysis allowed us to single out B2M (beta-2-microglobulin) as a candidate
gene likely to exhibit disease-specific changes in expression, and further (by normalizing with
our high scoring reference genes) allowed us to confirm that this gene is upregulated by
approximately 2-fold in dystrophic muscle, thus illustrating the power of our approach. While
such a DMD-specific upregulation has not to our knowledge been previously reported (though
B2M has been noted to be a poor scoring reference gene in the muscle of mdx mice, along
with ActB [38]), this finding is perhaps not entirely surprising: B2M is (in humans and mice)
canonically relatively poorly-expressed in muscle, but highly expressed in immune lineages
[53, 54], thus the persistent inflammatory state characteristic of dystrophic muscle may well
lead to a marked enhancement of B2M gene expression.
To further confirm the validity of our selected reference genes, we measured expression of
the basic helix-loop-helix (bHLH) myogenic factor Myf5 and the myocyte enhancer factor
25
healthy muscle (MEF2C is constitutively expressed by myonuclei, and Myf5 is found in the
satellite cell population and in muscle spindles [55, 56]), these transcription factors are
strongly induced during myogenesis and would thus be expected to be significantly
upregulated in muscle undergoing active regeneration. As expected, both these genes (after
normalization) exhibit highly significant dystrophy-associated increases in expression, to an
extent comparable with B2M.
We thus present the encouraging finding that, for the purposes of normalizing gene
expression in dystrophic and healthy dog muscle - regardless of muscle type, individual or
age- the genes SDHA, HPRT1 and RPL13a appear universally suitable, and that several other
candidate genes are not only unsuitable, but even actively disease-associated. Our work thus
also illustrates the importance of empirically determining suitable reference genes for
quantitative analysis, and addresses the limitations and advantages of the various software
algorithms a researcher might employ toward this end.
While this discovery should prove of considerable benefit to further studies of this animal
model in particular, we cannot at present confirm whether these findings extend to other
canine models such as the GRMD dog. The fact that these genes are high scoring under such
varied conditions would tend to support this assertion, however: we deem it unlikely that
expression differences between two breeds of Canis familiaris would surpass that between
young healthy muscle and aged dystrophic muscle.
A wider revelation of this work is that such broadly-applicable reference gene candidates exist
at all (and can be empirically determined). While we stress that our data should not be taken
to imply that HPRT1, RPL13a and SDHA are appropriate for human samples, our data
26
normalizing gene expression in biopsy samples taken from human patients. Such studies are
beyond the scope of our current investigations (requiring access to a similarly broad collection
of patient muscle samples and a concomitant suitable panel of human-specific candidate
genes), but our work here suggests such an effort might well yield success. A standard panel
of reference genes suitable for quantitative analyses in human samples (regardless of disease
state, age or individual genetic background) would potentially permit independent studies
and trials to be quantitatively compared, and would thus be of considerable benefit to the
field.
Acknowledgements and support
The authors thank the RVC anaesthesia service and technical support team for all their
assistance, and the Wellcome Trust for funding this study. The manuscript was approved by
the RVC research office and assigned the following number: CSS_01613
Conflicts of interest
The authors have no conflict of interest to report.
Index of Supplementary Material:
Supplementary information 1: expanded summary of methodology, strengths and
weaknesses of the three normalization algorithms used
27
Supplementary figure 1: Animals/muscles used in this study
Supplementary figure 2: Cq distribution and coverage
Supplementary figure 3: geNorm analysis (pairwise rankings)
Supplementary figure 4: geNorm analysis (pairwise variation)
Supplementary figure 5: Bestkeeper analysis (coefficient of correlation)
Supplementary figure 6: Normfinder analysis (ungrouped)
Supplementary figure 7: Normfinder analysis (grouped)
Supplementary table 1: Extended Normfinder analysis (grouped)
References
[1] Mah JK, Korngut L, Dykeman J, et al. A systematic review and meta-analysis on the epidemiology of Duchenne and Becker muscular dystrophy. Neuromuscular disorders : NMD. 2014;24(6):482-91. doi: 10.1016/j.nmd.2014.03.008
[2] Cohn RD, Campbell KP. Molecular basis of muscular dystrophies. Muscle & nerve. 2000;23(10):1456-71.
[3] Burton EA, Davies KE. The Pathogenesis of Duchenne Muscular Dystrophy. In: Mattson MP, editor. Pathogenesis of Neurodegenerative Disorders. Totowa, NJ: Humana Press; 2001. p. 239-84.
[4] Aartsma-Rus A, Fokkema I, Verschuuren J, et al. Theoretic applicability of antisense-mediated exon skipping for Duchenne muscular dystrophy mutations. Hum Mutat. 2009;30(3):293-9. doi: 10.1002/humu.20918
[5] Breitbart A, Murry CE. Imprecision Medicine: A One-Size-Fits-Many Approach for Muscle Dystrophy. Cell stem cell. 2016;18(4):423-4. doi: 10.1016/j.stem.2016.03.004
[6] Falzarano MS, Scotton C, Passarelli C, et al. Duchenne Muscular Dystrophy: From Diagnosis to Therapy. Molecules (Basel, Switzerland). 2015;20(10):18168-84. doi: 10.3390/molecules201018168
[7] Reinig AM, Mirzaei S, Berlau DJ. Advances in the Treatment of Duchenne Muscular Dystrophy: New and Emerging Pharmacotherapies. Pharmacotherapy. 2017;37(4):492-9. doi: 10.1002/phar.1909
[8] Robinson-Hamm JN, Gersbach CA. Gene therapies that restore dystrophin expression for the treatment of Duchenne muscular dystrophy. Human genetics. 2016;135(9):1029-40. doi: 10.1007/s00439-016-1725-z
28
[10] Bello L, Piva L, Barp A, et al. Importance of SPP1 genotype as a covariate in clinical trials
in Duchenne muscular dystrophy. Neurology. 2012;79(2):159-62. doi:
10.1212/WNL.0b013e31825f04ea
[11] Pegoraro E, Hoffman EP, Piva L, et al. SPP1 genotype is a determinant of disease severity
in Duchenne muscular dystrophy. Neurology. 2011;76(3):219-26. doi:
10.1212/WNL.0b013e318207afeb
[12] Flanigan KM, Ceco E, Lamar KM, et al. LTBP4 genotype predicts age of ambulatory loss in Duchenne muscular dystrophy. Ann Neurol. 2013;73(4):481-8. doi: 10.1002/ana.23819 [13] Piva L, Gavassini BF, Bello L, et al. TGFBR2 but not SPP1 genotype modulates osteopontin expression in Duchenne muscular dystrophy muscle. J Pathol. 2012;228(2):251-9. doi: 10.1002/path.4026
[14] Vieira Natassia M, Elvers I, Alexander Matthew S, et al. Jagged 1 Rescues the Duchenne
Muscular Dystrophy Phenotype. Cell. 2015;163(5):1204-13. doi:
http://dx.doi.org/10.1016/j.cell.2015.10.049
[15] Vieira NM, Spinazzola JM, Alexander MS, et al. Repression of phosphatidylinositol transfer protein alpha ameliorates the pathology of Duchenne muscular dystrophy. Proceedings of the National Academy of Sciences of the United States of America. 2017;114(23):6080-5. doi: 10.1073/pnas.1703556114
[16] Kallestad KM, Hebert SL, McDonald AA, et al. Sparing of extraocular muscle in aging and muscular dystrophies: a myogenic precursor cell hypothesis. Exp Cell Res. 2011;317(6):873-85. doi: 10.1016/j.yexcr.2011.01.018
[17] Duan D. Duchenne muscular dystrophy gene therapy in the canine model. Hum Gene Ther Clin Dev. 2015;26(1):57-69. doi: 10.1089/humc.2015.006
[18] McGreevy JW, Hakim CH, McIntosh MA, et al. Animal models of Duchenne muscular dystrophy: from basic mechanisms to gene therapy. Dis Model Mech. 2015;8(3):195-213. doi: 10.1242/dmm.018424
[19] Yu X, Bao B, Echigoya Y, et al. Dystrophin-deficient large animal models: translational research and exon skipping. Am J Transl Res. 2015;7(8):1314-31.
[20] Ali H, Du Z, Li X, et al. Identification of suitable reference genes for gene expression studies using quantitative polymerase chain reaction in lung cancer in vitro. Molecular medicine reports. 2015;11(5):3767-73. doi: 10.3892/mmr.2015.3159
[21] Fjeldbo CS, Aarnes EK, Malinen E, et al. Identification and Validation of Reference Genes for RT-qPCR Studies of Hypoxia in Squamous Cervical Cancer Patients. PLoS One. 2016;11(5):e0156259. doi: 10.1371/journal.pone.0156259
[22] Liu X, Xie J, Liu Z, et al. Identification and validation of reference genes for quantitative RT-PCR analysis of retinal pigment epithelium cells under hypoxia and/or hyperglycemia. Gene. 2016;580(1):41-6. doi: 10.1016/j.gene.2016.01.001
[23] Palombella S, Pirrone C, Cherubino M, et al. Identification of reference genes for qPCR analysis during hASC long culture maintenance. 2017;12(2):e0170918. doi: 10.1371/journal.pone.0170918
[24] Rho H-W, Lee B-C, Choi E-S, et al. Identification of valid reference genes for gene expression studies of human stomach cancer by reverse transcription-qPCR. BMC Cancer. 2010;10(1):240.
[25] Bages S, Estany J, Tor M, et al. Investigating reference genes for quantitative real-time
PCR analysis across four chicken tissues. Gene. 2015;561(1):82-7. doi:
10.1016/j.gene.2015.02.016
29
[27] Hildyard JC, Wells DJ. Identification and validation of quantitative PCR reference genes suitable for normalizing expression in normal and dystrophic cell culture models of
myogenesis. PLoS Curr. 2014;6. doi:
10.1371/currents.md.faafdde4bea8df4aa7d06cd5553119a6
[28] Li B, Matter EK, Hoppert HT, et al. Identification of optimal reference genes for RT-qPCR in the rat hypothalamus and intestine for the study of obesity. International journal of obesity (2005). 2014;38(2):192-7. doi: 10.1038/ijo.2013.86
[29] Ma KS, Li F, Liang PZ, et al. Identification and Validation of Reference Genes for the Normalization of Gene Expression Data in qRT-PCR Analysis in Aphis gossypii (Hemiptera: Aphididae). Journal of insect science (Online). 2016;16(1). doi: 10.1093/jisesa/iew003
[30] Solano ME, Thiele K, Kowal MK, et al. Identification of suitable reference genes in the mouse placenta. Placenta. 2016;39:7-15. doi: 10.1016/j.placenta.2015.12.017
[31] Bish LT, Sleeper MM, Forbes SC, et al. Long-term systemic myostatin inhibition via liver-targeted gene transfer in golden retriever muscular dystrophy. Hum Gene Ther. 2011;22(12):1499-509. doi: 10.1089/hum.2011.102
[32] Galindo CL, Soslow JH, Brinkmeyer-Langford CL, et al. Translating golden retriever muscular dystrophy microarray findings to novel biomarkers for cardiac/skeletal muscle function in Duchenne muscular dystrophy. Pediatr Res. 2016;79(4):629-36. doi: 10.1038/pr.2015.257
[33] Wuebbles RD, Sarathy A, Kornegay JN, et al. Levels of alpha7 integrin and laminin-alpha2 are increased following prednisone treatment in the mdx mouse and GRMD dog models of Duchenne muscular dystrophy. Dis Model Mech. 2013;6(5):1175-84. doi: 10.1242/dmm.012211
[34] Robriquet F, Lardenois A, Babarit C, et al. Differential Gene Expression Profiling of Dystrophic Dog Muscle after MuStem Cell Transplantation. PLoS One. 2015;10(5):e0123336. doi: 10.1371/journal.pone.0123336
[35] Kornegay JN, Bogan DJ, Bogan JR, et al. Dystrophin-deficient dogs with reduced myostatin have unequal muscle growth and greater joint contractures. Skelet Muscle. 2016;6:14. doi: 10.1186/s13395-016-0085-7
[36] Nghiem PP, Hoffman EP, Mittal P, et al. Sparing of the dystrophin-deficient cranial sartorius muscle is associated with classical and novel hypertrophy pathways in GRMD dogs. Am J Pathol. 2013;183(5):1411-24. doi: 10.1016/j.ajpath.2013.07.013
[37] Cotten SW, Kornegay JN, Bogan DJ, et al. Genetic myostatin decrease in the golden retriever muscular dystrophy model does not significantly affect the ubiquitin proteasome system despite enhancing the severity of disease. Am J Transl Res. 2013;6(1):43-53.
[38] Camerino GM, Cannone M, Giustino A, et al. Gene expression in mdx mouse muscle in relation to age and exercise: aberrant mechanical-metabolic coupling and implications for pre-clinical studies in Duchenne muscular dystrophy. Hum Mol Genet. 2014;23(21):5720-32. doi: 10.1093/hmg/ddu287
[39] Feder D, Rugollini M, Santomauro A, Jr., et al. Erythropoietin reduces the expression of myostatin in mdx dystrophic mice. Braz J Med Biol Res. 2014;47(11):966-71.
[40] Spassov A, Gredes T, Gedrange T, et al. Differential expression of myosin heavy chain isoforms in the masticatory muscles of dystrophin-deficient mice. Eur J Orthod. 2011;33(6):613-9. doi: 10.1093/ejo/cjq113
[41] Bustin SA, Benes V, Garson JA, et al. The MIQE guidelines: minimum information for publication of quantitative real-time PCR experiments. Clin Chem. 2009;55(4):611-22. doi: 10.1373/clinchem.2008.112797
30
[43] Schmittgen TD, Zakrajsek BA. Effect of experimental treatment on housekeeping gene expression: validation by real-time, quantitative RT-PCR. Journal of Biochemical and Biophysical Methods. 2000;46(1–2):69-81. doi: http://dx.doi.org/10.1016/S0165-022X(00)00129-9
[44] Thellin O, Zorzi W, Lakaye B, et al. Housekeeping genes as internal standards: use and limits. Journal of Biotechnology. 1999;75(2–3):291-5. doi: http://dx.doi.org/10.1016/S0168-1656(99)00163-7
[45] Brinkmeyer-Langford C, Balog-Alvarez C, Cai JJ, et al. Genome-wide association study to identify potential genetic modifiers in a canine model for Duchenne muscular dystrophy. BMC Genomics. 2016;17:665. doi: 10.1186/s12864-016-2948-z
[46] Walmsley GL, Arechavala-Gomeza V, Fernandez-Fuente M, et al. A duchenne muscular dystrophy gene hot spot mutation in dystrophin-deficient cavalier king charles spaniels is
amenable to exon 51 skipping. PLoS One. 2010;5(1):e8647. doi:
10.1371/journal.pone.0008647
[47] Vandesompele J, De Preter K, Pattyn F, et al. Accurate normalization of real-time quantitative RT-PCR data by geometric averaging of multiple internal control genes. Genome Biology. 2002;3(7):research0034.1 - research.11.
[48] Andersen CL, Jensen JL, Ørntoft TF. Normalization of Real-Time Quantitative Reverse Transcription-PCR Data: A Model-Based Variance Estimation Approach to Identify Genes Suited for Normalization, Applied to Bladder and Colon Cancer Data Sets. Cancer Research. 2004;64(15):5245-50. doi: 10.1158/0008-5472.can-04-0496
[49] Pfaffl M, Tichopad A, Prgomet C, et al. Determination of stable housekeeping genes, differentially regulated target genes and sample integrity: BestKeeper – Excel-based tool using
pair-wise correlations. Biotechnology Letters. 2004;26(6):509-15. doi:
10.1023/b:bile.0000019559.84305.47
[50] Kornegay JN. The golden retriever model of Duchenne muscular dystrophy. Skeletal muscle. 2017;7(1):9. doi: 10.1186/s13395-017-0124-z
[51] Craig SP, 3rd, Eakin AE. Purine phosphoribosyltransferases. The Journal of biological chemistry. 2000;275(27):20231-4. doi: 10.1074/jbc.R000002200
[52] Webster C, Silberstein L, Hays AP, et al. Fast muscle fibers are preferentially affected in Duchenne muscular dystrophy. Cell. 1988;52(4):503-13. doi: http://dx.doi.org/10.1016/0092-8674(88)90463-1
[53] http://ds.biogps.org/?dataset=GSE1133&gene=567. [54] http://ds.biogps.org/?dataset=GSE10246&gene=12010.
[55] Zammit PS, Carvajal JJ, Golding JP, et al. Myf5 expression in satellite cells and spindles in adult muscle is controlled by separate genetic elements. Dev Biol. 2004;273(2):454-65. doi: 10.1016/j.ydbio.2004.05.038
31
Tables
Gene Name Full name
HPRT1 Hypoxanthine phosphoribosyltransferase 1
18S 18S ribosomal RNA
RPL13a Ribosomal protein L13 SDHA Succinate dehydrogenase subunit A YWHAZ2 Tyrosine 3-Monooxygenase/Tryptophan
5-Monooxygenase Activation Protein, Zeta
B2M Beta 2 Microglobulin
UBC Ubiquitin C
ActB Beta Actin
32
All
samples Dystrophic Healthy
Natural History (all) Natural history (dystrophic) Natural history (healthy) Muscle Panel (all) Muscle Panel (dystrophic) Muscle Panel (healthy) Most stable (Best Pair) HPRT + RPL13a HPRT + RPL13a HPRT + RPL13a HPRT + RPL13a HPRT + RPL13a RPL13a + 18S HPRT + RPL13a HPRT + RPL13a HPRT + RPL13a
SDHA SDHA SDHA 18S 18S HPRT SDHA SDHA UBC
18S 18S 18S SDHA UBC SDHA 18S 18S SDHA
UBC YWHAZ2 B2M UBC SDHA UBC YWHAZ2 YWHAZ2 YWHAZ2
YWHAZ2 B2M UBC B2M B2M B2M UBC B2M 18S
B2M UBC YWHAZ2 YWHAZ2 YWHAZ2 YWHAZ2 B2M UBC ActB Least
stable ActB ActB ActB ActB ActB ActB ActB ActB UBC
Table 2: geNorm rankings
33
Table 3: Bestkeeper rankings
Bestkeeper results for the entire dataset or subsets (as indicated), ranked (top to bottom) by Pearson correlation (r) to the ‘bestkeeper’. Bold: r >= 0.75; italics: r < 0.4
All
samples Dystrophic Healthy
Natural History
(all)
Natural history (dystrophic)
Natural history (healthy)
Muscle Panel
(all)
Muscle Panel (dystrophic)
Muscle Panel (healthy) Most
stable B2M B2M B2M SDHA SDHA B2M B2M HPRT RPL13a
SDHA HPRT SDHA HPRT B2M SDHA YWHAZ2 B2M HPRT
YWHAZ2 SDHA YWHAZ2 B2M HPRT HPRT HPRT RPL13a SDHA
HPRT YWHAZ2 UBC YWHAZ2 UBC YWHAZ2 RPL13a YWHAZ2 B2M
RPL13a RPL13a HPRT UBC YWHAZ2 UBC SDHA SDHA YWHAZ2
UBC 18S ActB RPL13a 18S RPL13a 18S 18S UBC
18S ActB RPL13a 18S RPL13a ActB ActB ActB 18S
Least
34
All
samples Dystrophic Healthy
Natural History (all) Natural history (dystrophic) Natural history (healthy) Muscle Panel (all) Muscle Panel (dystrophic) Muscle Panel (healthy) Most
stable SDHA SDHA SDHA SDHA SDHA SDHA SDHA YWHAZ2 RPL13a
HPRT YWHAZ2 HPRT HPRT YWHAZ2 HPRT HPRT 18S SDHA YWHAZ2 HPRT B2M YWHAZ2 HPRT B2M YWHAZ2 SDHA UBC
RPL13a 18S UBC UBC B2M RPL13a RPL13a HPRT YWHAZ2
18S B2M RPL13a 18S UBC UBC 18S B2M HPRT
UBC RPL13a YWHAZ2 RPL13a 18S YWHAZ2 B2M RPL13a 18S
B2M UBC 18S B2M RPL13a 18S UBC UBC ActB
Least
stable ActB ActB ActB ActB ActB ActB ActB ActB B2M
Table 4: Normfinder rankings (ungrouped)
Normfinder results for the entire ungrouped dataset or subsets (as indicated), ranked (top to bottom) from highest scoring (lowest stability value) to lowest scoring. Bold: stability <0.5; italics: stability > 1.0
All Samples Dystrophic Healthy
Age Animal Disease Litter Age Animal Litter Age Animal Litter Best pair SDHA + YWHAZ2 SDHA + YWHAZ2 SDHA + YWHAZ2 HPRT + YWHAZ2 SDHA + YWHAZ2 SDHA + YWHAZ2 HPRT + YWHAZ2 SDHA + B2M SDHA + B2M SDHA + B2M Most
stable SDHA SDHA HPRT SDHA SDHA SDHA SDHA SDHA B2M B2M
HPRT HPRT 18S HPRT YWHAZ2 YWHAZ2 YWHAZ2 B2M SDHA SDHA
B2M YWHAZ2 RPL13a UBC B2M HPRT HPRT HPRT HPRT HPRT
YWHAZ2 18S SDHA YWHAZ2 HPRT B2M B2M UBC 18S 18S
18S B2M UBC 18S UBC 18S UBC YWHAZ2 UBC RPL13a
RPL13a RPL13a YWHAZ2 RPL13a RPL13a RPL13a 18S RPL13a RPL13a UBC
UBC UBC ActB B2M 18S UBC RPL13a 18S YWHAZ2 YWHAZ2
Least
stable ActB ActB B2M ActB ActB ActB ActB ActB ActB ActB Table 5: Normfinder rankings (grouped)
35
Figure Legends
Figure 1: geNorm analysis
Representative outputs of the geNorm algorithm. geNorm ranking (left to right: least stable to most stable) for the entire dataset (a); or for our healthy muscle panel only (b). Dashed line indicates accepted threshold for use as a reference gene (M<0.5).
Figure 2: BestKeeper analysis
Representative outputs of the BestKeeper algorithm. Coefficient of correlation values for the reference gene candidates are shown for the entire dataset (a) or healthy muscle panel (b) samples, ranked (left to right) from least stable to most stable.
Figure 3: Normfinder analysis (ungrouped)
Representative outputs of the Normfinder algorithm. Stability values (left to right: least stable to most stable) for the reference gene candidates are shown for the entire dataset (a) or for our healthy muscle panel (b).
Figure 4: Dystrophy-associated gene expression
Expression data for (a) B2M, (b) Myf5 and (c) MEF2C in cDNA prepared from Vastus lateralis muscle samples, normalized using the geometric mean of SDHA, RPL13a and HPRT1. Data shown as individual samples (●), and means +/- SEM. N=13:9 (healthy:DMD). **: P<0.005; ***:P<0.001,****:P<0.0001, (Mann-Whitney U test).
Figure 5: Correlation in relative gene expression of high scoring candidates
36
Figures
37
Figure 2
38
39
40
Supplementary Material:
Supplementary information 1:
Strengths and weaknesses of reference gene assessment software packages:
geNorm: geNorm analysis employs an iterative pairwise approach, assessing all genes for pairwise variation in expression across the dataset, discarding the lowest scoring, then repeating the analysis until only a pair of genes remains. The resulting scores are presented as a ranked list of expression stability. In essence, this method determines which two genes show the most closely shared pattern of variation, and how closely the other candidate genes mirror this variation. As such, this method is relatively tolerant of ‘noisy’ datasets: the extent of variation between individual samples is less important than the extent to which any given genes share this variation. This method is not without caveats, however: pairwise scoring is highly sensitive, and omission or inclusion of a single outlying sample can ‘reshuffle’ the scoring entirely. Perhaps counter-intuitively, consistently noisy datasets are handled well, while relatively stable expression datasets with scant outliers must be handled with caution. In addition, the geNorm scoring necessarily assumes that the variation observed is due solely to differences in RNA extraction/cDNA synthesis rather than genuine differences in gene expression, and thus places the onus on the operator to employ a panel of candidate genes sufficiently diverse as to show no significant functional overlap: two genes associated with muscle repair would be expected to score highly via geNorm simply because both genes are subject to similar transcriptional regulation.
The geNorm software (as originally released) is no longer freely available, instead having been integrated into the commercial qBase software package (http://www.biogazelle.com/qbaseplus), however a Microsoft-office compatible copy of the original excel macro is available at http://ulozto.net/xsFueHSA/genorm-v3-zip.
Bestkeeper: the Bestkeeper method adopts a different correlation-based approach, instead taking the individual Cq values for each sample, for all candidate reference genes, and generating the geometric mean: the bestkeeper value. The bestkeeper dataset thus represents the consensus change in expression, between samples, for the dataset as a whole. By comparing the correlation of individual candidate genes with this bestkeeper, the individual genes that best reflect the behaviour of the entire dataset can be determined. As with geNorm, this approach assumes the panel of candidate genes do not share transcriptional regulation, but as the ‘bestkeeper’ values are derived from multiple genes, the method is less sensitive to individual sample outliers. Instead, this method potentially exhibits sensitivity to individual poorly-stable genes (rather than individual samples), favouring the use of a reasonably large panel of candidate reference genes (at least 5-6, ideally more). The bestkeeper spreadsheet can be obtained from http://www.gene-quantification.de/bestkeeper.html
41
favours less noisy datasets, it eliminates pairwise/correlation-based scoring and is thus inherently less sensitive to addition or removal of specific genes, relaxing the requirement for truly independently-regulated candidates. As such, it offers a valuable counterpart to the strictly correlation-based approaches of geNorm and Bestkeeper. Moreover, the algorithm’s facility for group-based analysis is particularly powerful when combined with large datasets capable of being grouped by multiple criteria.
The Normfinder plugin can be obtained from http://moma.dk/normfinder-software
Supplementary information 2:
Supplementary info 2.doc
Supplementary Figures:
Supplementary figure 1: Animals/muscles used in this study
Left hand schematic: Animal IDs and ages at biopsy collection. Filled segments indicate muscle samples: Dystrophic samples in dark grey, healthy in light grey. Littermates are indicated by matching letters. D1 and D2 (lower box: cross-hatched segments) were not enrolled on the natural history study, but were euthanized at 14 and 17 months of age respectively.
42
Supplementary figure 2: Cq distribution and coverage
Mean Cq values for every sample, for every gene (as indicated). Lower Cq values indicate higher expression. Dots: sample Cq values; Boxes: 25th/75th percentiles; Whiskers: minimum
and maximum values.
Supplementary figure 3: geNorm analysis (pairwise rankings)