COVID19: A Natural Language Processing and Ontology
Oriented Temporal Case-Based Framework for Early Detection
and Diagnosis of Novel Coronavirus
Olaide N. Oyelade1,2, Absalom E. Ezugwu2
1Department of Computer Science, Ahmadu Bello University Zaria, Nigeria
2School of Computer Science, University of KwaZulu-Natal, King Edward Avenue, Pietermaritzburg Campus, Pietermaritzburg, 3201, KwaZulu-Natal, South Africa
Corresponding authors emails: {[email protected], [email protected]}
Abstract:
Coronavirus, also known as COVID-19, has been declared a pandemic by the World Health Organization (WHO). At the time of conducting this study, it had recorded over 1.6million cases while more than 105,000 have died due to it, with these figures rising on a daily basis across the globe. The burden of this highly contagious respiratory disease is that it presents itself in both symptomatic and asymptomatic patterns in those already infected, thereby leading to an exponential rise in the number of contractions of the disease and fatalities. It is therefore crucial to expedite the process of early detection and diagnosis of the disease across the world. The case-based reasoning (CBR) model is an effective paradigm that allows for the utilization of cases’ specific knowledge previously experienced, concrete problem situations or specific patient cases for solving new cases. This study therefore aims to leverage the very rich database of cases of COVID-19 to interpret and solve new cases even at their early stage to the advanced stage. The approach adopted in this study employs a natural language processing (NLP) technique to parse records of cases and thereafter formalize each case which is represented as a mini-ontology file. The formalized case is therefore parsed into a CBR model to allow for classification of the case into positive or negative to COVID-19. Meanwhile, feature extraction for each case is done by classifying tokens extracted by the NLP approach into special, temporal and thematic classes before encoding them using an ontology modeling method. The CBR model therefore leverages on the formalized features to compute the similarity of the new case with extracted similar cases from the archive of the CBR model. The proposed framework was populated with 68 cases obtained from the Italian Society of Medical and Interventional Radiology (SIRM) repository. Results obtained revealed that the proposed approach leverages on locations (spatial) and time (temporal) of contagion to successfully detect cases even in their early stages of two days onward before the incubation period of fourteen days. The proposed framework achieved an accuracy of 97.10%, sensitivity of 0.98 and specificity of .066. The study found that the proposed model can assist physicians to easily diagnose and isolate cases, thereby minimizing the rate of contagion and reducing false diagnosis as observed in some parts of the globe.
Keywords: Coronavirus, case-based reasoning, ontology, natural language processing.
1.0 Introduction
The novel coronavirus disease, also referred to as COVID-19, was first identified in China in December 2019. The virus has so far affected 213 countries and territories around the world and 2 international conveyances and is now considered a major global health concern due to its pathogenicity and widespread distribution around the world. The Covid-19 virus is a highly contagious respiratory disease that has raced around the globe since it first emerged in China in late December 2019. According to the World Health Organisation’s official reports on COVID-19 [13], by April 21, 2020, it had affected more than 2,482,598 million people and caused more than 170,484 deaths, with a total of 652,543 recovered. Considering the exponential growth in the confirmed and death cases of COVID-19, this has expedited efforts by the scientific and research community in proposing and developing several novel epidemiological model approaches to mitigate the spread of the COVID-19 outbreak.
Preprints (www.preprints.org) | NOT PEER-REVIEWED | Posted: 10 May 2020 doi:10.20944/preprints202005.0171.v1
A number of mathematical and statistical models have been developed recently to critically analyze the transmission pattern of the ongoing COVID-19 and other related disease outbreaks [14, 15, 16, 17, 18, 19]. It is equally important to recognize all the different epidemiological contributions towards estimating the transmission dynamics of the virus, but most of the existing proposed models are parameter dependent and they rely mainly on multiple assumptions [20] for them to be effective. Moreover, because during an outbreak of any epidemic, it is often not easy and reliable to estimate parameters using real data sets, which are not readily available for experimental testing of such proposed models [21, 22]. Furthermore, in most of the reported model parameter settings, one can discover that rather than using the actual parameter values that seem close enough to the real-world values derived from the statistical properties of the actual data sets, the authors of those models opted to use hypothesized parameter values. However, the use of hypothesized parameters in this case is highly limited because it does not fit the data very well [20]. Therefore, considering the aforementioned challenges associated with the current existing mathematical and statistical epidemiological models, it would be very difficult to attribute any high predictive accuracy level for using these models to correctly estimate and forecast the exponential growth of COVID-19 outbreaks. As it stands for now, despite all these measures and attractive modeling proposals, the virus has maintained its capacity to spread exponentially from country to country and continent to continent stretching the functionality and capability of even the most robust healthcare systems of so many countries.
Although many related artificial intelligence (AI) based proposed studies in the literature appear to be well-designed for the tasks of handling the current coronavirus pandemic in terms of estimating confirmed cases and forecasting the speed of COVID-19 spread, these models may deteriorate in performance and accuracy due to their heavy reliance on many inaccurate decision variables and imprecise parameter estimations. Thus, it is assumed that the aforementioned limitations can lead to conflicting forecasting outcomes, which may invariably lead to unsatisfactory and imprecise results. This would obviously have a negative impact on public health planning and policy making. To overcome the limitations of the aforementioned existing epidemiological and AI-based model approaches, the current paper presents a promising alternative diagnostic and forecasting framework with the aim to achieve more accurate results and avoid the previous limitations by combining the strengths of ontology-based natural language processing with case-based reasoning for early detection and diagnosis of the novel coronavirus pandemic. The rich database of cases of confirmed COVID-19 supports the adoption of case-based reasoning (CBR) paradigm as an authentic reasoning structure for improving diagnosis.
Case based reasoning (CBR) is an artificial intelligence paradigm that has proven to be effective in medical systems, and also exploits the similarity of cases in its knowledge base in providing a solution to a new case or problem. Case(s) retrieval that is closely related with the new case is usually computed using different similarity computational models like Euclidean distance which have been adopted by different researches. However, CBR systems all have the challenge of features extraction and formalization. Furthermore, the choice of selecting the best distance measure model for computing similarity of cases is a problem demanding optimal solution considering the sensitivity of medical cases. Case-based reasoning means using old experiences to understand and solve new problems. In case-based reasoning, a reasoner remembers a previous situation similar to the current one and uses that to solve the new problem [59]. Case-based reasoning (CBR) and expert systems have a long tradition in artificial intelligence. CBR has been formulated since the late 1970s. CBR is an approach for problem solving and learning of humans and computers [60]. Case-based reasoning is useful in problem solving and automation of learning by an agent. Because empirical evidence has shown that reasoning with CBR is more powerful, this has made reasoning by re-using past cases a powerful and frequently applied way to solve problems for humans. A very important feature of case-based reasoning is its coupling to learning, and its strong association with machine learning [61]. Ben-Bassat, et al. [62] enumerated some features of CBR, and these include: cases that present similar symptoms and findings results from same faults/disease, and “Nearest Neighbor” algorithm is used to identify unknown diagnosis from the known. CBR is beneficial when compared to RBR. CBR avoids the knowledge based acquisition bottleneck of RBR, it compiles past solutions, mimics the diagnostic experience of human experts, avoids past mistakes, interprets rules, supplements weak domain models, facilitates explanation, supports knowledge acquisition and learning, and exploits the database of solved problems so as to learn.
implemented. The originality of the current study lies in the robustness and efficiency of the sentence-level extraction of feature-value pair for all a-priori declared features. Furthermore, the case retrieval similarity metric applied to the proposed NPL-based CBR framework contributes to the interesting performance of the proposed system. Specifically, the technical contributions of this study are as follows:
i. Adapt standard NLP techniques and libraries for carrying out data/input pre-processing. This allows for the cleaning and reformatting of natural language-based patient records using NLP approach.
ii. The pre-processed data was then applied to techniques for extraction of features of COVID-19 disease. This extracted feature provides the CBR framework with tokens as input to support case-based operations. iii. To provide support for computational data representational approach, we formalized the extracted features
using ontologies.
iv. We developed a CBR framework which allows for detecting/classifying suspected cases COVID-19 as either positive or negative.
The remainder of the paper is organized into six sections, namely: the related works, proposed approach, experimentation, results, discussion, and conclusion. The related works section presents a comprehensive review of related studies and bibliometric analysis study of research activities on COVID-19. In Section 3, a detail of the approach proposed for the CBR framework is presented, while Section 4 discusses the experimentation and system configuration for the experimentation. In Section 5, we present a comparison of the performance of the proposed approach with some related studies, and then conclude the study in Section 6.
2.0 Related Works
This section consists of two parts; the first part covers the detailed review of all the current related work that has so far been implemented to handle the ongoing novel coronavirus. The second part deals with the aspect of bibliometric analysis of the existing literature on COVID-19.
2.1. Related Work
In recent times, artificial intelligence (AI) has been considered as a potentially powerful tool in the fight against many evolving pandemics such Ebola hemorrhagic fever (2014-2016), Swine flu (2002-2003), SARS (2002-2003), Middle East respiratory syndrome coronavirus (MERS-CoV) (2012-present), and novel coronavirus (COVID-19) (2019-ongoing). Regarding the ongoing 2019-2020 novel coronavirus pandemic, dozens of research efforts have emerged and most of the published papers focused on the important of harnessing artificial intelligence technologies to curb the global COVID-19 Pandemic. This section provides a selective review of recent articles that have discussed the many significant contributions of the application of AI technologies in the fight against COVID-19, as well as the current constraints on these contributions. Specifically, in [1], six areas where artificial intelligence technologies have emerged as key solutions to combatting coronavirus were identified. These areas include: i) early warnings and alerts, ii) tracking and prediction, iii) data dashboards, iv) diagnosis and prognosis, v) treatments and cures, and vi) social control. Therefore, most of the subsequent discussions presented in this section are focused on investigating to what extent AI has been partly or fully utilized in combatting the spread of the aforementioned pandemic. The selected review discussions presented in this section only cover those articles that have been published in a peer reviewed journal. Preprinted articles are outside the scope of the current review discussion.
In [2] the analysis of confirmed cases of COVID-19 through a binary classification using artificial intelligence and regression analysis was investigated. In their study, the authors employed the binary classification modelling with group method of data handling type of neural network as one of the artificial intelligence methods of accurately predicting confirmed cases of the COVID-19 epidemic. The study chose the Hubei province in China for their model construction. For the input and output variables, some important factors such as maximum, minimum, and average daily temperature, city density, relative humidity, and wind speed, were considered as the input dataset, while the number of confirmed cases was selected as the output dataset for 30 days. Moreover, the outcome of the investigation revealed that the proposed binary classification model was able to provide a higher performance capacity in predicting the confirmed cases in the province. In addition, the analysis of the results also showed that certain weather conditions based on the input variables, namely relative humidity with an average of 77.9% had a positive impact on the confirmed cases and maximum daily temperature with an average of 15.4 °C had a negative impact on the confirmed cases.
Mohammed, et al. [3] presented the application of two optimization metaheuristic techniques to enhance the predictive performance accuracy of the proposed adaptive neuro-fuzzy inference system that is used for estimating and forecasting the number of confirmed cases of novel coronavirus in the upcoming ten days based on previously confirmed cases that were recorded in China. The developed hybrid metaheuristic based adaptive neuro-fuzzy inference system comprised of Adaptive Neuro-Fuzzy Inference engine and two metaheuristic algorithms namely, flower pollination algorithm and salp swarm algorithm. The enhanced flower pollination algorithm was utilized by the author to train the neuro-fuzzy inference system by optimizing its parameters, while the salp swarm algorithm was incorporated as a local search method to enhance the quality of the solution obtained by the model. The results of the model implementation show that it has a high capability of predicting the number of confirmed cases within the projected ten days. It was further established that the hybrid system, when compared with other methods, obtained more superior performance accuracy in in terms of the following performance metrics: root mean square error, mean absolute error, mean absolute percentage error, root mean squared relative error, and coefficient of determination.
Ting, et al. [4] explored the potential application of four inter-related digital technologies combating the wide spread of the novel coronavirus. These technologies include the Internet of Things, big-data analytics, Artificial Intelligence and blockchain. The authors in their work [4] presented some valid reasons why the four aforementioned digital technologies can be employed to augment the already strained traditional based public-health strategies for tackling COVID-19. Some of the traditional based public healthcare strategies that have been put in place and are constantly being used across the globe include: (1) monitoring, surveillance, detection and prevention of COVID-19; and (2) mitigation of the impact to healthcare indirectly related to COVID-19. The authors further suggested that digital technologies can be helpful in the following ways. The Internet of Things technology can be used to provide a platform that allows public-health agencies access to data for monitoring the COVID-19 pandemic. The big data technology can be very useful in providing opportunities for performing modelling studies of viral activity and for guiding an individual country’s healthcare policymakers to enhance preparation for the outbreak. The blockchain technology can be vital in the manufacturing and distribution of COVID-19 vaccines once they are available. Similarly, blockchain can be utilized to facilitate the distribution of patients’ regular medication to the local pharmacy or patients’ doorstep. The AI and deep learning technology can be used to enhance the detection and diagnosis of COVID-19. Further, the utilization of various AI-based triage systems could potentially alleviate the clinical load of physicians.
Vaishya, et al. [5] in their study highlighted the significant roles that some of the new technologies such as artificial intelligence, Internet of Things, Big Data and Machine Learning are likely to play in the fight against the new diseases and also the possible forecasting of any pandemics. The authors in [5] focused on presenting a brief review regarding the utilization of artificial intelligences platforms as a decisive technology to analyze, prepare us for prevention and fight against COVID-19 and any other similar pandemics. In their findings, seven significant application areas of artificial intelligence technology were identified for tackling the spread of COVID-19 disease. These areas as mentioned in [5] include: early detection and diagnosis of the infection, monitoring the treatment, projection of cases and mortality, development of drugs and vaccines, reducing the workload of healthcare workers, and prevention of the disease. Furthermore, the technology was also identified as having the capability to detect clusters of cases and predict the possible location of the virus spread through collecting and analyzing all previous data.
The CBR is an appropriate methodology to apply in the diagnosis and treatment of wide range of health issues. Research in CBR has grown to an extent, starting from the early exploration in the medical field by Koton [7], Bareiss [8] in the late 1980s and Gierl, et al. [9] in the late 1990s. However, there are still some associated shortcomings with the design and implementation of CBR, especially in the adaptation mechanism. Blanco, et al. [10] reported the results of a systematic review of CBR application to the health sector. In their work, the authors proposed some enhancement procedures that could be applied to overcome some of the limitations of CBR, which is focused on preparing the data to create association rules that help to reduce the number of cases and facilitate learning of adaptation rules.
CBR has equally received noticeable attention in the aspect of disease predictions and diagnosis. In [11], a hybrid implementation of neural networks and case-based reasoning was proposed for the prediction of chronic renal disease among the Colombian population. The neural network-based classifier which was trained with the demographic data and medical care information of two population groups was developed to predict whether a person is at risk of developing chronic kidney disease. The result of the classifier showed that about 3,494,516 people were identified as being at risk of developing chronic renal disease in Colombia, which in this case is 7% of the total population.
Benamina, et al. [12] proposed the integration of fuzzy logic and data mining technique to improve the response time and the accuracy of the retrieval step of case-based reasoning of similar cases. The Fuzzy CBR proposed in [12] is composed of two complementary parts, namely, the part of classification by fuzzy decision tree realized by Fispro and the part of case-based reasoning realized by the platform JColibri. The main function of fuzzy logic is to reduce the complexity of calculating the degree of similarity that can exist between diabetic patients who require different monitoring plans. The authors compared their results with some existing classification methods using accuracy as performance metrics. The experimental result that was generated by the proposed system revealed that the fuzzy decision tree is very effective in improving the accuracy for diabetes classification and hence improving the retrieval step of CBR reasoning.
Table 1 presents a concise summary of all published work on mathematical modeling, statistical modeling and simulation based literature on COVID-19 that appeared in Web of Science database. Each paper information is represented based on the article authors’ details in column two, paper title in column three and reference in column four. Overall, sixteen publications were retrieved from the Web of Science database.
Table 1: Summary of all published related modeling and simulation based work on COVID-19 from Web of Science
SN Author Title ref
1 Rao, Arni S. R. Srinivasa; Krantz, Steven
G.; Kurien, Thomas; et al. Model-based retrospective estimates for COVID-19 or coronavirus in India: continued efforts required to contain the virus spread
[23]
2 Buonomo, Bruno Effects of information-dependent vaccination behavior on coronavirus outbreak: insights from a SIRI model
[24]
3 Kim, Soyoung; Kim, Yae Jean; Peck, Kyong
Ran; et al. School Opening Delay Effect on Transmission
Dynamics of Coronavirus Disease 2019 in Korea: Based on Mathematical Modeling and Simulation Study
[25]
4 Hellewell, Joel; Abbott, Sam; Gimma, Amy; et al.
Feasibility of controlling COVID-19 outbreaks by isolation of cases and contacts
[26]
5 Jia, Jiwei; Ding, Jian; Liu, Siyu; et al.
Modeling the control of COVID-19: Impact of policy interventions and meteorological factors
[27]
6 Choi, Sunhwa; Ki, Moran Estimating the reproductive number and the outbreak size of COVID-19 in Korea
[28]
7 Huang, Rui; Liu, Miao; Ding, Yongmei Spatial-temporal distribution of COVID-19 in China and its prediction: A data-driven modeling analysis
[29]
8 Gostic, Katelyn; Gomez, Ana C. R.; Mummah, Riley O.; et al.
Estimated effectiveness of symptom and risk screening to prevent the spread of COVID-19
[30]
9 Wang, Chuanyi; Cheng, Zhe; Yue, Xiao- [31]
Guang; et al. Risk Management of COVID-19 by Universities in China
10 Roosa, Kimberlyn; Lee, Yiseul; Luo, Ruiyan; et al.
Short-term Forecasts of the COVID-19 Epidemic in Guangdong and Zhejiang, China: February 13-23, 2020
[32]
11 Yang, Shu; Cao, Peihua; Du, Peipei; et al.
Early estimation of the case fatality rate of COVID-19 in mainland China: a data-driven analysis
[33]
12 Jiang, Xiangao; Coffee, Megan; Bari, Anasse; et al.
Towards an Artificial Intelligence Framework for Data-Driven Prediction of Coronavirus Clinical Severity
[34]
13 Yin, Fulian; Lv, Jiahui; Zhang, Xiaojian; et
al. COVID-19 information propagation dynamics in the
Chinese Sina-microblog
[35]
14 Zhou, Weike; Wang, Aili; Xia, Fan; et al.
Effects of media reporting on mitigating spread of COVID-19 in the early phase of the outbreak
[36]
15 Yang, Chayu; Wang, Jin
A mathematical model for the novel coronavirus epidemic in Wuhan, China
[37]
16 Rong, Xinmiao; Yang, Liu; Chu, Huidi; et
al. Effect of delay in diagnosis on transmission of
COVID-19
[38]
17 Hou, Can, Jiaxin Chen, Yaqing Zhou, Lei Hua, Jinxia Yuan, Shu He, Yi Guo et al.
The effectiveness of the quarantine of Wuhan city against the Corona Virus Disease 2019 (COVID‐19): well‐mixed SEIR model analysis
[39]
18 Prem, Kiesha, Yang Liu, Timothy W. Russell, Adam J. Kucharski, Rosalind M. Eggo, Nicholas Davies, Stefan Flasche et al.
The effect of control strategies to reduce social mixing on outcomes of the COVID-19 epidemic in Wuhan, China: a modelling study
[40]
19 Ho, Dean Addressing COVID‐19 Drug Development with
Artificial Intelligence.
[41]
20 Shi, Feng, Jun Wang, Jun Shi, Ziyan Wu, Qian Wang, Zhenyu Tang, Kelei He, Yinghuan Shi, and Dinggang Shen
Review of artificial intelligence techniques in imaging data acquisition, segmentation and diagnosis for Covid-19
[42]
21 Kim, Donghyun, Soyoung Hong, Sungwoo Choi, and Taeseon Yoon.
Analysis of transmission route of MERS coronavirus using decision tree and Apriori algorithm
[43]
2.2. Bibliometric Analysis of COVID-19 Research Activities
The bibliographic coupling between the top 25 authors is shown in Figure 1. The two clusters, namely red and green, correspond with all the authors working on similar research fields “COVID-19” and citing the same source in their reference listings. The similarity in cluster color for the authors also implies that the degree of overlap between the reference lists of publications of these authors is greater. Shown in Figure 1 are names which are visible; there are possibly other names which are not represented in the constructed map.
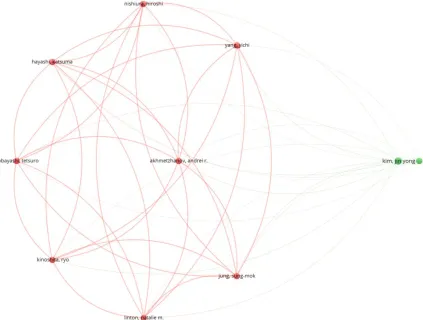
Figure 2 shows the bibliographic coupling of the top most productive countries. Here, bibliographic coupling indicates that there is a more common reference list in the papers published by these countries. There are clearly five clusters, which are represented by five colors, namely, the blue color with China and USA having the highest strength in terms of contribution, green color with England and Italy having the highest strength, red color with India and Germany having the highest strength, lemon color with Japan as the highest contributor and purple color with Switzerland as the only contributing country. The link between the blue and green clusters can be seen to be thicker compared to the link between the blue and red clusters or between the blue and purple clusters. The thickness of the link simply depicts the degree of intersection of the literature work between the different locations or countries.
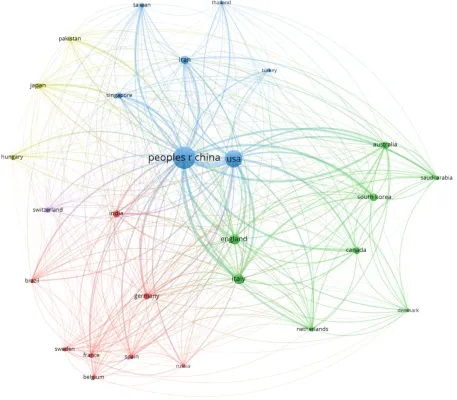
Figure 3 shows the bibliographic coupling of the network of collaborating institutions that were affiliated with at least four documents on COVID-19 research. From the map construction and analysis, of the 949 institutions, 28 meet the thresholds of collaborating institutions, including Huazhong University of Science and Technology, Wuhan University, Capital Medical University, Chinese Academy of Medical Sciences, University of Hong Kong, Sun Yat-Sen University, and Fudan University. There are four clusters identified by blue, red, green and lemon colors. It can be observed that the institutions that fall under the same clusters appear to have similar literature background or worked on related research fields.
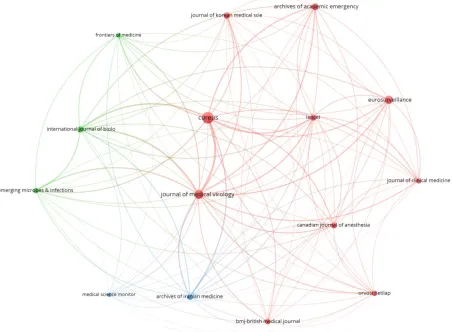
Bibliographic coupling between the journals implies that the papers published in these journals have more common reference lists. Clearly there are three clusters that are depicted on the map with red, blue, and green colors. The links with highest strength occurs between the Journal of Medical Virology and Cureus Journal of Medical Science. This is closely followed by the links between Medical Virology and Cureus and Eurosurveillance Journal, Archive of Academic Emergency Medicine, Journal of Korean Medical Science and Lancet. The medical science monitor and archive Iranian medicine form the weakest networks of cluster. Figure 4 below clearly illustrates the bibliographic coupling between the considered journals.
Figure 2: Bibliographic coupling among the countries
Figure 4: Bibliographic coupling among the Journals
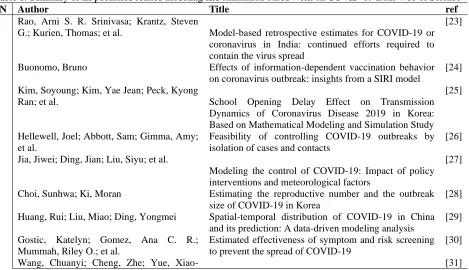
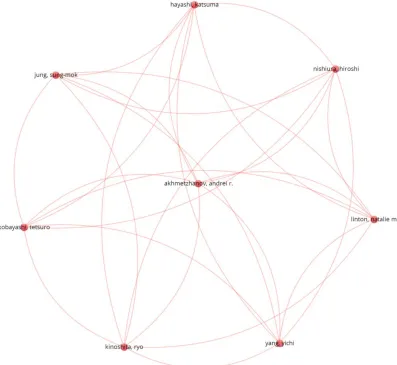
Figure 5 illustrates the co-authors and authors map visualization. The essence of this analysis is to produce the visualization of all the major authors publishing together or working on similar research fields. Here, the analysis type is co-authorship and the unit of analysis is authors. The threshold of minimum number of papers by an author is 25. From the network construction and analysis, of 2,381 authors, only 9 authors meet the thresholds. However, the largest set of connected entities consists of only 8 authors, whose visual representation is depicted in Figure 5. From the figure, there is only one cluster denoted by red color. The connected link depicts that these authors have collaborated on the same project or worked on the same research with a similar focus. The thickness of the link between these three authors indicates more common publications.
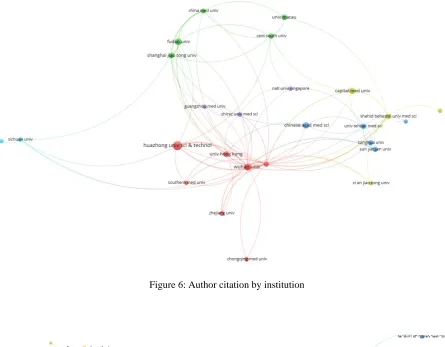
Figure 6 illustrates the citation analysis among authors’ institutions. There are six clusters represented with different colors. The red colored cluster has the highest number of authors citations from two institutions, namely, Huazhong University of Science and Technology and Wuhan University. Figure 7 shows the bibliometric analyses of author citations by journal sources. A link between two journal sources indicates the citation connectivity between the two source. Moreover, the connected links between say Cureus journal and Lancet in Figure 7 clearly reveals that either a publication from Cureus has cited another publication that was published in Lancet journal or otherwise. The thickness and link strength signifies more numbers of citation among the clusters. Therefore, among the different clusters identified in the analysis, Medical Virology and Cureus journals are the top cited source by publication from other journal sources.
Figure 6: Author citation by institution
Figure 7: Author citation by journal source.
3.0 Proposed Approach
A detail presentation of the methods adopted and adapted in this study is covered in this section: an overview of the entire approach, feature extraction using a natural language processing technique, formalism of cases in the proposed case-based reasoning (CBR) method, and lastly the CBR engine.
3.1 An Overview of the Approach
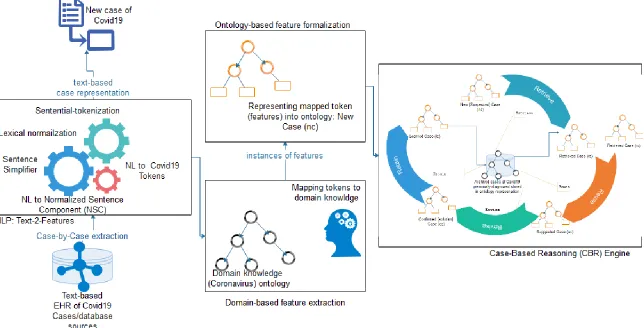
The proposed NLP-Ontology-CBR method accepts a text-based patient file as input for processing of status of the case. Figure 8 presents an illustration of all procedures applied to the inputs denoted by a case file. The case file is passed as input into an NLP Text-2-Features module. This module leverages on some natural language processing operations to synthetically and semantically extract tokens from the case file. The extracted case features are further passed to the domain-based feature extraction component which maps each extract feature at the previous layer to domain-based features. The extracted and mapped features are formalized using description logic (DL) based on a knowledge representation format to allow for efficient computational operations in the CBR engine. Finally, the formalized features are passed on to the CBR-engine as a new case (nc) that support the application of the reasoning paradigm of CBR.
Figure 8: An overview of the proposed framework using case-based reasoning (CBR) model to classify new cases of coronavirus (COVID-19) as either positive or negative
3.2 The NLP Method for Feature Extraction
The field of natural language processing technique is a very interesting and relevant aspect of artificial intelligence (AI) with a wide range of applications to medicine and even the large number of text-based documents on the internet. Moreover, electronic health record (EHR) systems are now pervasive and are provided as services to other automated healthcare delivery systems. The NLP method for feature extraction described in this section adopts some components and algorithms from Dasgupta, et. al. [47]. The ontology learning method is widely used for mining information from natural language text and generating an ontology representation of the mined data. Such ontology representation is to provide formal expressivity and a platform for reasoning with such NP-text document. Although this study assumes a similar procedure, we implemented a skeletal of the entire procedure.
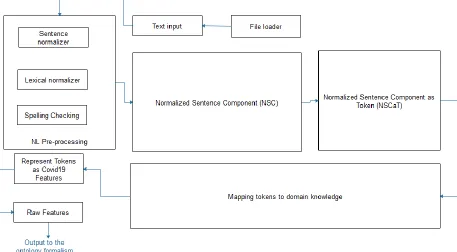
Figure 9 shows the modified model of a patient text-based medical record natural language processing (NLP) and features extraction pipeline. The model is called a pipeline because of its approach of processing raw file-based text (in English language) through different procedures which eventually yields the feature (Covid-Fs) for further processing in the CBR-engine.
Figure 9: A patient text-based medical record natural language processing (NLP) and feature extraction architectural pipeline
The following is a breakdown of the components of the NLP processing pipeline as shown in Figure 9: a. File loader and Text input (FLTI)
b. NL Pre-processing: Spelling checking, Lexical normalizer, Sentence normalizer c. Normalized Sentence Component (NSC)
d. Normalized Sentence Component as Token (NSCaT) e. Mapping tokens to domain knowledge (MTDK) f. Represent Tokens as COVID-19 Features (RTCF) g. Raw Features Buffer (RFB)
File Loader and Text Input (FLTI): The FLTI is a very simple component with support for file format and safety authentication, file loading and text-content unloaded into a buffer.
Generally, the NL-P is aimed at carrying out operations like spell-corrector, tokenization, sentence boundary detector, text singularizer, POS-tagger, co-reference resolver, and named-entity recognizer (NER) by leveraging on Stanford coreNLP toolkit [48]. Our approach of applying NL-P to the buffered text in FLTI was to allow the spell-corrector to scan through the complete buffer and correct wrongly spelt words and furthermore to allow for efficient and intelligent mining of features from the buffered text - the improved output of FLTI. This was then converted into a token of sentential forms (SF) in list format and then sorted according to their appearance in the original document. In each SFs, we attempted to normalize each plural form of its constituents into a singular form through the use of a singularizer. These SFs were extracted from buffered text using sentence boundary detector and annotated with POS-tagging, and the SFs were preserved in an orderly manner to sustain the semantics of health records. Meanwhile, due to the translation task of the raw text to ontology format, we further employed NER models to identify and mark entities and thereafter their instances which form the elements of taxonomy-box (TBox) and assertion box (Abox) respectively in the resulting ontology. Once the SFs had been pre-processed, we applied them to the next sub-module named lexical normalizer (LN). The use of LN in our study is simply for identification of quantifiers and special symbols (like >, <, =, +, -, and other medical related symbols which may hold meaning in the usage) of subject/objects appearing in the SFs. Our approach in LN allows for such quantifiers/numeric representations and symbols to be normalized into normal forms supportive of the token-to-feature translation in RTCF component of Figure 9. The role of applying the sentence normalizer (SN) is to ensure that very difficult sentences are broken down to simple forms so that an element of SFs, say sfi, is normalized into simpler forms assuming the template of the NSC component to be discussed later. Hence, the resulting simplified sentences of sfi replace it in SFs.
Normalized Sentence Component (NSC): Based on the structural formation of a sentence in English language, a particular template or syntax was described by Dasgupta, et. al. [47] in their study. We adopted two of the templates, namely the simple and complex sentences as listed in the following:
Q1 M1∗ S is-a Q2 M2∗ O
Q1 M1* S Cl1 IS-A Q2 M2* O1 Cl2 IS-A Q3 M3* O2
Q Under-lined notation indicates optional component with at most 1 occurrence in the template e.g. quantification
M* Under-lined notation with asterisk (*) indicates 0 or more consecutive occurrences in the template e.g. adjectives.
Q1 Subject quantifier that includes lexical variations of the set: a, an, the, some, all. Q2 Object quantifier that includes lexical variations of the set: the, some, all. Q3 Object quantifier that includes lexical variations of the set: the, some, all.
M Subject/object/verb modifier; value is restricted to the set: Noun, Adjective, Adverb, Numerical, and Gerund
S Subject; value is restricted to the set: fNN, NNP25, JJ, RB, VBGg O Object; value is restricted to the set: fNN, NNP, JJ, RB, VBGg IS-A Denotes all possible lexical variations.
Cl1 and Cl2 signifies IS-A clausal token and all its variations ‘which’, ‘who’, ‘whose’, ‘whom’, ‘that’.
Finally, we ensured that all the sentences in SFs were adapted to the template described above and then we applied their Template-Fitting algorithm to all elements of SFs.
Normalized Sentence Component as Token (NSCaT): The CBR-engine to be described in Sub-section 3.4 does not expect input in sentential format but tokenized features which maintains its sentence form syntax and semantics. Therefore, each sfi in SFs are further tokenized into a list of raw (un-normalized features) tokens in the form of tij such that i represents the position of the sentence in SFs and j represents the position of the token in the sfi of SFs that is being processed. The output of NSCaT is therefore an irregular 2D array of raw tokens.
and the domain-based lexicon model in this study as shown in Figure 10. The role of the Wordnet lexicon is to generate all likely synonyms of each tij in NSCat. This therefore means that each tij indexes into a sub-array of its synonyms. Thereafter, our mapping algorithm aligns each tij to its respective sub-array.
Represent Tokens as COVID-19 Features (RTCF): The output of MTDK is further refined to assume the standard feature categorization and typing as listed in Table 2. The implication of this is that we attempted to extract known features of COVID-19 from the output of MTDK and assigned their values as illustrated in Figure 11.
Raw Features Buffer (RFB): This last component simply buffers the output of raw features collected from previous layers. The RFs buffered in RFB are then translated into ontology formalism described in Section 4.2.
Figure 10: A lexicon of terminologies representing domain knowledge of COVID-19 in addition to symptoms, treatment, epidemiology, disease case status, and other relevant concepts in the domain
The features described in Table 2 were based on recent studies on COVID-19 that were discussed by Michelen, et al. [49] and Yang, et al. [33].
Table 2: A summary of categorization of coronavirus clinical-based features to be extracted by the domain-based feature extractor
Feature category Feature Name Description of feature Feature
Epidemiological Sex Gender of patient Male/Female
Basic Reproduction - range: 1.5–3.5
Mortality rate - 3%
Incubation time - 4.8 ± 2.6 days
Age of the deaths Median age of death was 75 Range: 48 and 89
BMI Body mass index 23.75 (4.54)
Height - 167 (11.75)
Weight (kg) - 65.92 (18.75)
Age Patient current age 45.11 ± 13.35
Symptom Cough Observed in less than half of the mild cases in the largest included study and in two thirds of cases.
Y | N
Fever The most frequent symptom for mild and moderate cases
< 39.1 °C
Anosmia Stronger predictor of COVID-19 than self-reported fever amongst people in the community
Y | N
Pneumonia Found in severe cases Y | N
Acute respiratory distress syndrome (ARDS)
Found in severe cases. Different forms of ARDS are distinguished based on the degree of hypoxia. When PaO2 is not available, a ratio SpO2/FiO2 ≤ 315 is suggestive of ARDS
Y | N
Organ failure Found in severe cases Y | N
Dyspnea Rare Y | N
Nausea and vomiting Rare Y | N
Headache More frequent in severe cases Y | N
Diarrhoea - Y | N
Respiratory tract infections
- Y | N
Shortness of breath - Y | N
Snotty - Y | N
Rhinorrhea - Y | N
Gastrointestinal symptoms
- Y | N
Muscle pain - Y | N
Loss of appetite - Y | N
PaO2 kpa, range80-100 Numeric value
SaO Ranges between ≥95% Numeric value
Loss of smell Strong prediction Y | N
Heart rate Beats per minute Around 88.63
Systolic pressure Measured in mmgH Around 129.98
Diastolic pressure Measured in mmgH Around 81.69
Fatigue - Y | N
Expectoration Most common Y | N
Septic Shock Deemed the most critical of them all Y | N Sepsis Shock Deemed the most critical of them all Y | N
Sore throat Pain in any pair of breast Y | N
pH Hydrogen ion concentration Around 7.11
Temperature (°C) - >= 37.86
Pharyngeal pain - Y | N
Chest pain/tightness Not frequent, with less than 5% of mild cases Y | N
Abdominal pain - Y | N
Exposure/Travel History
(Spatial/Location)
Contact with people - Y | N
Stay in areas with community spread
- Y | N
Comorbidity Cardio-cerebrovascular - Y | N
(diseases) Digestive system - Y | N
Endocrine diseases - Y | N
Runny nose - Y | N
Malignant tumor - Y | N
Neural system - Y | N
Respiratory system diseases
- Y | N
Laboratory Tests neutrophil (× 10⁹per L) - range 1.8–6.3
Leucocyte (× 10⁹per L) - range 3.5–9.5
Lymphocyte (× 10⁹ per L) - range 1.1–3.2
platelet (× 10⁹ per L) - range 125–350
Blood coagulation - Active partial thrombin time
- range 22–36
Prothrombin time - range 10–13.5
D-dimer - range <0.55
albumin - range 35–57
ALT (IU/L) - range 0–64
AST ((IU/L) - range 8–40
Total bilirubin (μmol/L) - range 4.7–24
Urea nitrogen (mmol/L) - range2.6–7.5
Creatinine (μmol/L) - range 41–73
CK (mmol/L) - range 40–200
LDH (U/L) - range12–250
Serum Lactate (mmol/L) - range >2
Glucose (mmol/L) - range3.9–6.1
Coagulopathy - Y | N
C-reactive protein (mg/L) Infection-associated range 0.0–6.0 Procalcitonin Elevation to evidence of COVID-19 -
Treatment Oxygen therapy - Y | N
Antifungal treatment - Y | N
Antiviral treatment - Y | N
Extracorporeal membrane oxygenator (EMO)
- Y | N
Glucocorticoids - Y | N
Antibiotic treatment - Y | N
Intensive care unit (ICU) - Y | N
Noninvasive ventilation (NIV)
- Y | N
Invasive mechanical ventilation (IMV)
- Y | N
Radiological Pulmonary infiltration - Y | N
Air bronchogram - Y | N
Centrilobular nodules - Y | N
Tree-in-bud - Y | N
Reticular pattern - Y | N
Subpleural linear opacity - Y | N
Bronchial dilatation - Y | N
Lymphadenopathy - Y | N
Pleural effusion - Y | N
3.3 Ontology-based Formalization of Extracted Features
In this stage of our proposed CBR-framework, we processed the raw features buffered in the RBF component of Figure 9 into ontology formalism. Recall that the proposed framework relies on the CBR paradigm to reasoning over the cases presented to it. Hence, each case was modeled using a formalism supporting computational reasoning operation. Figure 11 demonstrates an illustration of a case denoted by Case N. We assumed that based on clinical protocols of COVID-19, a case representation must have a relationship to Diagnosis Case (Suspected, Confirmed, Presumed status); Symptoms (as listed in Table 1); Epidemiology (as listed in Table 1); Radiology/Laboratory manifestations (as listed in Table 1); Clinical Diagnosis (Mild, Acute, Severe); and Treatment (as listed in Table 1). Each case of COVID-19 extracted by the NLP pipeline described in Figure 9 was formalized into this structure as illustrated in Figure 11. The Diagnosis Case entity assumes a 1-1 relationship with every case; Symptoms however presents with a one-many 1 to many (1-M) relationship for each case; also, the Epidemiology entity allows each case to manifest one-many (1-M) relationship; the Radiology/Laboratory manifestations entity also presents each case in a one-many (1-M) relationship given the number of lab tests and radiological operations that might be exercised for each case; Clinical Diagnosis, however, allows for one-one (1-1) relationship due to the fact that a case can only assume one of the states listed in clinical diagnoses; and finally, the Treatment entity allows for one-many (1-M) because one case may respond to one or more treatment/therapy administered to it.
Figure 11: A formal representation tokens (features) of a new case (nc) of coronavirus (COVID-19)
Moreover, each entity illustrated in Figure 11 consists of variables/features which are expected to have values. For instance, considering the Symptom entity, it may have variables/features like Cough, Fever, Chest Pain and others. Each of those variables are expected to take values from a particular data type. Hence we further illustrated the class of data typing each of the entity may draw denotes the values of its variables. Potential data types as captured in Figure 11 are numeric, nominal, ordinals, datetime, and Boolean (which forms the largest representation for most values of variables in the representation).
3.4 The CBR model
section. Meanwhile, we shall first present a brief description of some status or clinical types of COVID-19 based on clinical presentation [50]:
Mild case: Upper respiratory symptoms such as pharyngeal congestion, sore throat, and fever for a short duration or asymptomatic infection; Positive RT-PCR test for SARS-CoV-2; no abnormal radiographic and septic presentation.
Moderate case: Mild pneumonia; symptoms such as fever, cough, fatigue, headache, and myalgia; and absence of complications and manifestations related to severe conditions.
Severe case: A case presenting with mild or moderate clinical features described above; rapid breath (≥70 breaths per min for infants aged <1 year; ≥50 breaths per min for children aged >1 year); hypoxia; lack of consciousness, depression, coma, convulsions; dehydration, difficulty feeding, gastrointestinal dysfunction; myocardial injury; elevated liver enzymes; coagulation dysfunction, rhabdomyolysis, and any other manifestations suggesting injuries to vital organs.
Critical illness case: Respiratory failure with need for mechanical ventilation, persistent hypoxia that cannot be alleviated by inhalation through nasal catheters or masks; septic shock; organ failure that needs monitoring in the ICU, and acute respiratory distress syndrome (ARDS). Cases presenting with ARDS may show:
i. Mild ARDS: 200 mmHg < PaO2/FiO2 ≤ 300 mmHg. In not-ventilated patients or in those managed through non-invasive ventilation (NIV) by using positive end-expiratory pressure (PEEP) or a continuous positive airway pressure (CPAP) ≥ 5 cmH2O.
ii. Moderate ARDS: 100 mmHg < PaO2/FiO2 ≤ 200 mmHg. iii. Severe ARDS: PaO2/FiO2 ≤ 100 mmHg.
These clinical types of COVID-19 have been described to allow for their use in the CBR engine which will be described below.
Figure 12: A model of the proposed case-based reasoning (CBR) used in the NLP-Ontology oriented Spatial temporal framework for detecting COVID-19
A. Retrieve
Based on the general concept of the CBR paradigm, the RETRIEVE procedure/algorithm simply uses some efficient distance or similarity computation models like the Euclidean distance, Cosine Similarity [51], and Manhattan distance. Our approach for the procedure of the RETRIEVE algorithm is described as follows: Consider new case nc and an archive of stored cases in the CBR knowledge base SC= {sc1, sc2, sc3….scn} such that the CBR model RETRIEVE the most similar sci or some sci from SC. However, the process of retrieval of some sci depends on Equation 1. The smaller the value of Sim(nc, sci) the more acceptable the case sci becomes for adoption for REUSE. Here is a summary of procedures in the RETRIEVE step:
i. Query generator and parser are used to construct a query that will fetch all similar cases from the case archive SC. The query(ies) is generated based on the extracted features in the previous stage of the framework described in Figure 8.
ii. Semantic Query Web Rule Language (SQWRL) (details later) is employed for modeling the constructed query in the preceding step.
iii. Output resulting from the SQWRL query is sorted in the order of the most similar to the least similar cases. Cases are assumed to be similar if their measure of look alikeness (based on the corresponding features) is non-negligible. The smaller the value of the similarity, the higher the likelihood of the new case (nc) to share close similarity with a sci or some sci, while the bigger the value of the similarity/distance metric, the lower its tendency to match up with nc.
iv. Hence, our problem can therefore be modeled as a classification problem whereby some sci∈ SC are classified to share some similarity with nc while another class of some sci∈ SC are categorized among dissimilar cases. Execution of clinical similarity of cases is done by steadying the computation within the range of [0, 1] using the following equations:
• Euclidean distance: Describes the length between two points and is the most used distance/similarity metric with most appropriate for cases with continuous or dense data. Equation 1 models Euclidean distance.
𝐸𝐷 = √∑ 𝑤𝑛𝑘 𝑘 . (𝑓𝑎𝑘− 𝑓𝑏𝑘)2 (1)
• Cosine Similarity: This similarity metric measures the dot product of the two features compared. Based on the cosine computation which yields 1 for 00 and less than 1 for other degrees, it implies that a cosine similarity of 1 signals that features A and B are similar cases while a cosine value of -1 indicates non-similarity. Equation 2 models Cosine similarity which has strong application in data with sparse vectors. In addition, the Cosine similarity (CS) is able to perform that Euclidean distance (ED) in cases where ED sees two cases to be distantly similar; CS might observe a closer similarity among the two cases based on their oriented closeness.
𝐶𝑆𝑖𝑚(𝑥, 𝑦) = 𝑥 .𝑦
||𝐱|| ||𝐲|| (2)
where ||x|| and ||y|| are the Euclidean norm of vector x=(x1,x2,…,xp) and Euclidean norm of vector y=(y1,y2,…,yp), respectively, and vector x defined as √𝑥21+ 𝑥22+ ⋯ + 𝑥𝑝2.
• Manhattan distance: Another similarity or distance metric, also known as Manhattan length measures distance between points along an axis at a right angle. Equation 3 models Manhattan distance.
𝑀𝐷 = |𝑥𝑎𝑘− 𝑥𝑏𝑘| + |𝑦𝑎𝑘− 𝑦𝑏𝑘| (3)
• Other similarity measures are the Jaccard similarity (use for sets) and Minkowski distance equations.
Now, because our cases in the proposed framework were modeled/formalised in ontology represenation, there was a need to be able to carry out quantitative measures of similarity between features of cases, hence the need to use ontology-based semantic similarity between terms. There are six (6) major techniques for computing such similarities of features in ontology: ontology hierarchy approach, information content, semantic distance, approach based on properties of features, approach using ontology hierarchy, and hybrid methods [52]. Therefore, to compare two cases, we make the following assumptions:
i. Two cases are similar if their ontologies demonstrate similarities in both feature values and structure (of their ontological representations).
ii. That an arbitrary weight wi value is assigned to each property (object and data properties) in their (cases to compare) ontologies (which must sum to 1 for each ontology representing a case). For example, all properties/relations/links (denoting object properties) as shown in Figure 11 from the Case node to the other nodes (Diagnoses Case, Symptoms, Epidemiology, Radiology/Laboratory, Clinical Diagnoses, and Treatment) each will be assigned a weighted value. Similarly, links (data properties) from the second level (Diagnoses Case, Symptoms, Epidemiology, Radiology/Laboratory, Clinical Diagnoses, and Treatment) to the lower level (values) also have weight values summing up to 1. For instance, the presentsSymptom (object property) may have weight 0.3, hasEpidemiology (object property) may have such that each symptom weight 0.2, and so on until all second level nodes have weights summing up to 1. However, a case may present n features associated with the presentsSymptom link, i.e a case with cough, fever, Anosmia and ARDs (which are all symptoms). So, we also assign weights fwi to each of the known symptoms such that only the weight of the present symptoms in an arbitrary case [c] are summed up all fwi for such case and multiply it with its second level (Symptom node) weight wi. Hence, each mention/use of the notation Wi in our Equation 6 will denote summation of all (wi . fwi)
Note: all our objects (such as presentsSymptom and hasEpidemiology) and data type properties are detailed and discussed in Section 4.3
therapy: Y/N, Heart rate: >=88.63, Temperature (°C): >= 37.86) are modeled with 1 or 0 and values from [0.0, 1.0] respectively. Hence, each .fwi described in (ii) above affected by their impact is denoted by p. Hence, the true value of .fwi is :
fwi = . fwi . p
Now that we have established our distance/similarity functions and basoc assumptions for case retrieval, here is the formula for computing similar cases in the archived compared to new case (nc). This study adopts the approach based on properties and features described in [52]. The adapted similarity measure is that of Tversky (1977) as shown in Equation 4:
𝑆𝑖𝑚(𝑛𝑐|𝑠𝑐𝑖) =
|𝐷1+ 𝐷2|
|𝐷1 ∩ 𝐷2| + 𝜇 |𝐷1 / 𝐷2| + (𝜇 − 1)| 𝐷1 / 𝐷2|
(5)
The model in equation (5) assumes that nc and sci are cases whose features are collected in D1 and D2 respectively. Therefore, the similarity between nc and sci is computed using three components of equation (5): distinct features of nc to sci, distinct features of sci to nc, and common features of nc and sci, for 0 <= 𝜇 <= 1, a function that defines the relative importance of the non-common features. D1 and D2 represent the target and the base respectively while || stands for the cardinality of set. Although we approve of the similarity model in Eq. 5, we however saw its limitation which is based omission of the effect of weight on selected features. Therefore, we modified Eq. 5 so that we do not use the elements of the set alone, but the weight-value of the elements in each Di which is computed by Eq. 6. Hence, our modification to Eq. 5 is shown in Eq. 7, afterward, the most similar sci is RETRIEVE and forwarded to REUSE after applying Eq. 8.
Where D1 or D2 computed using Eq. 6:
𝐷 = ∑ 𝒘𝒊 . 𝒇𝒘𝒊
𝑛
𝑖−0
(6)
𝑆𝑖𝑚(𝑛𝑐|𝑠𝑐𝑖) =
𝐷1+ 𝐷2
𝐷2 ∩ 𝐷1 + 𝜇 𝐷1 / 𝐷2 + (𝜇 − 1) 𝐷2 / 𝐷1
(7)
Furthermore, since 𝑆𝑖𝑚(𝑛𝑐|𝑠𝑐𝑖)represents our similarity between new case (nc) and an arbitrary case 𝑠𝑐𝑖in the
archived, we can compute the similarity score (SS) using Eq. 8.
𝑆𝑖𝑚𝑖𝑙𝑎𝑟𝑖𝑡𝑦 𝑆𝑐𝑜𝑟𝑒 (𝑆𝑆) = 1 − 𝑆𝑖𝑚(𝑛𝑐|𝑠𝑐𝑖) (8)
Hence, cases with with SS close to 1 are similar to nc and as result such cases are retrieved. However, if no case is retrieved by Eqs. 7 and 8, we then conclude that nc might not have any similar case.
We further compute SS for positive and negative cases and apply Equations 9 and 10 to determine the following: When 𝑆𝑆covid19+> 𝑆𝑆covid19− the case is classified as positive case of COVID-19, while if 𝑆𝑆covid19+<
𝑆𝑆covid19− the case is concluded to be negative. However, an evaluation of 𝑆𝑆covid19+= 𝑆𝑆covid19− indicates an
inclonlusive diagnoses, therefore necessitating more similar case(s) be retrieved.
𝑆𝑆covid19+= ∑(𝑆𝑆+) 𝑛
𝑘=0
(9)
𝑆𝑆covid19−= ∑(𝑆𝑆−) 𝑚
𝑘=0
(10)
B. Reuse
The REUSE procedure allows the system to modify the RETRIEVE cases sci in such a manner that we have only one similar case. The similar case is constructed to maintain a similar ontology structure with the nc case. This is achieved by rebuilding an anonymous case (ac) by extracting all similar features of the presented cases in sci until ac assumes the form of nc. As such the modified ac is presented as a temporary solution to nc. The approach proposed here is different from methods used by Gu, et al. [53], which relied on clinical protocols guidelines and medical experts respectively. The ac case is therefore considered a solved case which will be passed on to the REVISE step for processing.
C. Revise
The evaluation of ac case at this stage is achieved by ensuring that the summation of case features of the proposed solution case is not greater than 1. If they evaluate to more than 1, some non-essential features are dropped and the weights of the features are recomputed until an appropriate value is obtained. The revised and evaluated case now becomes a candidate case for use, and it is called the repaired case (rc). Furthermore, rc is then used to solve the new problem nc presented to the system. The solution to nc is passed to the RETAIN.
D. Retain
Finally, the RETAIN procedure simply stores the solution to nc as a case that has been learned and is fit to be stored/added to the knowledge base of CBR model for future use.
3.5 Algorithm for Case Retrieval
Algorithm 1 details the complete procedure outlined in proceeding subsections, and describes how a new case of COVID-19 is classified as a positive or negative case using the CBR method. The input to the algorithm is an HER of the new case and the out is Diagnoses Case (Suspected, Confirm, Presumed status).
Algorithm 1: An algorithm using NLP-Ontology CBR framework for detecting and diagnosing COVID-19
Input: 𝑐𝑎𝑠𝑒 − 𝐸𝐻𝑅 (𝑐𝐸𝐻𝑅), 𝑎𝑟𝑐ℎ𝑖𝑣𝑒𝑑 𝑐𝑎𝑠𝑒𝑠(𝐴𝐶𝑠)
Output: Diagnoses Case (Suspected, Confirm, Presumed status)
1 Start
2 mtdk [][], rtcf[][], rfb [][]
3 sc []
4 ac ← ∅
5 SFs ←sentenceTokenizer(𝑐𝐸𝐻𝑅) 6 SFs← spellCorrector(SFs) 7 SFs ← lexicalNormalizer(SFs) 8 SFs ← sentenceNormalizer(SFs) 9 ncsat ← NSC(SFs)
10
11 mtdk, rtcf, rfb ← ∅ 12 mtdk ←MTDK(ncsat) 13 𝑟𝑡𝑐𝑓 ←RTCF(mtdk) 14 𝑟𝑓𝑏 ← RFB(rtcf)
15 nc ← formalizeFeatures(rfb) 16 sc ← RETRIEVE(nc, ACs) 17 ac ← REUSE(nc, sc) 18 rc ← REVISE(ac) 19 adapt rc for nc 20 𝐴𝐶𝑠 +← 𝑅𝐸𝑇𝐴𝐼𝑁()
21 diagnosis_status ←find status of rc 22 return diagnosis_status
23 end
__________________________________________________________________________________________
4.0 Experimentation
4.1 Clinical Data
The COVID-19 pandemic is currently a global emergency with limited access to health facilities and even computerized patient records which could have allowed access datasets for computational research. Although there are statistical-based datasets accessible in the forms of structured, semi-structured, and unstructured (e.g. WHO, Johns Hopkins University, mainstream news media, and even social media), however, such datasets are still unfit for tasks like the one in this study. After a thorough search for publicly available patient HER-based benchmarked datasets of 19 with none accessible, we decided to adopt the approach of curating new datasets of COVID-19 from some available data on standard domains.
The data curated was obtained from the Italian Society of Medical and Interventional Radiology (SIRM). SIRM is a scientific association which includes the majority of Italian radiologists, and is targeted to encourage the progression of diagnostic imaging by promoting studies and research. The data source (https://www.sirm.org/en/italian-society-of-medical-and-interventional-radiology/) listed English-like records (itemizing age, symptoms and signs manifested, and other laboratory details) and CT scans for each of the sixty-eight (68) COVID-19 patients. We anonymized and cleaned the datasets where necessary and extracted the necessary information, storing them in a format appropriate for this study. Figure 13 shows snapshots of a randomly selected case.
Figure 13: Dataset of a sample case of COVID-19 showing some English-like statements extracted and samples of CT scans and X-ray performed on the patient.
The data need of this study is EHR-based datasets in natural language (NL) format. Hence, we focused on processing the English-like statements extracted for each patient leaving the image-based for future study using the approach of deep learning for classification of COVID-19 cases.
4.2 Computational Environment Setup
and also installed NetBeans IDE version 8.1. The Python platform allows for the implementation of the NLP feature extraction pipeline shown in Figure 9 while the NetBeans IDE provides support for implementing the feature to ontology representation and also the CBR-engine. Modeling of ontologies in this study was achieved using Protégé (Protégé).
4.3 Domain Ontology Modeling
Ontologies are formalism for specification of concepts or abstract description of a system in a domain-specific knowledge composition. Ontologies as formalism stems from description logic (DL) and with support for reasoning it has received OR has caused it to receive more and more attention in computational biology and bioinformatics. There are different ontology languages like RDF/RDFS, DALM+OIL, and OWL. OWL is a DL-based ontology language with high expressivity and has three variants: OWL-DL, OWL-full and OWL-lite. This study models ontologies using OWL2[54, 55], which is an improved version of OWL (sometimes known as OWL1). We have modeled three different ontologies: the first represents domain knowledge, the second is a formalism of the archived cases, and the third ontology formalizes new cases.
Figure 14: Ontology representation domain-based mapped tokens (features) of a new case of coronavirus (COVID-19): New Case (nc)
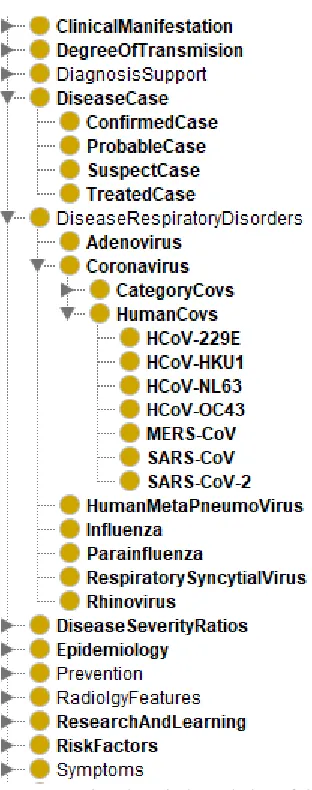
In Figure 14, we show a visualization of the ontology representing a new case (nc). The ontology captures concepts/classes like Symptoms, ClinicalDiagnosis, ClinicalManifestation, Epidemiology, RadiologyFeatures, LaboratoryFeatures Case (to denote a new case), DiseaseCase, Cause (to capture the likely causes of the disease in a case), and Treatment (which represents treatments administered to a case). Each of these concepts is related/linked to another concept by a property (object property) with almost all concepts linked to Case. To the right is a list of the object properties. For example the line connecting Case to Symptoms is the object property presentSymptom. The Case is the domain while Symptoms is the range for the object property presentSymptom. Some concepts have the + symbol at the top-leftmost corner of their bounding boxes. This is an indication that there are other subclasses in that concept/class which can be revealed by clicking on the + symbol.
Figure 15: A visualization of ontology representation of relations of concepts (TBox) in a domain-based knowledge repository of COVID-19 using the is-a relationship
Figure 16: A listing of concepts (classes), individuals (instances of classes), object properties and data type properties modeled in a domain-based knowledge repository of COVID-19
Now that we have formalism for archiving all cases in the proposed framework and also a formalism for modeling new cases extracted from electronic records, we shall consider how the proposed approach will implement its query for similar cases as modeled using mathematical models in item A of subsection 3.4. To archive an optimized and effective query of cases from the archive, we decided to construct our query from the mathematical models presented earlier using Semantic Query-Enhanced Web Rule Language (SQWRL), pronounced squirrel. SQWRL is a query language primitive to OWL and also an SWRL-based with syntax of SQL-like and having operators for extracting information from OWL ontologies [56, 57]. We chose SQWRL over SPARQL because of its suitability for use in OWL ontologies since it does not require serializing our OWL ontologies in RDF/RDFS, an operation which often causes a knowledge-base (ontology) to lose some semantics and expressivity as a result of serialization. Moreover, the rule-form of SQWRL and its compatibility with the rule language SWRL allows for improving our framework to use inference engine, thereby improving the knowledge-base through inference. Protégé also provides a tab for executing our SQWRL queries against the ontology through the SQWRLTab plugging. We may take advantage of this tab to text our generated queries, although the framework proposed in this study has a mechanism for doing the query execution automatically through OWLAPI.
Now for instance, given a new case (nc) presenting with the following features according to their category, we might be interested in translating our mathematical model into an SQWRL query such that similar cases are retrieved: Symptoms (Cough, Temperature, Nausea and vomiting, Shortness of breath, Contact with case(s)); Laboratory Features(Neutrophil, Lymphocyte, Active partial thrombin time);
Figure 17: A sample SQWRL query constructed to retrieve similar cases corresponding with the new case (nc) accepted as input.
The sample query in Figure 17 was submitted to the Protégé application for execution and query of the underlying ontology through the SQWRLTab plugins. The syntax of the SQWRL query language aligns itself to the declared classes or entities, properties (both data type and object), and instances/individuals on the ontology. This is why you will observe that the predicates (unary and binary) names in the listed query in Figure 17 derive their values from the declared classes or entities, properties (both data type and object), and instances in the ontology. This positions the SQWRL query above the use of SPARQL. A detail explanation of the query given in the following lines:
The first line Case(?c) ^ hasCaseID(?c, ?cid) extracts all cases and their case IDs from the CBR case archive and stores those two values in the (?c, ?cid variables. Furthermore, the second lines 2-5 of our query select instances of the following symptoms which were keywords/features extracted from the natural language input above: Cough, Temperature, Vomiting, and ShortnessOfBreath, and their weight values. This is summarized in the following lines:
^ Cough(?sc) ^ hasLowerGroupWeight(?sc, ?scwi) ^ presentsSymptom(?c, ?sc) ^ hasBoolean(?sc, ?cv1)
^ Temperature(?st) ^ hasLowerGroupWeight(?st, ?stwi) ^ presentsSymptom(?c, ?st) ^ hasSymptomValue(?st, ?cv2) ^ Nausea(?sn) ^ hasLowerGroupWeight(?sn, ?snwi) ^ presentsSymptom(?c, ?sn) ^ hasBoolean(?sn, ?cv3)
^ Vomiting(?sv) ^ hasLowerGroupWeight(?sv, ?svwi) ^ presentsSymptom(?cid, ?sv) ^ hasBoolean(?sv, ?cv4)
^ ShortnessOfBreath(?ssb) ^ hasLowerGroupWeight(?ss, ?sswi) ^ presentsSymptom(?c, ?ssb) ^ hasBoolean(?ssb, ?cv5)
Also, our natural language based query has some laboratory features which we also extracted their values for each of the cases retrieved due to the query on line 1. These laboratory features are queried as follows:
^ Neutrophil(?ln) ^ hasLowerGroupWeight(?ln, ?lnwi) ^hasLabFeatures(?c, ?ln) ^ hasLabTestValue(?ln, ?cv6)
^ Lymphocyte(?ll) ^ hasLowerGroupWeight(?ll, ?llwi) ^ hasLabFeatures(?c, ?ll) ^ hasLabTestValue(?ll, ?cv7)
^ ActivePartialThrombinTime(?laptt) ^ hasLowerGroupWeight(?laptt, ?lapttwi) ^ hasLabFeatures(?c, ?laptt) ^ hasLabTestValue(?laptt, ?cv8)