This is the peer-reviewed, manuscript version of the following article:
Sanchis-Mora, S., Chang, Y.-M., Abeyesinghe, S., Fisher, A., Volk, H. A. and Pelligand, L. 'Development and initial validation of a sensory threshold examination protocol (STEP) for phenotyping canine pain syndromes', Veterinary Anaesthesia and Analgesia.
© 2017. This manuscript version is made available under the CC-BY-NC-ND 4.0 license http://creativecommons.org/licenses/by-nc-nd/4.0/.
The full details of the published version of the article are as follows:
TITLE: Development and initial validation of a sensory threshold examination protocol (STEP) for phenotyping canine pain syndromes
AUTHORS: Sandra Sanchis-Mora, Yu-Mei Chang, Siobhan Abeyesinghe, Amy Fisher, Holger A. Volk, Ludovic Pelligand
JOURNAL: Veterinary Anaesthesia and Analgesia PUBLISHER: Elsevier
M
AN
US
CR
IP
T
AC
CE
PT
ED
RESEARCH PAPER
1
Development and initial validation of a sensory threshold examination protocol (STEP) 2
for phenotyping canine pain syndromes 3
Sandra Sanchis-Moraa,*, Yu-Mei Changb, Siobhan Abeyesinghec, Amy Fisherd, Holger A
4
Volka & Ludovic Pelliganda, e
5
a
Comparative Biomedical Sciences, Royal Veterinary College, University of London, UK.
6
b
Research Office, Royal Veterinary College, University of London, UK,
7
c
Production and Population Health, Royal Veterinary College, University of London, UK
8
d
Transpharmation Ltd, The London Bioscience Innovation Centre, 2 Royal College Street,
9
London, UK
10
e
Clinical Science and Services, Royal Veterinary College, University of London, UK.
11
*
Correspondence: Sandra Sanchis-Mora, Royal Veterinary College, Hawkshead Lane, North 12
Mymms, Herts, AL9 7TA, E-mail: [email protected]
13
Running head: Quantitative sensory testing protocol in healthy dogs
M
AN
US
CR
IP
T
AC
CE
PT
ED
Abstract 15
Objective To study feasibility and test-retest repeatability of a sensory threshold examination 16
protocol (STEP) and report quantitative sensory threshold distributions in healthy dogs.
17
Study design Prospective, observational, cohort study. 18
Animals Twenty-five healthy client-owned dogs. 19
Methods Tactile sensitivity (TST) (von Frey filaments), mechanical thresholds (MT with 2, 4 20
and 8 mm probes), heat thresholds (HT) and responsiveness to cold stimulus (CT at 0 ̊C)
21
were quantitatively assessed for five body areas (BA: tibias, humeri, neck, thoracolumbar
22
region and abdomen) in a randomized order on three different occasions. Linear Mixed
23
Model and Generalised Linear Mixed models were used to evaluate the effects of body
24
weight category, age, sex, BA, occasion, feasibility score and investigator experience.
Test-25
retest repeatability was evaluated with the Intra-class Correlation Coefficient (ICC).
26
Results The STEP lasted 90 minutes without side effects. The BA affected most tests (p ≤
27
0.001). Higher thresholds and longer cold latencies were scored in the neck (p ≤ 0.024)
28
compared to other BAs. Weight category affected all thresholds (p ≤ 0.037). Small dogs had
29
lower MT (∼1.4 N mean difference) and HT (1.1 0C mean difference) than other dogs (p ≤
30
0.029). Young dogs had higher HT than adults (2.2 0C mean difference) (p = 0.035). Gender
31
also affected TST, MT and HT (p < 0.05) (females versus males: TST OR= 0.5, MT= 1.3 N
32
mean difference, HT= 2.2 0C mean difference). Repeatability was substantial to moderate for
33
all tests, but poor for TST. There was no difference in thresholds between occasions, except
34
for CT. Test-retest repeatability was slightly better with the 2 mm MT probe compared to
35
other diameters and improved with operator experience.
M
AN
US
CR
IP
T
AC
CE
PT
ED
Conclusions and clinical relevance The STEP was feasible, well tolerated and showed 37
substantial test-retest repeatability in healthy dogs. Further validation is needed in dogs
38
suffering pain.
39
M
AN
US
CR
IP
T
AC
CE
PT
ED
Introduction 41
Quantitative sensory testing (QST) is a method used to quantify the somatosensory function
42
(Backonja et al. 2013; Edwards et al. 2016). In the clinical research setting, QST evaluation
43
comprises touch and vibration detection, as well as mechanical and thermal (heat and cold)
44
noxious stimuli (Walk et al. 2009). In humans, QST has been applied in healthy volunteers,
45
patients with neuropathic pain defined as “pain caused by a lesion or disease of the
46
somatosensory nervous system” (Backonja et al. 2013; Finnerup et al. 2016) and other pain
47
syndromes where the somatosensory function may be altered due to peripherial or central
48
sensitisation (Whitaker et al. 2016).
49
There is evidence in people that altered somatosensory function originates from various
50
pathophysiological mechanisms that can be elucidated by the results of a QST panel
51
(Greenspan 2001; Hansson 2002; Hansson et al. 2007). The QST may identify patient
52
subgroups with certain underlying neuro-biological mechanisms who may respond differently
53
to a given drug (Baron et al. 2014). Characterizing the somatosensory phenotype of patients
54
with chronic pain by identifying sensory abnormalities (positive, such as hyperalgesia and
55
allodynia or negative, such as numbness or lack of sensation), is necessary to help select the
56
best therapeutic class for a specific patient. This is the key to mechanism-based diagnosis and
57
could significantly improve treatment (Rolke et al. 2006; Reimer et al. 2014; Edwards et al.
58
2016).
59
Similar to humans, animals experience chronic pain of neuropathic origin (Mathews 2008).
60
The QST has the potential to be a neurophysiological tool in veterinary medicine and has
61
been used in different clinical and experimental models such as osteoarthritis, hip
62
replacement and ovariohysterectomy in dogs (Brydges et al. 2012; Hunt et al. 2013; Moore et
63
al. 2013; Tomas et al. 2014).Recently, thermal stimuli have been tested in combination with
M
AN
US
CR
IP
T
AC
CE
PT
ED
mechanical stimuli in canine models of osteoarthritis and spinal cord injury (Knazovicki et al.
65
2016; Gorney et al. 2016; Song et al. 2016). However, the combination of all the QST
66
modalities together in one standardized test has never been explored.
67
The use of naturally occurring canine pain models is becoming a valuable option to study
68
human chronic pain (Lascelles 2013). They better mirror human conditions and may provide
69
better insight into drug efficacy in humans compared with experimentally induced rodent
70
models. Observing the responses of dogs administered analgesic drugs for different naturally
71
occurring pathophysiologic mechanisms are powerful models for translational studies.
72
Designing a standardized method to evaluate nociceptive thresholds in canine patients and
73
defining sources of confounding factors in healthy dogs will ultimately offer an improvement
74
of diagnosis and characterisation of chronic pain.
75
The aims of this study were to (i) evaluate the feasibility and test-retest repeatability of a QST
76
sensory threshold examination protocol (STEP) including tactile, thermal and mechanical
77
testing; (ii) to identify explanatory variables affecting results; and (iii) to provide baseline
78
QST thresholds and their distribution in a sample of healthy dogs for its use as a tool to
79
phenotype chronic pain syndromes in future studies.
M
AN
US
CR
IP
T
AC
CE
PT
ED
Materials and Methods 81
The project was approved by the Royal Veterinary College Ethics and Welfare Committee
82
(URN 2013 1243). Twenty-five healthy client-owned dogs were included in the study which
83
was conducted between January and August 2014. Signed owner consent was obtained for all
84
animals enrolled in the study. The dogs were deemed healthy based on their medical history
85
and a complete physical/neurological/orthopaedic exam performed by a veterinarian. Owners
86
completed the Canine Brief Pain Inventory (CBPI) which consisted of three parts: pain
87
severity ranging from 0 (no pain) to 10 (extreme pain), pain interference from 0 (no
88
interference) to 10 (completely interferes) and quality of life assessment from 1 (poor) to 5
89
(excellent) (Brown et al. 2008). An inclusion criterion was a CBPI score of 0 on pain severity
90
and pain interference, with a quality of life scores greater than 4 (very good) (Brown et al.
91
2008). Dogs that were not able to attended a minimum of two appointments (occasions) were
92
excluded.
93
Animals were tested on 2 or 3 occasions (occasion 1, 2 or 3) (Fig. 1), each separated by a
94
week, with a sensory threshold examination protocol (STEP). The CBPI was completed on
95
each occasion to ensure that no changes occurred over time in order to continue remain in the
96
study. The standardised STEP consisted of a tactile sensitivity test (TST using von Frey
97
filaments), mechanical thresholds (MT using a calibrated veterinary pressure algometer), heat
98
and cold thresholds (HT, CT). The tests were applied in the same order in all dogs as follows:
99
TST, MT, HT, CT. Mechanical testing was performed before thermal to avoid iatrogenic
100
sensitisation, according Grone et al. (2012). For each sensory modality, measurements were
101
taken from five different body areas (BA) in a randomized order
102
(www.graphpad.com/quickcalcs): bilaterally over the mid tibias, mid humeri, neck area,
103
thoraco-lumbar (T-L) area and left side only over the abdomen (Fig. 2). Dogs were all tested
104
in the same room in standing position. Prior to testing, dogs were acclimatised to the room for
M
AN
US
CR
IP
T
AC
CE
PT
ED
five minutes before clipping. Clipping of the BAs (1.5 x 1.5 cm patch) was needed to allow
106
TST and thermal evaluation. The areas were clipped on each occasion. The test started not
107
less than ten minutes after clipping.
108
Each individual test terminated with the observation of one of the following endpoints:
109
turning the head towards the device, growling, lip licking, or backing away from the stimulus.
110
A feasibility score ranging from 1 (no problem) to 5 (impossible) adapted from Briley et al.
111
(2014) (Appendix 1) was used to evaluate dog cooperation. All of the tests were readily
112
escapable and, if an animal appeared to be in discomfort during testing (or unable to tolerate
113
the protocol), the test was terminated immediately. If the dogs showed fatigue or reluctance
114
to stand, time was allowed for resting of up to five minutes between tests.
115
Tactile sensitivity thresholds
116
Von Frey filaments (20 filaments, 0.008 to 300 gram force (gf); Bioseb, France) were used
117
for TST. The hairs were pressed against the skin with enough force so that the hair buckled
118
and formed a U-shape. Two techniques were applied and compared. First, a group of 18 dogs
119
were tested with the up-down technique (TSTUD) described by Chaplan et al. (1994). The test
120
was initiated with an intermediate 2.0 gf hair. A lack of response to a filament dictated that
121
the next thickest filament was used in the following stimulation (‘up rule’), while a positive
122
response dictated the use of the next thinnest filament (‘down rule’). When the animal first
123
changed its response pattern: a negative response followed by a positive response or vice
124
versa, another four von Frey presentations were done according to the above ‘up-down rules’.
125
The final response threshold was interpolated using the formula: gf threshold = (10
126
[Xf+kδ])/10,000 where Xf = value (in log units) of the final von Frey filament used; k =
127
tabular value (see Chaplan et al. 1994 for more details) for the pattern of positive/negative
128
responses; and δ = mean difference (in log units) between stimuli.
M
AN
US
CR
IP
T
AC
CE
PT
ED
The 50% response technique (TST50%) described by Brydges et al. (2012) was used in a
130
second group of 7 dogs, because preliminary data from the up-down technique suggested
131
difficulties in interpretation of the final threshold as a result of data censoring (animals not
132
responding to the thickest filament). The TST50% consisted of using the filaments in
133
ascending order. Each filament was applied six times, with 3 second intervals. If no aversive
134
response was obtained after testing with a small diameter filament, the next highest diameter
135
filament was used. The tactile sensitivity threshold was defined by the filament that first
136
induced a withdrawal response at least three times in six repeated measurements.
137
Mechanical thresholds
138
Mechanical response was tested with a calibrated veterinary pressure algometer (ProdPro;
139
Topcat Metrology Ltd, UK), equipped with three different probe diameters: 2 mm, 4 mm, and
140
8 mm. The accuracy of the instrument was ± 0.5 Newton (N) within a range of 0.5 ̶ 25 N. The
141
algometer provided a constant increment pressure increase of 2 N second-1 to achieve
142
repeatable applications. The device was applied perpendicular to the skin of the dogs with
143
one hand. The other hand was used to support gently the medial aspect or the contralateral
144
side of the area tested. Three repetitions in the five BAs were obtained for each occasion with
145
the three different probe sizes. Twenty seconds were allowed between repetitions. The final
146
thresholds for the occasion were obtained calculating the mean of the three repeats per BA.
147
Thermal thresholds
148
Heat stimulus was applied using a veterinary thermal probe (HotPro; Topcat Metrology Ltd).
149
The device was a handheld calibrated prototype adapted from the already validated wired
150
version (Dixon et al. 2002). Before testing, the skin temperature was measured with the
151
device and room temperature was recorded (EL-USB-TP-LCD; Lascar Electronics, UK).
152
During testing, the temperature increased from baseline to a maximum of 55 0C with a ramp
M
AN
US
CR
IP
T
AC
CE
PT
ED
of 1 C second until the endpoint was reached. The device was applied as described in the
154
use of the pressure algometer. Three repetitions in the five BAs were obtained for each
155
occasion. Twenty seconds were allowed between repetitions. The final threshold for the same
156
occasion was obtained calculating the mean of the three repeats per BA.
157
Cold stimulus was applied using a handheld thermal probe (NTE-2A; Physitemp Instruments,
158
NJ, USA) with a 13 mm diameter surface set at 0 ± 0.2 0C. The probe used a peltier
159
semiconductor heat pump and a digital temperature control unit to maintain accurate
160
temperature application during trials. The latency (seconds) between application and
161
observation of endpoint was recorded. Three repetitions for each BA were obtained on each
162
occasion. Each repeat included the entire series of BAs in a randomized order, starting again
163
the entire series in the same random order for the second and the third repeat. This allowed at
164
least 60 seconds between repeats in the same BA maintaining appropriate duration of the total
165
time spent in all the tests.
166
Analysis of data
167
Data were analysed using statistical software (IBM SPSS 21). Data from dogs which the
168
feasibility scores were higher than 2 were excluded from the analysis. For continuous data,
169
normality of distribution was verified by Kolmorov-Smirnov’s test and by visual assessment
170
of Q-Q plots and histograms. When required, data were logarithmically transformed to verify
171
the assumption of data normality prior to parametric testing. Cold and tactile sensitivity
172
thresholds were right-censored (60 seconds and highest filament, respectively) and treated as
173
binary data (0 = response below threshold and 1 = threshold reached).
174
Continuous data were expressed as mean ± standard deviation (SD). Data following a
175
logarithmic distribution were presented as geometric mean and back-transformed SD. Other
176
data were presented as median (range). For graphical display, median, interquartile range and
M
AN
US
CR
IP
T
AC
CE
PT
ED
minimum-maximum was used. Categorical data were expressed as number out of total and
178
percentage. Significant differences were considered if p < 0.05.
179
Data were divided in two periods of testing (first period of testing form January 2014 to April
180
2014 against second period of testing from May 2014 to August 2014) to evaluate the effect
181
of the operator gaining experience with QST thresholds.
182
A linear mixed model (LMM) was used for continuous outcome variables MT (N) and HT
183
(°C) separately, to evaluate the influence of the explanatory variables on the within/between
184
subject variability. Subjects were considered as a random effect. The following explanatory
185
variables were considered as fixed effects: body weight and age (divided in three categories
186
respectively, Appendix 2), sex, BA (5 total), right/left side. Analysis of HT also included
187
body temperature and room temperature as additional fixed effects. Factors affecting the
188
metrological performance of the protocol were also included in the model as fixed effects:
189
feasibility score (0, 1 or 2), effect of repeated testing (occasion 1, 2 or 3) and period of testing
190
(first and second period). In the case of the pressure algometer, the three different probes (2,
191
4 and 8 mm) were compared in separate statistical models (MT2, MT4, MT8). Magnitude of
192
the effects was reported as the adjusted mean difference and p-value.
193
A generalised Linear Mixed Model (GLMM) was used for tests with binary logistic outcomes
194
(TST and CT). The dependent variables were response to any of the von Frey filaments and 0
195
0
C before 60 seconds (pTST and pCT) respectively. The fixed and random effects were the
196
same as for continuous outcomes. Magnitude of the effects was reported as the odds ratio and
197
p value. 198
Interactions were evaluated when appropriate. Post-hoc comparisons of the significant effects
199
were made using Fisher’s least standard differences (LSD) method.
M
AN
US
CR
IP
T
AC
CE
PT
ED
Test-retest repeatability was evaluated by calculating the intra-class correlation coefficient
201
(ICC). The ICC is the degree of closeness of repeated measures in a group of individuals
202
(Andersen et al. 2014). It describes the contribution of the variation within the individual
203
within the total variation (between dogs variation + within dogs variation + error variation)
204
(Vangeneugden et al. 2004). Therefore, the closest to 1 the ICC, the smallest the variation
205
within dogs across the different occasions (occasion 1, 2 or 3), and the better the repeatability
206
of the test. The ICCs were categorised as slight/poor (< 0.2), fair (>0 .2 to 0.4), moderate (>
207
0.4 to 0.6), substantial (> 0.6 to 0.8) and almost perfect (> 0.8) (Landis & Koch 1977).
M
AN
US
CR
IP
T
AC
CE
PT
ED
Results 209
Descriptive results
210
The twenty-five healthy client-owned dogs included in the study (Fig.1) had an age of 6.0
211
(0.3 ̶ 9.0) years and body weight of 15 (6 ̶ 35) kg. There were 14 females (56%) and 11 males
212
(44%). All dogs’ CBPI scores were 0 for pain intensity and pain interference, and 5 for
213
quality of life. Eleven dogs (44%) were tested during the first period of testing. Distributions
214
of the sample by different weight category and age are shown in Appendix 2. Feasibility
215
score distribution across the sample of dogs was 0 for 4 dogs, (16%); 1 for 9 dogs, (36%); 2
216
for 12 dogs, (48%). The temperature of the testing room was 22.9 (19.3 ̶ 26.2) 0C. The skin
217
temperature was 30.9 (27.6 ̶ 33.2) 0C. According to this range of skin temperature, the
218
baseline starting temperature was set at 300C for HT in all dogs. The STEP protocol took 90
219
minutes per dog and was applied with no side effects reported by owners.
220
Mean ± SD or median (range) of the TST, MT, HT, and CT are displayed in Tables 1 and 2,
221
respectively. Median (interquartile range) and minimum-maximum thresholds for the
222
different stimuli are summarised for the different BA in Fig. 3.
223
Influence of explanatory variables
224
The p values of the different explanatory variables studied are summarised in Table 2. The
225
post-hoc comparisons for these effects are reported in Appendix 3 (mean differences and p -
226
value for MT and HT; odds ratio and p value for TST and CT). There was a highly significant
227
effect of the BA tested for all stimuli evaluated (p ≤ 0.001). The QST thresholds for the
228
different BA and stimuli are summarised in Fig. 3. Higher thresholds were scored in the neck
229
compared with other areas in all the QST (p ≤ 0.024) (Appendix 3). Left and right sides of
230
each BA showed no significant differences in thresholds in this study (Table 2).
M
AN
US
CR
IP
T
AC
CE
PT
ED
Weight category had a significant effect on all thresholds (p ≤ 0.037) except for p TSTUD.
232
Small dogs had lower MT and HT than medium and large dogs (p ≤ 0.029, Table S3).
233
Nevertheless smaller dogs were less likely to respond to TST50% than larger dogs (p < 0.01).
234
Regarding age, young dogs were more likely to obtain higher HT than adults (p = 0.035),
235
however, adults obtained lower HT than geriatric patients did (p = 0.013). The MT and HT
236
were significantly higher in females (p < 0.05) whereas this effect was not significant for
237
pCT. In contrast, pTST50% was higher in females than in males (p = 0.006 and p = 0.009 for
238
TSTUD and TST50% respectively).
239
Test-retest repeatability
240
There was no inter-occasion difference, except for pCT (Table 2), where percentage of
241
response was significantly higher during the last occasion than the previous two (p < 0.01).
242
Feasibility score only significantly affected pTSTUD (p = 0.004); higher proportion of
243
responses was obtained with higher feasibility scores (less cooperative dogs). Lower
244
thresholds were obtained for MT on the second period of testing where the operator obtained
245
more experience (p < 0.05) (Appendix 3).
246
The ICCs showed moderate to substantial test-retest repeatability across occasions (Table 3)
247
except for the TSTUD where the ICC was poor. The two periods of testing showed significant
248
effect on MT. Therefore, the ICCs of the two periods for MT were calculated. A slight
249
improvement in ICCs was seen (Table 3).
M
AN
US
CR
IP
T
AC
CE
PT
ED
Discussion 251
Canine spontaneous models of chronic pain need a standard procedure for characterisation. In
252
addition, investigations of nociception in animals should represent the preliminary step before
253
clinical studies are undertaken to pursue better treatment options in small companion animals
254
(Bergadano et al. 2006). This study intended to create and evaluate a sensory threshold
255
examination protocol (STEP) to determine a complete QST phenotype in one clinical session.
256
Feasibility, test-retest repeatability, and possible confounding factors (cofactors and
257
covariates) to take into account when applying the STEP were studied.
258
First, consistently with other studies in dogs (Moore et al. 2013; Briley et al. 2014; Harris et
259
al. 2015), the cofactor that had the largest effect in our study was weight category.
260
Nevertheless, the sample in this study was not large enough to include weight as a continuous
261
explanatory variable and the diversity of breeds was not representative enough to include this
262
effect in the analysis. Another important factor affecting response is the limb length and the
263
distance between the nociceptor to the brain (Blankenburg et al. 2010). Practically, thresholds
264
obtained with the STEP should be compared between dogs of the same weight category.
265
Secondly, different BAs appeared to show very different thresholds, in line with other studies
266
in healthy dogs (Coleman et al. 2014; Harris et al. 2015) and humans (Rolke et al. 2006). We
267
included different body areas in this protocol so a map of QST thresholds could be evaluated
268
for feasibility, test-retest repeatability and to evaluate if different body areas could show
269
different thresholds as other studies have demonstrated. The choice of body areas in the
270
present study was adapted from previous studies (Coleman et al. 2014; Harris et al. 2014) and
271
modified to be performed easily with the tools provided) to ensure a good contact and avoid
272
the probe slipping off the tested body area. This may allow different clinicians to use the
273
STEP efficiently and with good results.
M
AN
US
CR
IP
T
AC
CE
PT
ED
Neck area scored higher thresholds in all tests of the STEP. There are no other reports of neck
275
thermal or mechanical testing in dogs. It has been suggested that tissues in the more distal
276
aspects of limbs are more highly innervated than more proximal tissues and nerves have
277
smaller receptive fields (Coleman et al. 2014). Contributing factors may also include
278
differences in reaction time related to thickness of epidermis (Blankenburg et al. 2010).
279
These findings support the assumption that when testing a patient for sensory abnormalities,
280
thresholds from a specific BA should not be compared with values from a BA of a different
281
location. The lack of differential sensitivity across the left and right sides suggests the
282
unaffected side of a BA may be an appropriate control for the unilateral affected painful side
283
if this has not been compromised by central sensitisation.
284
BAs significantly affected algometer readings in previous studies (Coleman et al. 2014;
285
Harris et al 2014). Mechanical thresholds for spine and hips reported by Coleman et al (2014)
286
(mean of approximately 38 N and 42 N, respectively) were higher than elbows and stifles
287
(mean between 37 N and 27 N). It is difficult to compare these results to ours because the
288
testing device differed and large dogs (retrievers) were tested in lateral recumbency; all of
289
which could explain their high MTs (Coleman et al 2014). The same finding was reported in
290
studies comparing healthy and osteoarthritic dogs in lateral recumbency (Knazovicky et al.
291
2016). The MTs on the tibia with a different device were higher when comparing within the
292
same weight category range of our study (1523 gf being approximately 14.0 N versus 9.5 N
293
obtained in our study with the 4 mm tip size). In this case, tip diameter was 3 mm and the rate
294
of increase of pressure was not indicated. The MTs reported for the different body areas by
295
Harris et al (2014) with the same device used in our study (i.e. MT of the tibias obtained a
296
mean of 5.6- 5.8 N) were not separated by weight. Briley et al. (2014) obtained a mean
297
between 1089 to 1028 gf, which corresponds with approximately 10 N. However, this was on
M
AN
US
CR
IP
T
AC
CE
PT
ED
the metatarsal surface, in lateral recumbency and with a different algometer in healthy dogs
299
between 10 to 40 kg, which makes it impossible to compare between studies.
300
There are no other known veterinary studies reporting differences in BA in thermal
301
thresholds in dogs for direct comparison. Hoffman et al. (2012) reported a mean HT of 39 0C
302
on the lateral thorax in Beagles weighting 17 kg. Williams et al. (2014) measured the latency
303
of time healthy dogs were able to tolerate standing on a hot infrared light that reached about
304
59 0C in 30 seconds. Only the hind paw latency was evaluated in this study. Knazovicky et al.
305
(2016) applied a temperature of 450C on the tibias and other locations of the hind limb and
306
measured latency in large dogs. These areas were not clipped and prevent comparisons
307
between studies.
308
Previously, latency to respond to cold has been evaluated only on a cold plate at 6 0C in the
309
hind paw and the pelvic limb in lateral recumbency in healthy dogs (Brydges et al. 2012;
310
Briley et al. 2014) but not in thoracic limbs, neck or spine. Control dogs reached the cut off
311
time in most of the cases, as occurred in our study. Knazovicky et al. (2016) reported a mean
312
latency to 00C of 52.77 seconds in large dogs in lateral recumbency compared with a median
313
of 43.25 seconds obtained in the tibias in our study. Nevertheless, a standard methodology of
314
testing that allows good test-retest repeatability is necessary to establish a normal range and
315
allow comparison with chronic pain conditions in future studies.
316
Third, age affected the response to testing, as young and geriatric patients showed higher HTs
317
than adults did. Our results are consistent with human studies in which age differences had a
318
large effect in the data. (Rolke et al. 2006; Blankenburg et al. 2010). These effects could be
319
related with functional maturation of interneurons in the cortex and dorsal horn when
320
comparing young patients and decrease in innervation density when testing geriatric patients.
321
Fourth, the TST data in this study are in agreement with human studies showing that women
M
AN
US
CR
IP
T
AC
CE
PT
ED
tend to be more sensitive to pain than men (Rolke et al. 2006). This has been also reported in
323
dogs from the same breed when tested for MT (Coleman et al. 2014) and may be related with
324
differences in central processing due to genetic and psychological factors (Blankenburg et al.
325
2010). However, our results showed the opposite pattern for MT and HT. This could be
326
potentially explained, although not statistically significant, by the higher thresholds obtained
327
by females in the younger group compare to adult group, especially on occasion 3.
328
The von Frey filaments determine a tactile sensory threshold, but not a nociceptive threshold.
329
The TST assesses Aβ fibres (Hansson et al. 2007). For the TST, it was impossible to assess
330
presence of mechanical allodynia since it was not present in the sample of healthy dogs tested
331
and the % of response to any the von Frey filaments was very variable (Table 1). A similar
332
pattern was observed with CT, where latency at which the cold stimulus (0 0C) may become
333
nociceptive (assessment of Aδ and C fibres) could not be established due to the lack of
334
response to cold in some dogs/BAs. The upper limits for HT and CT are actually the upper
335
possible safety limits; therefore, a true upper range could not be obtained in this case
336
(censored data). These problems have also been reported in healthy human volunteers (Rolke
337
et al. 2006). Briley et al. (2014) studied the feasibility of the same device used in our study,
338
demonstrating similarly to our finding large variability of response to 0 0C during the same
339
cut off time, with healthy dogs. Dogs with osteoarthritis and spinal cord injury showed lower
340
latencies to 00C compared to healthy dogs (Knazovicky et al. 2016; Gorney et al. 2016).
341
However, further studies in dogs with different pain modalities are needed to elucidate
342
whether this device could be used as a tool to detect allodynia or hyperalgesia, as it seems
343
that 0 0C did not trigger a nociceptive response within 60 seconds in all healthy dogs.
344
Two methods to evaluate TST were compared in this study. The TST50% has been used
345
previously in dogs with cranial cruciate ligament rupture (Brydges et al. 2012) showing good
346
results in identifying individuals with central sensitisation. These authors reported a mean of
M
AN
US
CR
IP
T
AC
CE
PT
ED
900 mN mm in control dogs between the second and the third digit of the hind limb, which
348
corresponds approximately with 300 gf; similar to our findings. It seemed that, although still
349
variable, a higher proportion of healthy dogs responded below the cut off with the TST50%.
350
The present study showed that the TST50% technique was more repeatable, with less 351
variability between subjects and behaved similarly to other tests regarding factors influencing
352
results such as weight category, gender and body areas when compared with the TSTUD. In 353
contrast, the TSTUD did not have a good utility in healthy dogs. 354
For mechanical thresholds, methods of testing need standardisation as wider tip diameters
355
have been associated with higher thresholds and a large data range or between-individual
356
variability (higher SD) in previous studies (Harris et al. 2015; Taylor et al. 2015a). Our
357
results show similar ICCs for the different probe sizes with only slightly higher repeatability
358
using the 2 mm probe as previously reported (Harris et al. 2015). However, other studies used
359
different methods of assessment of test-retest repeatability (Harris et al. 2015; Taylor et al.
360
2015a).
361
In veterinary medicine, the reliability of QST has been assessed with different methods to
362
evaluate variation in QST thresholds over time (Williams et al. 2014; Brydges et al. 2012;
363
Moore et al. 2013; Briley et al. 2014; Gorney et al. 2016; Song et al. 2016). It has been
364
suggested that the most appropriate method to report test-retest repeatability when exploring
365
QST protocols (Moloney, 2012) is the ICC in conjunction with a measure of precision (i.e.
366
95% confidence interval). However, this method has its limitations, especially if the 95% CI
367
is large as occurred for TST and CT in this study. When the variability between individuals is
368
very large, it can also provide a falsely good ICC, and should be interpreted with caution (Lee
369
et al. 2012).
M
AN
US
CR
IP
T
AC
CE
PT
ED
Chong and Cros (2004) defined QST evaluation as a subjective psychophysical test, where
371
the consistency of the data relies on environmental factors, methodological factors and the
372
attention and cooperation of the individual being tested. To help with this possible bias in our
373
study, a feasibility score adapted from a previous study assessing mechanical and thermal
374
thresholds in dogs in lateral recumbency (Briley et al. 2014) was used to evaluate cooperation
375
of dogs and reaction to the stimuli. Feasibility score only affected pTSTUD, thus overall we
376
found good cooperation > 50% of the time, mild sensitivity to being touched and mild
377
variation in reaction to stimuli; sufficient to ensure a good feasibility and repeatability of the
378
STEP. A higher proportion of dogs responded the 3rd testing occasion for CT, probably
379
trying to avoid an uncomfortable sensation learned from previous tests. Other studies
380
evaluating mechanical testing with other devices also showed a learning effect (Coleman et
381
al. 2014).
382
An effect of the operator’s experience was also evident for MT. During second period of
383
testing, not only were MTs lower but also ICCs were slightly better compared with first
384
period, and thorough operator training is advised before clinical use. Standardization of
385
instructions to subjects, training of technicians, machine calibration, stimulus characteristics,
386
and testing algorithms are all essential for accurate and reproducible QST (Chong & Cros
387
2004).
388
Protocols involving QST evaluation in humans include verbal communication of detection
389
thresholds. In veterinary patients, this approach cannot be used and instead reliance must be
390
placed on observable behavioural indicators. In the case of animals with peripheral and
391
central sensitisation, where somatosensory function evaluated by QST encompasses the
392
presence of allodynia or hyperalgesia as well as pain it is not possible to reliably distinguish
393
between thresholds of sensation and nociception. Consequently, some authors view QST as a
M
AN
US
CR
IP
T
AC
CE
PT
ED
semi-objective assessment (Gorney et al. 2016). Nevertheless, QST can provide valuable
395
clinical information regarding the impacts on patients (Brown 2012).
396
Limitations of the study include the small number of dogs tested. Further data may be
397
required to obtain reliable reference values. In future studies, dogs with inability to stand may
398
not be suitable for the current protocol. Position (sitting, laying in lateral recumbency) has
399
been tested in other studies (Harrys et al. 2014; Knazovivky et al. 2016; Gorney et al. 2016)
400
and could be a possibility for these patients. Fatigue from remaining standing was accounted
401
for and short periods of resting were allowed between tests. Clipping may not be possible in
402
some patients with severe allodynia, and the full battery of tests may not be possible to
403
perform in that particular body area: instead, other diagnostic tools could compliment the
404
assessment, including history, imaging tests, chronic pain questionnaires and behavioural
405
response when approaching the area.
406
In conclusion, the sensory testing examination protocol showed substantial to moderate
test-407
retest repeatability for HT and MT in healthy dogs. The STEP was feasible, safe and well
408
tolerated. Cold and tactile sensitivity thresholds showed poor consistency in response to the
409
stimuli and ICCs showed heterogeneity across these data. Further work in dogs with central
410
sensitisation is needed to assess the usefulness and test-retest repeatability of the STEP in
411
practice. Testing only the specific BA of interest could be envisaged to shorten the duration
412
of the protocol when phenotyping different pain conditions. Since weight category was the
413
most significant explanatory variable, nociceptive thresholds for the STEP were displayed
414
based on this covariate and in future should only be compared within weight class. Further
415
studies in dogs with painful conditions should evaluate the utility of each test in detecting
416
sensory abnormalities in dogs.
417
M
AN
US
CR
IP
T
AC
CE
PT
ED
The authors would like to thank Heather Williams, Jo Murrell and Nicolas Granger from the
419
University of Bristol for their collaborative support in this area of research. The authors are
420
very grateful to Transpharmation Ltd. for supporting this work. Many thanks to Mrs Carol
421
Hoy Ncert A&CC, VTS (Anesthesia/Analgesia), RVN for the figure provided. Thank you to
422
all the dog owners for participating in this study.
423
Authors’ contributions 424
SSM: design, data management, data interpretation, statistical analysis and preparation of
425
manuscript; YC: data interpretation, statistical analysis and preparation of manuscript; SA:
426
data interpretation, statistical analysis and preparation of manuscript; AF: data interpretation
427
and preparation of manuscript; HAV: data interpretation and preparation of manuscript; LP:
428
design, data management, data interpretation, statistical analysis and preparation of
429
manuscript.
M
AN
US
CR
IP
T
AC
CE
PT
ED
References 431
Andersen KG, Kehlet H, Aasvang EK (2014) Test-retest Agreement and Reliability of
432
Quantitative Sensory Testing 1 Year after Breast Cancer Surgery. Clin J Pain 31,
393-433
403.
434
Backonja MM, Attal N, Baron R et al. (2013) Value of quantitative sensory testing in
435
neurological and pain disorders: NeuPSIG consensus. Pain 154, 1807-1819.
436
Baron R, Dickenson AH (2014) Neuropathic pain: precise sensory profiling improves
437
treatment and calls for back-translation. Pain 155, 2215-2217.
438
Blankenburg M, Boekens H, Hechler T et al. (2010) Reference values for quantitative
439
sensory testing in children and adolescents: Developmental and gender differences of
440
somatosensory perception. Pain 149, 76-88.
441
Briley JD, Williams MD, Freire M et al. (2014) Feasibility and repeatability of cold and
442
mechanical quantitative sensory testing in normal dogs. Vet J 199, 245-250.
443
Brown DC, Boston RC, Coyne JC et al. (2008) Ability of the canine brief pain inventory to
444
detect response to treatment in dogs with osteoarthritis. J AmVet Med Assoc 233,
445
1278-1283.
446
Brown DC (2012) Quantitative sensory testing: A stimulating look at chronic pain. The
447
Veterinary Journal 193, 315-316.
448
Brydges NM, Argyle DJ, Mosley JR et al. (2012) Clinical assessments of increased sensory
449
sensitivity in dogs with cranial cruciate ligament rupture. Vet J 193, 545-550.
450
Chaplan SR, Bach FW, Pogrel JW et al. (1994) Quantitative assessment of tactile allodynia in
451
the rat paw. J Neurosci Methods 53, 55-63.
452
Chong PS, Cros DP (2004) Technology literature review: quantitative sensory testing.
453
Muscle Nerve 29, 734-747.
M
AN
US
CR
IP
T
AC
CE
PT
ED
Coleman KD, Schmiedt CW, Kirkby KA et al. (2014) Learning Confounds Algometric
455
Assessment of Mechanical Thresholds in Normal Dogs. Vet Surg 43, 361-367.
456
Edwards RR, Dworkin RH, Turk DC et al. (2016) Patient phenotyping in clinical trials of
457
chronic pain treatments: IMMPACT recommendations. Pain May 5. Epub ahead of
458
print.
459
Finnerup NB, Haroutounian S, Kamerman P et al. (2016) Neuropathic pain: An updated
460
grading system for research and clinical practice. Pain. 2016 Apr 28. Epub ahead of
461
print.
462
Gorney AM, Blau SR, Dohse CS et al. (2016) Mechanical and Thermal Sensory Testing in
463
Normal Chondrodystrophoid Dogs and Dogs with Spinal Cord Injury caused by
464
Thoracolumbar Intervertebral Disc Herniations. J Vet Intern Med.;30,627-35. doi:
465
10.1111/jvim.13913.
466
Greenspan JD (2001) Quantitative assessment of neuropathic pain. Curr Pain Headache Rep
467
5, 107-113.
468
Grone E, Crispin A, Fleckenstein J et al. (2012) Test order of quantitative sensory testing
469
facilitates mechanical hyperalgesia in healthy volunteers. J Pain 13, 73-80.
470
Hansson P (2002) Neuropathic pain: clinical characteristics and diagnostic workup. Eur J
471
Pain 6, Supplement A, 47-50.
472
Hansson P, Backonja M, Bouhassira D (2007) Usefulness and limitations of quantitative
473
sensory testing: clinical and research application in neuropathic pain states. Pain 129,
474
256-259.
475
Harris LK, Murrell JC, van Klink EG et al. (2015) Influence of experimental protocol on
476
response rate and repeatability of mechanical threshold testing in dogs. Vet J.
M
AN
US
CR
IP
T
AC
CE
PT
ED
Hoffmann MV, Kastner SB, Kietzmann M et al. (2012) Contact heat thermal threshold
478
testing in beagle dogs: baseline reproducibility and the effect of acepromazine,
479
levomethadone and fenpipramide. BMC Vet Res 8, 206.
480
Hunt JR, Grint NJ, Taylor PM et al. (2013) Sedative and analgesic effects of buprenorphine,
481
combined with either acepromazine or dexmedetomidine, for premedication prior to
482
elective surgery in cats and dogs. Vet Anaesth Analg 40, 297-307.
483
Knazovicky D, Helgeson ES, Case B et al. (2016) Widespread somatosensory sensitivity in
484
naturally occurring canine model of osteoarthritis. Pain157,1325-32. doi:
485
10.1097/j.pain.0000000000000521.
486
Landis JR, Koch GG (1977) The measurement of observer agreement for categorical data.
487
Biometrics 33, 159-174.
488
Lascelles BDX (2013) Getting a sense of sensations. Vet J 197, 115-117.
489
Lee KM, Lee J, Chung CY et al. (2012) Pitfalls and important issues in testing reliability
490
using intraclass correlation coefficients in orthopaedic research. Clinics in orthopedic
491
surgery 4, 149-155.
492
Mathews KA (2008) Neuropathic pain in dogs and cats: if only they could tell us if they hurt.
493
Vet Clin Small Anim 38, 1365-1414.
494
Moloney NA, Hall TM, Doody CM (2012) Reliability of thermal quantitative sensory testing:
495
a systematic review. J Rehabil Res Dev 49, 191-207.
496
Moore SA, Hettlich BF, Waln A (2013) The use of an electronic von Frey device for
497
evaluation of sensory threshold in neurologically normal dogs and those with acute
498
spinal cord injury. Vet J 197, 216-219.
499
Reimer M, Helfert SM, Baron R (2014) Phenotyping neuropathic pain patients: implications
500
for individual therapy and clinical trials. Curr Opin Support Palliat Care 8, 124-129.
M
AN
US
CR
IP
T
AC
CE
PT
ED
Rolke R, Baron R, Maier C et al. (2006) Quantitative sensory testing in the German Research
502
Network on Neuropathic Pain (DFNS): Standardized protocol and reference values.
503
Pain 123, 231-243.
504
Song RB, Basso DM, da Costa RC et al. (2016) von Frey anesthesiometry to assess sensory
505
impairment after acute spinal cord injury caused by thoracolumbar intervertebral disc
506
extrusion in dogs. Vet J 209, 144-149.
507
Taylor PM, Crosignani N, Lopes C et al. (2015a) Mechanical nociceptive thresholds using
508
four probe configurations in horses. Vet Anaesth Analg. doi: 10.1111/vaa.12274.
509
[Epub ahead of print]
510
Taylor PM, Hoare HR, de Vries A et al. (2015b) A multicentre, prospective, randomised,
511
blinded clinical trial to compare some perioperative effects of buprenorphine or
512
butorphanol premedication before equine elective general anaesthesia and surgery.
513
Equine Vet J. doi: 10.1111/evj.12442. [Epub ahead of print]
514
Taylor PM, Robertson SA, Dixon MJ (2007) Evaluation of the use of thermal thresholds to
515
investigate NSAID analgesia in a model of inflammatory pain in cats. J Feline Med
516
Surg 9, 313-318.
517
Tomas A, Marcellin-Little DJ, Roe SC et al. (2014) Relationship Between Mechanical
518
Thresholds and Limb Use in Dogs With Coxofemoral Joint OA-Associated Pain and
519
the Modulating Effects of Pain Alleviation From Total Hip Replacement on
520
Mechanical Thresholds. Vet Surg 43, 542-548.
521
Vangeneugden T, Laenen A, Geys H et al. (2004) Applying linear mixed models to estimate
522
reliability in clinical trial data with repeated measurements. Control Clin Trials 25,
523
13-30.
M
AN
US
CR
IP
T
AC
CE
PT
ED
Walk D, Sehgal N, Moeller-Bertram T et al. (2009) Quantitative sensory testing and
525
mapping: a review of nonautomated quantitative methods for examination of the
526
patient with neuropathic pain. Clin J Pain 25, 632-640.
527
Werner MU, Petersen MA, Bischoff JM (2013) Test-retest studies in quantitative sensory
528
testing: a critical review. Acta Anaesthesiol Scand 57, 957-963.
529
Whitaker LH, Reid J, Choa A et al. (2016) An Exploratory Study into Objective and
530
Reported Characteristics of Neuropathic Pain in Women with Chronic Pelvic Pain.
531
PloS one 11, e0151950.
532
Williams MD, Kirkpatrick AE, Griffith E et al. (2014) Feasibility and repeatability of thermal
533
quantitative sensory testing in normal dogs and dogs with hind limb
osteoarthritis-534
associated pain. Vet J 199, 63-7.
535
Woolf CJ, Salter MW (2000) Neuronal plasticity: increasing the gain in pain. Science 288,
536
1765-1769.
537
Younis S, Maarbjerg S, Reimer M et al. (2016) Quantitative sensory testing in classical
538
trigeminal neuralgia-a blinded study in patients with and without concomitant
539
persistent pain. Pain 157, 1407-1414.
540
M
AN
US
CR
IP
T
AC
CE
PT
ED
List of figures: 542
Figure 1 Consort flow diagram of dogs included in the study. TSTUD: up-down technique
543
method of testing; TST50%: 50% of response technique method of testing; MT: mechanical
544
threshold 2, 4 and 8 mm size probe; HT: heat threshold; CT: cold threshold.
545
Figure 2 Body areas tested and anatomical localization. 546
1) Left and right tibias: mid-point between the stifle joint and the hock on the lateral aspect of
547
the tibia;
548
2) Left and right humeri: mid-point between the scapulo-humeral joint and the elbow on the
549
lateral aspect of the humerus;
550
3) Left and right neck: mid-point between the atlas wings and the cranial aspect of the body
551
of the scapula on the lateral aspect of the neck;
552
4) Left and right thoraco-lumbar (T-L): palpate the last rib-vertebrae union. At that level,
553
palpate the spinous process. Testing point is located 1cm (small dog) to 3cm (large dog)
554
lateral to the spinal process;
555
5) Left abdomen: mid-point between midline and the fold of the flank.
556
Illustration courtesy of Mrs Carol Hoy
557
Figure 3 Median, interquartile range and min-max thresholds of the sensory threshold 558
examination protocol (STEP). The three different weight categories are displayed on the
559
figure. For statistical difference between body areas see Table S3.
560
A, B, C: MT: mechanical threshold with the 2, 4, and 8 mm size probe; N: Newton
561
D, E: TST: tactile sensitivity threshold; gf: grams of force;
562
F: HT: heat thresholds (0C)
563
G CT: cold latency (seconds),
M
AN
US
CR
IP
T
AC
CE
PT
ED
H: Probability of response to von Frey filaments (TST) on different body areas (%).TSTUD:
565
up-down technique method of testing; TST50%: 50% of response technique method of testing.
566
I: Probability of response to Cold stimulus (%)
567
M
AN
US
CR
IP
T
AC
CE
PT
ED
Table 1 Mechanical (MT) and heat thresholds mean, standard deviation (SD) and range obtained for the different probes and the different weight
categories. Response to tactile stimulus and cold stimulus (%), tactile sensitivity threshold (TST) method 1 and 2 and cold latency (at 00C),
median and range obtained in the different body areas and weight categories. Values were log-transformed for the analysis and back-transformed
for MT.
Variable Dog size Body Area
Tibia Humerus Neck T-L Abdomen
MT 2 mm
probe (N)
Small (1 ̶ 8 kg) 4.6 ± 1.6
(1.7 ̶ 10.50)
4.3 ± 1.5
(1.62 - 9.12)
7.9 ± 1.3
(5.13 - 11.75)
5.8 ± 1.6
(1.95 - 12.02)
3.4 ± 1.6
(1.74 - 6.76)
Medium (9 - 22kg) 5.6 ± 1.4
(3.63 - 13.18)
5.6 ± 1.4
(2.69 - 12.02)
9.8 ± 1.3
(5.25 - 15.49)
5.9 ± 1.5
(2.29 - 14.79)
2.8 ± 1.6
(1.55 - 5.25)
Large (23-40kg) 7.1 ± 1.6
(2.51 - 18.62)
7.1 ± 1.4
(3.89 - 14.79)
13.5 ± 1.5
(3.39 - 25.12)
8.3 ± 1.5
(2.69 - 20.42)
4.8 ± 1.7
(1.05 - 11.22)
MT 4 mm
probe (N)
Small (1 ̶ 8 kg) 6.5 ± 1.6
(2.45 - 14.79)
5.7 ± 1.5
(1.41 - 15.14)
9.8 ± 1.4
(3.89 - 16.98)
8.1 ± 1.5
(3.09 - 17.38)
4.4 ± 1.7
(1.86 - 8.32)
M
AN
US
CR
IP
T
AC
CE
PT
ED
(2.63 - 14.45) (4.68 - 11.75) (8.13 - 19.50) (3.72 - 15.140 (1.86 - 10.47)
Large (23-40kg) 9.5 ± 1.4
(3.8 - 20.89)
9.9 ± 1.3
(3.72 -16.98)
16.1 ± 1.3
(7.94 - 22.91)
10.3 ± 1.5
(3.31 - 24.55)
7.2 ± 1.5
(3.09 - 15.49)
MT 8 mm
probe (N)
Small (1 ̶ 8 kg) 9.7 ± 1.3
(5.89 - 16.22)
8.9 ± 1.4
(2.69 - 15.49)
12.2 ± 1.4
(4.47 - 19.95)
12.9 ± 1.4
(6.31 - 21.88)
7.2 ± 1.6
(2.63 - 11.75)
Medium (9- 22kg) 11.1 ± 1.3
(7.24 - 19.05)
11.1 ± 1.4
(5.37 - 18.20)
15.9 ± 1.3
(9.77 - 22.91)
11.4 ± 1.5
(2.75 - 22.39)
6 ± 1.5
(2.75 - 2.75)
Large (23-40kg) 13.5 ± 1.4
(6.31 - 24.55)
13.8 ± 1.3
(7.41 - 25.12)
20.6 ± 1.4
(7.41 - 34.67)
15 ± 1.5
(4.47 - 33.88)
9.8 ± 1.7
(3.8 - 29.51)
Heat
Threshold (°C)
Small (1 ̶ 8 kg) 43.0 ± 2.5
(39.10 - 50.25)
45.0 ± 3
(40.30 - 50.87)
48.2 ± 3.2
(44.10 - 55.00)
47.5 ± 3.5
(42.23 - 55.00)
44.7 ± 3.3
(40.90 - 40.90)
Medium (9- 22kg) 43.8 ± 3.1
(39.57 - 50.20)
46.6 ± 3.6
(41.40 - 55.00)
48.5 ± 3.9
(40.70 - 55.00)
47.3 ± 3.5
(40.60 - 55.00)
43.9 ± 2.1
(40.70 - 46.50)
Large (23-40kg) 46.4 ± 4
(38.80 - 55.00)
49.4 ± 3.7
(39.85 - 55.00)
51.9 ± 3.4
(40.00 - 55.00)
51.3 ± 3.4
(43.27 - 55.00)
46.8 ± 4.5
(37.75 - 55.00)
M
AN
US
CR
IP
T
AC
CE
PT
ED
(gf) 79.43
(7.84 - 597.50)
130.80
(8.88 - 597.50)
597.50
(24.05 - 597.50)
164.40
(11.91 - 597.50) 372
(11.91 - 597.50)
Medium (9 - 22kg) (14/18) 77.7%
180
(46.64 -597.50)
(6/18) 33.3%
597.50
(72.21 - 597.50)
(2/18) 11.1%
597.50
(279.1 - 597.50)
(11/18) 61.1%
311.70
(101.2 - 597.50)
(5/9) 55.5%
597.50
(71.21 - 597.50)
Large (23 - 40kg) (24/44) 54.5%
311.70
(6.82 - 597.50)
(13/44) 29.5%
597.50
(7.55 - 597.50)
(5/44) 11.3%
597.50
(47.66 - 597.50)
(23/44) 52.3%
303.10
(7.94 - 597.50)
(9/22) 40.9%
597.50
(11.66 - 597.50)
TST50%
(gf)
Small (1 ̶ 8 kg) (11/16) 68.7 %
300
(180 - 300)
(6/16) 37.5%
300
(100 - 300)
(2/16) 12.5%
300
(180 - 300)
(9/16) 56.2%
300
(180 - 300)
(2/7) 28.5%
300
(300 - 300)
Medium (9- 22kg) (10/14) 71.42%
100
(4 - 300)
(15/18) 83.3%
240
(4 - 300)
(6/18) 33.3%
300
(180 - 300)
(17/18) 94.4%
180
(8 - 300)
(5/7) 71.4%
180
(4 - 300)
Large (23-40kg) (4/4) 100%
M
AN
US
CR
IP
T
AC
CE
PT
ED
(15 - 300) (300 - 300) (300 - 300) (300 - 300) (300 - 300)
Cold 0C
(seconds)
Small (1 ̶ 8 kg) (43/123) 35 %
60
(11.41 - 60)
(18/123) 14.6%
60
(28.17 - 60)
(18/126) 14.6%
60
(31.40 - 60)
(15/126) 11.9%
60
(11.97 - 60)
(4/63) 6.3%
60
(48.33 - 60)
Medium (9- 22kg) (79/78) 35.2%
58.84
(9.83 - 60)
(19/75) 25.3%
60
(9.40 - 60)
(5/78) 6.4%
60
(32.40 - 60)
(8/78) 10.2%
60
(9.30 - 60)
(10/39) 25.6%
60
(21.8 - 60)
Large (23-40kg) (71/132) 53.8%
43.25
(18.50 - 60)
(38/129) 30.2%
60
(41 - 60)
(38/132) 28.7%
56.36
(6.4 - 60)
(35/129) 27.1%
60
(9.38 - 60)
(24/66) 36.6%
54.16
(12.27 - 60)
T- L, thoraco- lumbar area; (gf), gram of force; N, Newton; TSTUD, tactile sensitivity thresholds up-down technique method; TST50%, tactile
M
AN
US
CR
IP
T
AC
CE
PT
ED
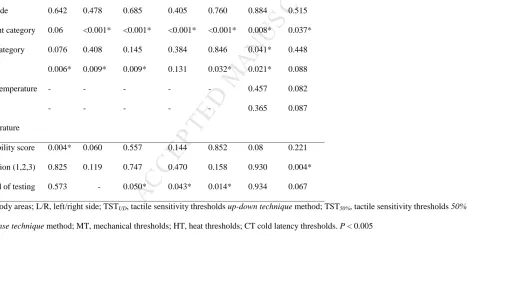
Table 2 Results of linear mixed model and general linear mixed model. Effect of body area, weight category, age category, sex and factors of
reliability and performance of the protocol (occasion, feasibility scores and period of testing) on TST, MT, CT, HT.
Fixed Effect TSTUD TST50% MT2mm M4mm MT8mm HT CT
BA 0.783 0.001* <0.001* <0.001* <0.001* <0.001* <0.001*
L/R side 0.642 0.478 0.685 0.405 0.760 0.884 0.515
Weight category 0.06 <0.001* <0.001* <0.001* <0.001* 0.008* 0.037*
Age category 0.076 0.408 0.145 0.384 0.846 0.041* 0.448
Sex 0.006* 0.009* 0.009* 0.131 0.032* 0.021* 0.088
Skin temperature - - - 0.457 0.082
Room
temperature
- - - 0.365 0.087
Feasibility score 0.004* 0.060 0.557 0.144 0.852 0.08 0.221
Occasion (1,2,3) 0.825 0.119 0.747 0.470 0.158 0.930 0.004*
Period of testing 0.573 - 0.050* 0.043* 0.014* 0.934 0.067
BA, body areas; L/R, left/right side; TSTUD, tactile sensitivity thresholds up-down technique method; TST50%, tactile sensitivity thresholds 50%
M
AN
US
CR
IP
T
AC
CE
PT
ED
Table 3 Intra-class correlation coefficient (ICC) and 95% confidence interval (CI) of the different tests of the STEP and ICC of MT for the two
different periods of testing, where differences in MT were observed in the linear mixed effect model. There is a mild improvement in ICCs
between period 1 and period 2 with the 3 different probes.
TSTUD TST50% MT2 MT4 MT8 HT CT
ICC 0.001 0.71 0.72 0.69 0.68 0.58 0.51
95% CI N/A 0.1-1 0.58-0.86 0.52-0.85 0.51-0.84 0.34-0.86 0.22-0.77
Period 1 ICC N/A N/A 0.72 0.65 0.65 N/A N/A
Period 2 ICC N/A N/A 0.75 0.78 0.76 N/A N/A
TSTUD, tactile sensitivity thresholds up-down technique method; TST50%, tactile sensitivity thresholds 50% response technique method; MT,
M
AN
US
CR
IP
T
AC
CE
M
AN
US
CR
IP
T
AC
CE
M
AN
US
CR
IP
T
AC
CE
M
AN
US
CR
IP
T
AC
CE
PT
ED
Appendix 1 Feasibility scores. Adapted from (Briley et al. 2014)
Feasibility score Description
0 – No problem Minimum restraint needed; excellent cooperation; clear reaction to stimuli
1 – Mild difficulty Mild restraint needed; good cooperation; clear reaction to stimuli
2 – Moderate difficulty
Moderate restraint needed; good cooperation >50% of the time; mild sensitivity to being touched; mild variation in reaction to stimuli
3 – Significant difficulty
Significant restraint needed and resisted sternal position; good
cooperation <25% of the time; moderate sensitivity to being touched; moderate variation in reaction to stimuli
4 – Extreme difficulty
Constant restraint required; not cooperative; unclear reaction to stimuli, not confident in data collected
M
AN
US
CR
IP
T
AC
CE
PT
ED
Appendix 2 Body weight and age categories of the sample of dogs.
Dogs
Category Classification n %
Age (Years) Young (0.3 – 3) 9 36
Adult (4 – 6) 9 36 Senior (> 6) 7 28
Weight (kg) Small (1 -8) 10 40
Medium (9 -22) 6 24 Large (23-40) 9 36
M
AN
US
CR
IP
T
AC
CE
M
AN
US
CR
IP
T
AC
CE
PT
ED
Appendix 3 Post Hoc comparisons, odds ratio (OR) and estimated mean differences comparing body areas, weight category, age category, sex,
feasibility score, occasion tested and period of testing. Main differences for mechanical thresholds (MT) 2, MT4 and MT8 are displayed as back
log transformed.
Pairwise
comparison
pTSTUD pTST50% MT2 (N) MT4 (N) MT8 (N) HT (
0
C) pCT
BA OR
P-value
OR P-value Mean
difference
P-value Mean
difference
P-value Mean
difference
P-value