Article
1
Study of the Mobilization of Uranium Isotopes in a
2
Sandstone Aquifer Using Methods for the Extraction
3
of Uranium with Different Strength Reagents in
4
Combination with Groundwater Data
5
Alexander I. Malov* and Sergey B. Zykov
6
Federal Center for Integrated Arctic Research of Russian Academy of Sciences; Arkhangelsk, 163061, Russia;
7
[email protected]; [email protected]
8
* Correspondence: [email protected]; Tel.: +7-911-571-71-72
9
10
Abstract:
A partial extraction procedure was used to study the distribution of uranium in the11
mineral phases of rocks of an aquifer of sandy-clay deposits of the Vendian in the northwest of
12
Russia. This work is a part of a research project to develop a method for combined radiocarbon and
13
uranium-isotope dating of groundwater. Representative aliquots of each core sample were
14
subjected to five "partial" extractions by treatment with: distilled water, low mineralized fresh
15
natural groundwater, minopolycarboxylic acid chelating agent (0.05M EDTA), 0.5M HCl, 15M
16
HNO3, and a total digestion, with U isotopes reported in this study for each procedure. The
17
following mineral phases of core samples: adsorbed material, carbonate minerals, amorphous iron
18
oxides, aluminosilicates partial digestion and a crystalline iron oxides, aluminosilicates total
19
digestion and a clay/quartz resistate were characterized. Red-colored siltstones depleted in
20
uranium in relatively readily soluble mineral phases. The concentration of adsorbed uranium was
21
established in the amount of 15.8±2.1 - 30.5±3.9 μg/kg. Carbonate minerals contain even less of this
22
element. In iron hydroxides and the most readily soluble aluminosilicates, its concentrations are in
23
the range 168±24 - 212±28 μg/kg. The most insoluble fraction contains 1.65±0.21 - 4.32±0.45 mg/kg of
24
uranium. In green-colored siltstones, the concentration of adsorbed uranium is much higher:
25
106±14 - 364±43 μg/kg. Carbonate minerals and amorphous iron oxides contain 1.91±0.21 - 2.34±0.26
26
mg/kg of uranium. In aluminosilicates and a clay/quartz resistate, uranium concentrations are
27
5.6±0.5 - 16.8±1.4 mg/kg. Elevated values of 234U:238U activity ratio prevail in the adsorbed material
28
and iron hydroxides. In aluminosilicates and clay/quartz resistate, the values decrease. This
29
indicates the replacement of primary sedimentogenic uranium by secondary hydrogenic uranium
30
adsorbed on the surface of minerals and coprecipitated with iron hydroxides. The results obtained
31
made it possible to carry out preliminary quantitative estimates of the retardation factor and recoil
32
loss factor of uranium in the groundwater of siltstones of the studied Vendian aquifer.
33
Keywords: Partial extraction, Mineral phases, Uranium, Disequilibrium, Retardation factor
34
1. Introduction
35
Uranium isotopes are a powerful tool for refining conceptual models of groundwater [1–4],
36
groundwater dating [5–7] and descriptions of chemical weathering processes [8–10] for up to
37
hundreds of thousands of years [11]. The main initial parameters are i) measured concentration of
38
238U in the combined solution and solid phase, and ii) measured 234U:238U activity ratio in the
39
combined pore fluid and solid phase. They can be obtained by direct measurements in water and
40
rock samples taken in the field.
41
However, the interpretation of the results is rather complicated. This is due to the heterogeneity
42
of the rocks in their composition. For example, sandy clay sediments of aquifers can contain both
43
poorly soluble grains of quartz and feldspar, as well as soluble carbonate and gypsum cements.
44
Carbonates, iron oxides, and clay minerals are characterized by increased U adsorption on their
45
surfaces [12–14]. Further, daughter nuclides pass most actively into water from surface coatings [15],
46
increasing the ratio of isotope activities in water. In addition, the similarity of the activity ratios of
47
234U:238U in groundwater and in the most easily leached fractions of water-bearing rocks was noted in
48
the experiments of Lowson et al. [16] , Payne et al. [17], and Dabous et al. [18]. These fractions were
49
defined as adsorbed elements, carbonate minerals and amorphous iron minerals [19]. This may
50
indicate the opposite process: the transition of nonequilibrium nuclides from water to rock with an
51
increase in the ratio of U isotope activities in the rock [20]. Under such conditions, it is difficult to
52
estimate the rate of chemical weathering by using the currently developed methods [21-22].
53
Therefore, for a more complete understanding of the behavior of uranium isotopes in the
54
water-rock system, a transition from the presentation of solely total concentration and activity data
55
to an additional analysis for finding individual “weak” leach extractants or sequential extractions is
56
necessary. In recent decades, leach data, rather than total decomposition data are widely used in a
57
variety of fields of geoecology (see for example [23-26]). Therefore, in the present work, an attempt is
58
made to use the partial extraction procedure for reconstructing the processes of redistribution of
59
uranium isotopes in certain mineral phases of an aquifer of sandy-clay deposits of the Vendian.
60
In a previous papers [27-28], the possibility of sharing uranium and carbon isotopes for dating
61
groundwater was discussed. The transport of uranium in solution is reasonably well described with
62
a standard advection-dispersion-exchange formulation:
63
adsorption
decay
ion
precipitat
production
desorption
recoil
weathering
advection
time
=
+
+
+
+
−
−
−
64
[5-7]. Among the many factors, the main ones are t – Groundwater residence time in the aquifer
65
(time), v– Groundwater flow velocity (advection), Rd –Dissolution rate (weathering - precipitation),
66
R– Retardation factor (adsorption - desorption), р– Recoil loss factor (recoil + production), and λ4 –
67
Decay constants for 234U (decay). Suitable equations were derived by Andrews and Kay [29],
68
Fröhlich and Gellermann [30], Ivanovich et al. [9], and Porcelli [5] to provide a 234U–238U dating
69
method for groundwater under oxidizing conditions. However, the values of R, Rd (a-1) and p needed
70
to be determined. In turn, the recoil loss factor value p depends on the SSA (specific surface area).
71
The published SSA values in sandy aquifers range from 0.9–1.8 m2.kg-1 [31] to 330–390 m2.kg-1 [6].
72
Accordingly, the ranges of R and Rd can be calculated using these formulas. Therefore, we consider it
73
more appropriate to show R, Rd and p in the form of their ratios: Rd:p (a-1), R:p and Rd:R (a-1) . The
74
main calculated equations are as follows [27]:
75
4 1
)
ln(
−=
k
t
, wherep
C
M
AR
R
C
k
Rs t W
−
−
=
8
8
(
1
)
1
(1)Where
C
8Wis the concentration of uranium in water;C
8Ris the concentration of uranium in77
the rock;
AR
t- 234U/238U is the activity ratio in the water sample; sM
is the solid mass to fluid78
volume ratio.
79
In this case, two unknown parameters remain in formula (1), which cannot be directly
80
measured in water and rock samples:
t
andR
/
p
. Therefore, in order to use equation (1), it is81
necessary to make several determinations of the groundwater age by other methods, for example,
82
using isotopes of carbon. Then, we need to find out whether there is an increase in uranium
83
concentrations in groundwater with a decrease in the concentration of radiocarbon. If this is the case,
84
then the mean values
R
/
p
for the studied aquifers are determined. After this, uranium-isotopic85
dating of other groundwater samples is carried out, which is less labor-intensive and more accessible
86
than radiocarbon dating. The average value of the retardation factor/recoil loss factor ratio (
R
/
p
) in87
samples from the sandstone aquifer of the upper Vendian strata and overlying horizons is assumed
88
to be (24±4) [27].
89
In this work, it was planned, by determining the amount of uranium adsorbed on the surface of
90
mineral particles, to proceed to a separate assessment of the values of the retardation factor and
91
recoil loss factor of uranium in the groundwater of siltstones of the studied Vendian aquifer.
92
2. Materials
93
The borehole GGS2-11 is located in the northwest of Russia at the diamond deposit area
94
(N65°20'48" E41°06'10") and was drilled using a diamond drill bit (92 mm inner diameter, 112 mm
95
outer diameter) and mud rotary methods to 101.2 m below ground surface in July 2018. This core
96
was selected for the present study because the sampled section traverses the aquifer of the Padun
97
formation of the Vendian (Vpd) [27, 28] which is of interest in the present study. For this study, 5
98
samples were taken from the intervals of 66.7-66.8, 75.2-75.3, 83.9-84, 94-94.1, 99.5-99.6 m (Fig. 1).
99
The samples were quickly packed in airtight polythene bags. The sample mass collected in each
100
case was about 1500 g. Sub-samples of the material were oven dried at 40 °C for 7 days and
101
homogenized by grinding with an agate mortar and pestle to pass through a 125 μm sieve. The
102
prepared material was stored in glass bottles for sequential extractions and isotopic analyses.
103
The chemical and mineralogical composition of the Vendian deposits in the area of the diamond
104
deposit was studied in detail during different periods of geological exploration [32-35]. The Padun
105
Formation, 160 m thick, mainly consists of sandstones (60-80%) and siltstones (20-30%) separated by
106
mudstone interlayers. The rocks have reddish brown color with pale green lenses and patches. The
107
sandstones are dominated by fine- and medium-grained varieties. The content of pelitic particles
108
does not exceed 20%. Clastic material is represented by quartz. Feldspars, chalcedony, quartzite
109
fragments, biotite, and clayey aggregates are insignificant. The cement has mainly a clayey
110
(hydromicaceous)-ferruginous composition. Carbonate and gypsum cement is also encountered. In
111
the upper part of the sequence (thickness ~50 m), the sandstones are poorly cemented and often
112
represented by sands. The siltstones are dominated by the coarse-grained fraction. The clastic grains
113
consist of quartz (up to 98%), feldspars (up to 10%), and micas (~1%). The cement has
114
clayey-ferruginous, carbonate-clayey, and less common gypsum compositions. Clay minerals are
115
observed as hydromicas, kaolinite, and chlorite. Bitumen and organic carbon are nearly absent. The
ratio of Fe2O3 and FeO forms of iron in “red” siltstones is ~ 17: 1. In “green” siltstones, the Fe2O3
117
content is 2.7 times lower (Table 1).
118
119
120
Figure 1. Photos of samples of studied rocks. 1 - Green siltstones, 66.7-66.8 m. 2 - Red sandstones,
121
75.2-75.3 m. 3 - Variegated siltstones, 83.9-84 m. 4 - Red siltstones, 94-94.1 m. 5-6 - Green siltstones,
122
99.5-99.6 m(photo S. Druzhinin)
123
The description of the samples of the studied rocks was performed on five thin sections of core
124
samples (see Appendix A).
125
Table 1. The average chemical composition of the red siltstones of the Padun Formation of the
126
Vendian in research area (from 18 determinations) [34] and green siltstones of the sample GGS2-11
127
(depth 99.5 m), %
128
SiO2 Al2O3 СаО MgO Na2O K2O
a RSi 72 12.8 0.48 1.24 0.14 2.94
b GSi 74.6 12.5 0.39 1.34 0.16 4.48
129
Fe2O3 FeO TiO2 Cr2O3 MnO P2O5 cLOI
a RSi 5.3 0.3 0.81 0.02 0.14 0.07 3.36
b GSi 1.99 0.3 0.91 0.07 0.01 0.11 2.74
a RSi - red siltstones. b GSi - green siltstones. c LOI - loss on ignition.
130
3. Methods
131
Representative aliquots of each core sample were subjected to five "partial" extractions and a
132
total digestion, with U isotopes reported in this study for each procedure. The various procedures
133
are described hereinafter.
3.1. Partial extractions
135
Distilled water
136
500 ml distilled water was mixed with 50 g of core sample in centrifuge tubes and shaken for 1
137
hr on an end-over-end shaker at room temperature. The short duration of the laboratory
138
experiments suggests that dissolution depends upon the ease with which the fine particulates may
139
be freed from the rock surface [36-37]. Firstly, this procedure refers to adsorbed particles.
140
Low mineralized fresh natural groundwater
141
500 ml of low mineralized water of Ca-Mg-Na-HCO3 composition from the borehole had total
142
dissolved solids (TDS) of 285 mg/L (see [28]) and was mixed with 50 g of core sample in centrifuge
143
tubes and shaken for 1 hr on an end-over-end shaker at room temperature. Firstly, adsorbed
144
material was released.
145
The following four stages were carried out according to the method proposed by Sutherland et
146
al. [26].
147
0.05MEDTA
148
Aminopolycarboxylic acid chelating agent (EDTA) at the concentration and pH level used in
149
this study was the weakest extractant after fresh groundwater [26]. As an extractant, EDTA has
150
been widely used in environmental geochemistry. Complexants like EDTA are frequently used to
151
release the readily available (labile) fraction of materials [26]. In our case, this is carbonate cement.
152
The procedure outlined by Singh et al. [38] was followed in this study. 500 mL of 0.05M EDTA (pH
153
7) was mixed with 50 g of core sample in centrifuge tubes and shaken for 1 hr on an end-over-end
154
shaker at room temperature.
155
0.5M HCl
156
According to a review by Sutherland et al. [26], HCl dissolves complexed, adsorbed,
157
precipitated, amorphous or poorly crystallized Fe compounds without significant attack on the
158
crystal lattice. In the present study, 500 mL of 0.5M HCl was mixed with 50 g of core sample and
159
shaken at room temperature for 1 hr on an end-over-end shaker.
160
15М HNO3
161
Nitric acid is an oxidizing agent that is not as powerful in its attack on aluminosilicates as HF,
162
and is thus said to be a partial digestion. Also, crystalline iron oxide is digested by hot HNO3. In the
163
present study, 500 mL of 15М HNO3 was mixed with 25 g of core sample and heated for 1 hr while
164
stirring. The resulting solution was evaporated to wet salts, topped up with 500 ml of distilled water
165
and acidified with HCl to pH 1-2.
166
3.2. Measurements of uranium isotopes after five "partial" extractions
167
Determinations of uranium isotopes in the resulting solution were made in accordance with
168
Malyshev et al. [39] which is also described in Fröhlich [40]. Spectrometric detection of alpha
169
particles was performed using an alpha spectrometer (PROGRESS-ALPHA, 'DOZE', Russia) with
170
uncertainty of 10-15%. Total error of analysis is defined by δ = δst + δsys (statistical + systematic).
171
Measurement uncertainties for U are reported individually (Table 2). Efficiency of 232U extraction
172
was 40-50%.
173
3.3. Total digestion
174
Measurements of uranium isotopes were made in accordance with Malyshev et al. [41]. For
175
these analyses, 10 g of core sample was placed in a porcelain crucible and calcined at 500 °C until
176
complete combustion of organic substances. The residue was transferred into a Teflon cup wetted
177
with distilled water. A weighed amount of spiked solution (with known activity of internal
178
standard 232U) was added, followed by 10 cm3 of 15М HNO3 and then heated until the reddish
179
brown NO2 gas vapor disappears. Then after cooling 40 cm3 of 29M HF and 10 cm3 of 12M HClO4
180
were added. The covered Teflon cup was heated until HClO4 vapor appeared. HF treatment was
181
repeated twice; the cup was cooled each time before adding acid and heating until HClO4 fumes
182
were visible. After dissolution and cooling, the edge of the cup and the cover were rinsed with
183
distilled water and the content was transferred to an open Teflon™ dish, where the solution was
184
evaporated again until dense white fumes appeared. This procedure was repeated twice. Finally,
185
the residue was evaporated to give moist salts, which were dissolved in boiling 7M HNO3 (50 cm3).
186
The undissolved residue was filtered off and washed three times with 5-10 cm3 portions of hot 7M
187
HNO3 and added to the solution. The U solution was transferred to a separatory funnel and a 30%
solution of freshly purified tributylphosphate in toluene was added to give an aqueous to organic
189
phase ratio of 4:1. Radionuclides were extracted for 5 min. After phase separation, the lower layer
190
was poured back into the beaker. The organic extract was washed twice with an equal volume of
191
7M HNO3, then with an equal volume of 0.25M HNO3 solution in 0.04M HF. The back-extraction of
192
uranium isotopes was performed by washing the organic phase with an equal volume of distilled
193
water three times for 1 min each. The pooled aqueous extracts were evaporated to dryness, treated
194
with 5 cm3 of concentrated HNO3 to remove trace organic substances, and evaporated to dryness.
195
The dry residue containing uranium was dissolved in 10 mL of 2% sodium carbonate with heating,
196
then filtered. Dissolved uranium was electrodeposited on polished stainless steel plates for alpha
197
spectrometry.
198
199
4. Results
200
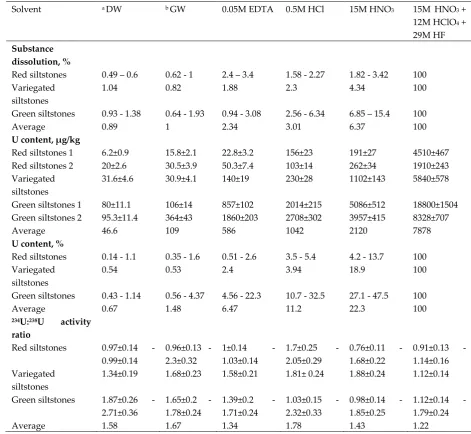
Table 2 and Figs. 2 and 3 show the results of five “partial” extractions and total digestion of the
201
five core samples.
202
Table 2. Distribution of uranium and measured 234U:238U activity ratios in extracted phases
203
Solvent a DW b GW 0.05M EDTA 0.5М HCl 15М HNO3 15М HNO3 + 12M HClO4 + 29M HF Substance
dissolution, %
Red siltstones 0.49 – 0.6 0.62 - 1 2.4 – 3.4 1.58 - 2.27 1.82 - 3.42 100 Variegated
siltstones
1.04 0.82 1.88 2.3 4.34 100
Green siltstones 0.93 - 1.38 0.64 - 1.93 0.94 - 3.08 2.56 - 6.34 6.85 – 15.4 100
Average 0.89 1 2.34 3.01 6.37 100
U content, µg/kg
Red siltstones 1 6.2±0.9 15.8±2.1 22.8±3.2 156±23 191±27 4510±467 Red siltstones 2 20±2.6 30.5±3.9 50.3±7.4 103±14 262±34 1910±243 Variegated
siltstones
31.6±4.6 30.9±4.1 140±19 230±28 1102±143 5840±578
Green siltstones 1 Green siltstones 2
80±11.1 95.3±11.4
106±14 364±43
857±102 1860±203
2014±215 2708±302
5086±512 3957±415
18800±1504 8328±707
Average 46.6 109 586 1042 2120 7878
U content, %
Red siltstones 0.14 - 1.1 0.35 - 1.6 0.51 - 2.6 3.5 - 5.4 4.2 - 13.7 100 Variegated
siltstones
0.54 0.53 2.4 3.94 18.9 100
Green siltstones 0.43 - 1.14 0.56 - 4.37 4.56 - 22.3 10.7 - 32.5 27.1 - 47.5 100
Average 0.67 1.48 6.47 11.2 22.3 100
234U:238U activity
ratio
Red siltstones 0.97±0.14 - 0.99±0.14
0.96±0.13 - 2.3±0.32
1±0.14 - 1.03±0.14
1.7±0.25 - 2.05±0.29
0.76±0.11 - 1.68±0.22
0.91±0.13 - 1.14±0.16 Variegated
siltstones
1.34±0.19 1.68±0.23 1.58±0.21 1.81± 0.24 1.88±0.24 1.12±0.14
Green siltstones 1.87±0.26 - 2.71±0.36
1.65±0.2 - 1.78±0.24
1.39±0.2 - 1.71±0.24
1.03±0.15 - 2.32±0.33
0.98±0.14 - 1.85±0.25
1.12±0.14 - 1.79±0.24
Average 1.58 1.67 1.34 1.78 1.43 1.22
a DW - Distilled water. b GW – groundwater.
205
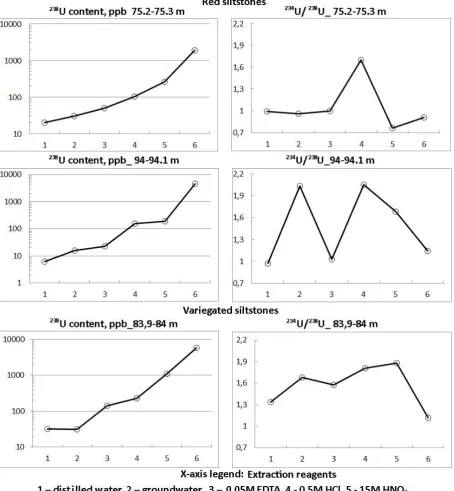
Figure 2. Distribution of 238U content and 234U:238U activity ratio in phases 1-6, leached from crushed
206
red and variegated siltstone of Vendian (Ediacaran) Padun Formations
207
209
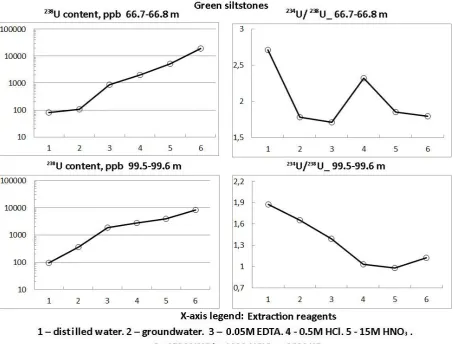
Figure 3. Distribution of 238U content and 234U:238U activity ratio in phases 1-6, leached from crushed
210
green siltstone of Vendian (Ediacaran) Padun Formations
211
Substance dissolution
212
As can be seen from Table 2, water dissolved on average about 1% of the samples of siltstones.
213
At the same time, green siltstones dissolved approximately two-fold more intensively. The following
214
solvents, EDTA and 0.5M HCl, are further dissolved in approximately 1% of each. The ratio of red
215
and green siltstones dissolved in hydrochloric acid remains ~ 1:2. The impact of EDTA on both types
216
of rocks is approximately the same. Nitric acid additionally dissolves an average of 3.36% of the rock.
217
Green siltstone dissolves with nitric acid 2.5-fold more intensively than with hydrochloric acid. The
218
bulk of the rock, from 96.58 to 98.18% red siltstones and from 84.6 to 93.15% green siltstones, is
219
dissolved only with a mixture of 15M HNO3 + 12M HClO4 + 29M HF acids.
220
Uranium concentration
221
In red siltstones, the total uranium content was 1910±243 - 4510±467 μg/kg. The material
222
dissolved in groundwater contained 15.8±2.1 - 30.5±3.9 μg/kg. Three subsequent solvents bring the
223
uranium content in the material dissolved by them to 191±27 - 262±34 μg/kg, which is only 4.2 - 13.7%
224
of the total uranium content in red siltstones. The main supply of uranium is contained in these
225
rocks in the highest degree of barely soluble fraction, extractable by complete digestion.
226
In green siltstones, the total uranium content was 8328±707 - 18800±1504 μg/kg. The material
227
dissolved in groundwater contained 106±14 - 364±43 μg/kg. Three subsequent solvents brought the
228
uranium content in the material dissolved by them to 3957±415 - 5086±512 μg/kg, which is already
229
27.1 - 47.5% of the total uranium content in green siltstones. The most insoluble fraction, respectively,
230
contained 52.5 - 72.9% of uranium.
231
234U:238U activity ratio
232
In red siltstones, the maximum values of 234U:238U activity ratio (1.7±0.25 – 2.3±0.32) were noted
233
in the material dissolved in groundwater and 0.5M HCl. Minimum values (0.76±0.11 – 0.91±0.13) are
characteristic of the most difficultly soluble 15M HNO3 and 15M HNO3 + 12M HClO4 + 29M HF
235
fractions of the studied rocks. In other cases, the values are close to unity.
236
In green siltstones, one increased value of 234U:238U activity ratio (2.32±0.33) was noted in a
237
material dissolved in 0.5M HCl. Three values close to unity were obtained by dissolving 0.5M HCl,
238
15M HNO3 and 15M HNO3 + 12M HClO4 + 29M HF. However, in the remaining eight experiments,
239
using groundwater, 0.05M EDTA, 15M HNO3, and 15M HNO3 + 12M HClO4 + 29M HF as a solvent,
240
the values of 234U:238U activity ratio were high: 1.39±0.2 – 2.71±0.36.
241
5. Discussion
242
Substance dissolution
243
In general, the percentage values of the substance dissolved under the influence of various solvents are
244
approximately consistent with the average chemical composition of siltstones of the Padun Formation of the
245
Vendian in the study area. EDTA, the weakest extractant after fresh groundwater, dissolved up to 3.4% of the
246
substance (Table 2). This corresponds to a loss on ignition (LOI) of 2.74 - 3.36% (Table 1), i.e. the carbonate
247
material of the cement of the studied rocks and other labile fractions. 0.5M HCl additionally dissolved up to 3%
248
of the substance, which is consistent with the content of Fe2O3 (2 - 5.3%) in Table 1, that is, it corresponds to
249
amorphous iron oxides. 15M HNO3 additionally dissolved up to 9% of a substance that can only be represented
250
by the most readily soluble aluminosilicates. A mixture of 15M HNO3 + 12M HClO4 + 29M HF acids dissolves
251
the remainder of the aluminosilicates and a clay/quartz resistate.
252
Uranium concentration
253
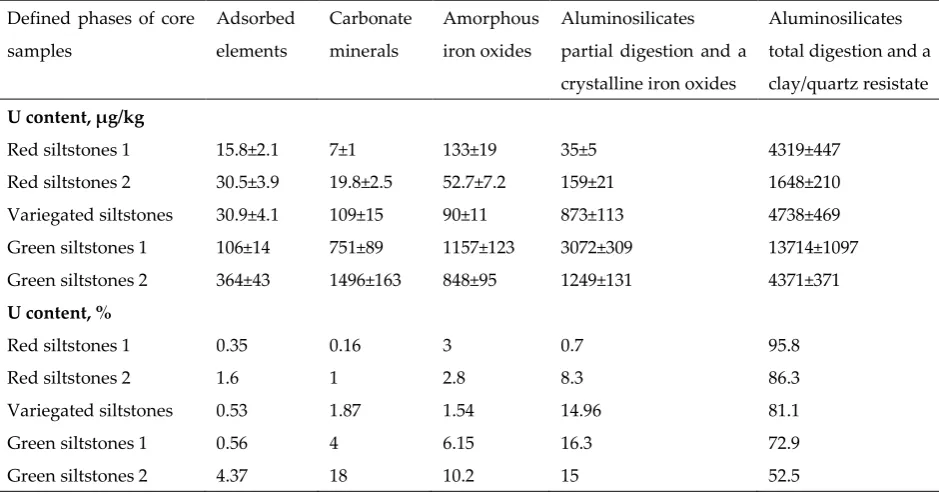
Table 3 shows the uranium concentrations converted to mineral phases in μg/kg and %. In red siltstones,
254
the concentrations of adsorbed uranium were established in the amount of 15.8±2.1 - 30.5±3.9 μg/kg. This
255
amounts to 0.35 - 1.6% of its total amount in rocks of this type. Carbonate minerals contain even less uranium:
256
7±1 – 19.8±2.5 μg/kg. In iron hydroxides and the most readily soluble aluminosilicates, uranium concentrations
257
are in the range 52.7±7.2 - 133±19 and 35±5 - 159±21 μg/kg, respectively. This amounts to a total of 3.7 - 11.1%
258
of its total concentration. The most insoluble fraction contains 1.6±0.2 – 4.3±0.4 mg/kg of uranium. In green
259
siltstones, the concentration of adsorbed uranium is much higher: 106±14 - 364±43 μg/kg (0.56 - 4.37%). The
260
carbonate minerals and amorphous iron oxides contain a total of 1.91±0.21 – 2.34±0.26 mg/kg of uranium
261
(10.15 – 28.2%). In aluminosilicates and a clay/quartz resistate, the concentration of uranium amounts to
262
5.6±0.5 – 16.8±1.4 mg/kg.
263
Table 3. Distribution of uranium in the mineral phases.
264
Defined phases of core
samples Adsorbed elements Carbonate minerals Amorphous iron oxides Aluminosilicates
partial digestion and a
crystalline iron oxides
Aluminosilicates
total digestion and a
clay/quartz resistate
U content, µg/kg
Red siltstones 1
Red siltstones 2
15.8±2.1 30.5±3.9 7±1 19.8±2.5 133±19 52.7±7.2 35±5 159±21 4319±447 1648±210
Variegated siltstones 30.9±4.1 109±15 90±11 873±113 4738±469
Green siltstones 1
Green siltstones 2
106±14 364±43 751±89 1496±163 1157±123 848±95 3072±309 1249±131 13714±1097 4371±371
U content, %
Red siltstones 1
Red siltstones 2
0.35 1.6 0.16 1 3 2.8 0.7 8.3 95.8 86.3
Variegated siltstones 0.53 1.87 1.54 14.96 81.1
Green siltstones 1
Green siltstones 2
0.56 4.37 4 18 6.15 10.2 16.3 15 72.9 52.5
265
Increased values of 234U:238U activity ratio were noted in the material of red siltstones dissolved
267
in water and 0.5M HCl. That is, uranium isotopes with elevated values of 234U:238U activity ratio
268
(greater than 1) were deposited from groundwater on sorbent material and with iron hydroxides.
269
Reduced values of 234U:238U activity ratio (less than 1) are characteristic of the most difficultly soluble
270
fractions. In them, the dissolution of uranium by groundwater was practically absent and only
271
depletion of 234U atoms occurred due to recoil loss factor. In green siltstones, there is also a tendency
272
towards a decrease in 234U:238U activity ratio in the direction from easily soluble fractions to sparingly
273
soluble fractions (Fig. 3, interval 99.5–99.6 m). However, for a sample taken from the interval 66.7 -
274
66.8 m, high values of 234U:238U activity ratio are observed in all mineral phases. Additional studies
275
are needed to explain this fact.
276
Evolution of uranium isotopic compositions
277
The results obtained partially confirm previously expressed ideas about the evolution of U
278
isotopic compositions of the Vendian rock near the study area [20]. It has been established that the
279
processes of chemical weathering of Vendian deposits led to the formation of a strong oxidation
280
zone, developed above 250 m.b.s.l. The inverse correlation between the concentrations of U and Fe
281
(see Tables 1 and 2) in the red siltstones (increased Fe concentrations and reduced U contents) is a
282
result of removal of U in oxidizing conditions, and accumulation of Fe. In red siltstones, the
283
concentration of Fe2O3 is 5.3%, and the content of U is 1.9-4.5 mg/kg, in green siltstones the
284
concentration of Fe2O3 is 2%, and the content of U is 5.8-18.8 mg/kg. Almost all U in the red siltstones
285
has been replaced by a newly formed “hydrogenic” U (precipitated from groundwater), with an
286
initial 234U:238U activity ratio ≈ activity ratio of modern fresh groundwater = 3. The ending of the
287
period of co-precipitation of hydrogenic uranium with iron hydroxide was estimated as 0.9 Ma,
288
which should roughly correspond to the period of a sharp cold snap in the region. After, dissolution
289
and desorption of hydrogenic U occurred during periods with no glaciations and marine
290
transgressions.
291
Our results are consistent with the experimental results of Lowson et al. [16], Payne et al. [17],
292
and Dabous et al. [18], which note the similarity of the 234U:238U activity ratios in groundwater and in
293
the most easily leached fractions of water-bearing rocks.
294
At the same time, the lower average value of 234U:238U activity ratio 0.92 [20] was established in
295
the samples of green siltstones taken in the paleovalley, which was screened by the layer of sea clays.
296
It is explainable by the fact that these deposits have reached a steady state of the 234U:238U activity
297
ratio that depends only on their size (the average grain size ≈ 30 μm), because they were under
298
reducing conditions over 1 Ma. A significantly higher content of uranium in them compared to red
299
siltstones shows a considerable variability in the permeability values of the aquifer, whereby they
300
were away from the paths of groundwater filtration and have retained uranium. The green siltstones
301
studied in this work occur in the oxidative conditions of the aquifer which contains young fresh
302
water [28]. They have high concentrations of uranium in readily soluble fractions and high 234U:238U
303
activity ratios. This can be explained by their deep processing by groundwater in a relatively recent
304
period (tens - the first hundreds of thousands of years). During this processing, they were in a loose
305
state, as a result of which U was evenly precipitated from water on the surface of disintegrated rock
306
particles in the entire volume of the current green siltstones. Then there was cementation of rocks
307
with Fe hydroxides, carbonates and clay material. After this, the rocks were again compacted under
308
glacial loading. As the second option, it can be assumed that the green siltstones replace lenticular
309
accumulations of organic matter with a high content of U adsorbed from groundwater. The place
310
where 5 samples were taken for this study was the sea shelf of the Mikulinian (Eemian) Sea 115-130
311
ka ago. Marine sediments up to 50-70 m thick contained a large amount (up to 10%) of organic
312
residues of iodine-containing algae. Organic matter could enter sediments of the upper part of the
313
Vendian Formation during the diagenesis of marine precipitation [42].
314
Retardation factor
315
Retardation factor is determined by the formula [43, 6]:
316
8 8
1
s A/
WR
= +
M C
C
(2)317
where
M
s=
m(1
−
n
) /
watern
;A
C
8 - solute concentration of 238U in the stationary solid,318
µ g/kg [44];
C
8W- measured concentration of 238U in solution at the point of sampling, µ g/kg;
m -319
mineral density, g/cm3; w
- pore fluid density,̴1 g/cm3;n
- porosity.For the study area, the following values of the parameters included in Eq. (2) were previously
321
obtained:
C
8W= 5 µ g/kg (from 23 definitions of uranium concentrations in fresh water in a Vendian322
aquifer [28]; n = 0.23 (from 52 determinations) and ρm = 2.75 g/cm3 (from 52 determinations);
M
s=323
9.2065 [27].
324
A
C
8 can be taken as the average value of U content in adsorbed elements of the red siltstones =325
23 µ g/kg (Table 3), because green siltstones occupy an insignificant volume in the deposits of the
326
Padun formation of the Vendian compared to red siltstones. However, this value characterizes the
327
entire volume of rock that was crushed before the experiments. Under natural conditions, the
328
movement of water in siltstones and sandstones occurs along pores and cracks, characterized by the
329
value of open porosity. From this open volume, uranium adsorption occurs, which determines the
330
value of the retardation factor. Therefore, as a first approximation, we can take:
331
n
C
C
M
R
=
1
+
s
8A/
8W
(3)332
Calculations by the formula (3) give the value of the retardation factor 10.73.
333
In Malov [27], the average value of the ratio R:p = 24 was determined for a Vendian aquifer,
334
where p is the recoil loss factor. That is, at R = 10.73, the value of p will be 0.45.
335
The obtained values (10.73 and 0.45) apparently characterize the upper limits of R and p,
336
repectively.
337
6. Conclusions
338
The partial extraction procedure was used to reconstruct the redistribution processes of
339
uranium isotopes in certain mineral phases of the aquifer of sandy-clay deposits of the Vendian.
340
Red siltstones are depleted in uranium in relatively readily soluble mineral phases. The
341
concentration of adsorbed uranium was established as 15.8±2.1 - 30.5±3.9 μg/kg. This accounts for
342
0.35 - 1.6% of its total amount in rocks of this type. Carbonate minerals contain even less uranium:
343
7±1 –19.8±2.5 μg/kg, i.e. 0.16 - 1%. In iron hydroxides and the most readily soluble aluminosilicates,
344
uranium concentrations are in the range 168±24 –212±28 μg/kg. The most insoluble fraction contains
345
1.65±0.21 – 4.32±0.45 mg/kg of uranium. In green siltstones, the concentration of adsorbed uranium
346
is much higher: 106±14 - 364±43 μg/kg (0.56 - 4.37%). Carbonate minerals and amorphous iron oxides
347
contain 1.91±0.21 – 2.34±0.26 mg/kg of uranium. In aluminosilicates and a clay/quartz resistate,
348
uranium concentrations are 5.6±0.5 – 16.8±1.4 mg/kg. Such a distribution of uranium in various types
349
of rocks is consistent with the earlier assumption about the removal of uranium from red siltstones
350
in the last 0.9 Ma and its conservation in green siltstones.
351
Elevated values of 234U:238U activity ratio prevail in the adsorbed material and iron hydroxides.
352
In aluminosilicates and clay/quartz resistate, the values decrease. This indicates the replacement of
353
primary sedimentogenic uranium by secondary hydrogenic uranium adsorbed on the surface of
354
minerals and coprecipitated with iron hydroxides.
355
The results obtained made it possible to carry out preliminary quantitative estimates of the
356
retardation factor and recoil loss factor of uranium in the groundwater of siltstones of the Vendian
357
aquifer.
358
At the same time, some uncertainty in the interpretation of the high U contents and high
359
234U:238U activity ratios in green siltstones obtained in this work should be noted. This requires
360
additional research on a more representative number of samples. Also, the relationship between the
361
extraction solutions and the mineral phases has not yet been precisely established. The mineral
362
phases that were dissolved during the sequential extraction procedure should be examined using
363
X-ray powder diffraction (XRD) analysis and scanning electron microscopy (SEM).
364
Acknowledgments: This work was supported by the Russian Ministry of Education and Science
365
(project no. № AAAA-A19-119011890018-3), the UB RAS (project no. АААА-А18-118012390242-5),
366
the Russian Foundation for Basic Research (projects no. 20-05-00045_A, 18-05-60151_Arctic; no.
367
18-05-01041_A). The authors are grateful to T.N. Markova for the description of the samples of the
368
studied rocks was performed on five thin sections of core samples.
Conflicts of Interest: The authors declare no conflict of interest. The founding sponsors had no role
370
in the design of the study; in the collection, analyses, or interpretation of data; in the writing of the
371
manuscript, and in the decision to publish the results.
372
Author Contributions: Conceptualization, formal analysis, writing—original draft preparation,
373
Alexander I. Malov; methodology and investigation, Sergey B. Zykov.
374
Appendix A
375
Description of the thin sections of core samples
376
Thin sections of core samples (n=5) were prepared in epoxy resin. Thin sections were
377
examined under transmitted, polarized, and reflected light using optical microscopy to determine
378
the minerals and the textural features of the rocks.
379
1. Green siltstones 66.7-66.8 m
380
The sandy siltstone has a light greenish-gray color. The texture of the rock is heterogeneous,
381
due to the chaotic arrangement of clastic grains and the presence of spots up to 0.4 mm in size with
382
an iron-carbonate aggregate. Clastic material is 70-80% and is represented by grains of quartz,
383
feldspar and quartzite rocks; the composition is dominated by quartz grains. Among feldspars
384
where plagioclases and potassium feldspars are diagnosed, plagioclases prevail. The grain size
385
varies from 0.02 to 0.15 mm; grains up to 0.2 mm in size are rarely found. The surface of the grains is
386
corrosive. Single grains of accessory minerals are noted - tourmaline, ilmenite, epidote, zircon. On
387
separate grains of quartz and feldspar, a regenerative rim is fixed. Some fragments of quartz and
388
feldspar are sericitized. In the rock, single plates of colorless and colored mica up to 0.15-0.25 mm in
389
size are diagnosed; this mica is diagenetic. Film-pore clay-ferruginous cement predominates, and
390
cementation due to regeneration is also fixed. Marks, lenses (not exceeding 0.4-0.5 mm in size) with
391
limonite-goethite and ferruginous-carbonate cement are noted. Carbonate is represented by calcite
392
and it is formed later than limonite-goethite aggregate. Individual detrital grains are partially
393
replaced by a ferruginous carbonate aggregate. Limonite-goethite and carbonate aggregates in
394
cement are epigenetic. Most likely, compaction of sedimentary material, hydromica of cement in
395
siltstone, and a high content of deformed plates are associated with dynamic changes. That is, the
396
structural adjustment of cement is due to the influence of tectonic processes and hydrothermal
397
solutions in the process of formation of kimberlite fields.
398
2. Red sandstones 75.2-75.3 m
399
Sandstone oligomictic fine-grained silty has brown color with light streaks. Rounded spots
400
1.0–2.0 mm in size with carbonate cement are fixed in the rock; their location is subparallel. The
401
slanting texture due to particle size distribution is not clearly expressed. In some areas, a random
402
distribution of clastic material is noted. Clastic material is represented by grains of quartz, feldspar
403
and quartzite rocks; the composition is dominated by quartz grains. The size of clastic grains varies
404
from 0.03-0.04 mm to 0.2-0.25 mm. Grain rounding is mostly good and medium. The grain surface is
405
corrosive; regenerative rim is fixed on separate fragments of quartz and feldspar. Separate
406
fragments of quartz and feldspar are sericitized. There are single plates of green mica up to 0.12-0.15
407
mm in size, which fill individual pores and sometimes partially replace detrital grains. Most likely
408
this mica is epigenetic. Film-pore clay-ferruginous cement predominates, and cementation due to
409
regeneration is also fixed. Spots with limonite-goethite and ferruginous-carbonate cement are noted.
410
Carbonate is represented by calcite and is formed later than limonite-goethite aggregate. Individual
411
detrital grains are partially replaced by a ferruginous carbonate aggregate. Limonite-goethite and
412
carbonate aggregates in cement are epigenetic.
413
3. Variegated siltstones 83.9-84 m
414
Siltstone with indistinctly expressed oblique and banded textures. Striping does not coincide
415
with layering; alternation of brown and gray, greenish-gray rocks does not form layers.
416
Cross-bedding is due to the presence of argillite microlenses. The composition of this rock does not
417
differ from the sandstones and siltstones that are described in the above.
418
4. Red siltstones 94-94.1 m
419
Oligomictic siltstone of brown color with indistinctly expressed cross-layered texture. The
420
oblique texture is due to a poorly defined granulometric sorting of clastic material and the presence
of argillite microlenses. Breccia is due to the presence of areas with a random distribution of clastic
422
material, which is associated with sedimentation processes. The presence of sites with
423
limonite-goethite cement is due to epigenetic processes. Clastic material, as in previous thin sections,
424
is represented by grains of quartz, feldspar and quartzite rocks, quartz grains dominate in the
425
composition. The size of clastic grains varies from 0.03-0.04 mm to 0.15-0.2 mm. Grain rounding is
426
mostly average and good. The grain surface is corrosive; a regenerative rim is fixed on separate
427
fragments of quartz and feldspar. Some fragments of quartz and feldspar are sericitized. Rare plates
428
of colorless mica, which are diagenetic, are fixed in this strain. By the nature of the filling, the
429
cement is not continuous, the number of hollow pores is insignificant. Film-pore clay-ferruginous
430
cement predominates, and cementation due to regeneration is also fixed. Spots with
431
limonite-goethite and ferruginous-carbonate cement are noted. Carbonate is represented by calcite
432
and it is later than limonite-goethite aggregate. Limonite-goethite and carbonate aggregates in
433
cement are epigenetic.
434
5. Green siltstones 99.5-99.6 m
435
Oligomictic siltstone sandy with indistinctly expressed oblique and banded textures. The
436
color of the strain is light greenish gray. In terms of composition and structural-textural features,
437
siltstone does not differ from the rocks that are described in the above.
438
References
439
1. Chkir, N., Guendouz, A., Zouari, K., Hadj Ammar, F., Moulla, A.S.. Uranium isotopes in groundwater
440
from the continental intercalaire aquifer in Algerian Tunisian Sahara (northern Africa). J. Environ. Radioact.
441
2009, 100, 649–656.
442
2. Dhaoui, Z., Chkir, N., Zouari, K., Ammar, F.H., Agoune, A. Investigation of uranium geochemistry along
443
groundwater flow path in the Continental Intercalaire aquifer (Southern Tunisia). J. Environ. Radioact.
444
2016, 157, 67–76.
445
3. Priestley, S.C., Payne, T.E., Harrison, J.J., Post, V.E.A., Shand, P., Love, A.J., Wohling, D.L. Use of
446
U-isotopes in exploring groundwater flow and inter-aquifer leakage in the south-western margin of the
447
Great Artesian Basin and Arckaringa Basin, central Australia. Appl.Geochem. 2018, 98, 331–344.
448
4. Suksi, J., Rasilainen, K., Marcos, N. U isotopic fractionation - a process characterising groundwater
449
systems. In: Merkel, B.J., Hasche-Berger, A. (eds), Uranium in the Environment. Springer-Verlag: Berlin,
450
Heidelberg, 2006; pp. 683-690.
451
5. Chabaux, F., Bourdon, B., Riotte, J. U-series geochemistry in weathering profiles, riverwaters and lakes. In:
452
Krishnaswami, S., Cochran, J.K. (eds), U/Th series radionuclides in aquatic systems, vol 13, Radioactivity in
453
the environment. Elsevier: New York, 2008; pp. 49–104.
454
6. Porcelli, D. Investigating groundwater processes using U- and Th-series nuclides. Radioact. Environ. 2008,
455
13, 105–153.
456
7. Maher, K., DePaolo, D.J., Lin, J.C.F. Rates of silicate dissolution in deep-sea sediment: in situ measurement
457
using U-234/U-238 of pore fluids. Geochim. Cosmochim. Acta 2004, 68, 4629-4648.
458
8. Ivanovich, M., Fröhlich, K., Hendry, M.J. Uranium-series radio nuclides in fluids and solids, Milk River
459
aquifer, Alberta, Canada. Appl. Geochem. 1991, 6, 405–418.
460
9. Chabaux, F., Dequincey, O., Leveque, J.J., Leprun, J.C., Clauer, N., Riotte, J., Paquet, H. Tracing and
461
dating recent chemical transfers in weathering profiles by trace-element geochemistry and
462
U-238-U-234-Th-230 disequilibria: the example of the Kaya lateritic toposequence (Burkina-Faso). CR
463
Geosci 2003, 335, 1219–1231.
464
10. Dosseto, A., Bourdon, B., Turner, S. Uranium-series isotopes in river materials: Insights into the
465
timescales of erosion and sediment transport. Earth Planet Sci Lett 2008, 265, 1–17.
11. Vigier, N., Bourdon, B. Chapter 27. Constraining Rates of Chemical and Physical Erosion Using U-Series
467
Radionuclides. In: M. Baskaran (ed.), Handbook of Environmental Isotope Geochemistry, Advances in Isotope
468
Geochemistry. Springer-Verlag: Berlin, Heidelberg, 2011, pp. 553-571.
469
12. Duff, M.C., Coughlin, J.U., Hunter, D.B. Uranium co-precipitation with iron oxide minerals. Geochim
470
Cosmochim Acta 2002, 66, 3533–3547.
471
13. Giammar, D.E., Hering, J.G. Timescale for sorption-desorption and surface precipitation of uranyl on
472
goethite. Environ Sci Technol 2001, 35, 3332–3337.
473
14. Singer, D.M., Maher, K., Brown, G.E. Jr. Uranyl-chlorite sorption/desorption: evaluation of different U(VI)
474
sequestration processes. Geochim Cosmochim Acta 2009, 73, 5989–6007.
475
15. Tricca, A., Wasserburg, G. J., Porcelli, D., Baskaran, M. The transport of U- and Th-series nuclides in a
476
sandy unconfined aquifer. Geochim. Cosmochim. Acta 2001, 65, 1187–1210.
477
16. Lowson, R.T., Short, S.A., Davey, B.G., Gray, D.J. 234U/238U and 230Th/234U activity ratios in mineral phases
478
of a lateritic weathered zone. Geochim. Cosmochim. Acta 1986, 50, 1697–1702.
479
17. Payne, T.E., Edis, R., Fenton, B.R., Waite, T.D. Comparison of laboratory uranium sorption data with 'in
480
situ distribution coefficients' at the Koongarra uranium deposit, Northern Australia. J. Environ. Radioact.
481
2001, 57, 35–55.
482
18. Dabous, A.A., Osmond, J.K., Dawood, Y.H. Uranium/thorium isotope evidence for groundwater history
483
in the Eastern Desert of Egypt. J. Arid Environ. 2002, 50, 343–357.
484
19. Yanase, N., Nightingale, T., Payne, T., Duerden, P. Uranium distribution in mineral phases of rock by
485
sequential extraction procedure. Radiochim. Acta 1991, 52-53, 387-393.
486
20. Malov, A.I. Evolution of the uranium isotopic compositions of the groundwater and rock in the
487
sandy-clayey aquifer. Water (Switzerland) 2017, 9 (12), 910.
488
21. DePaolo, D.J., Maher, K., Christensen, J.N., McManus, J.,. Sediment transport time measured with
489
U-series isotopes: Results from ODP North Atlantic drift site 984. Earth Planet Sci Lett 2006, 248, 394–410.
490
22. Maher, K., DePaolo, D.J., Christensen, J.N. U-Sr isotopic speedometer: fluid flow and chemical weathering
491
rates in aquifers. Geochim Cosmochim Acta 2006, 70, 4417–4435.
492
23. Tessier, A., Campbell, P.G.C., Bisson, M. Sequential extraction procedure for the speciation of particulate
493
trace metals. Anal. Chem. 1979, 51, 848–851.
494
24. Hall, G.E.M., Vaive, J.E., Beer, R., Hoashi, M. Selective leaches revisited, with emphasis on the
495
amorphous Fe oxyhydroxide phase extraction. J. Geochem. Explor. 1996, 56, 59–78.
496
25. Quevauviller Ph., Rauret, G., López-Sánchez, J.-F., Rubio, R., Ure, A., Muntau, H. Certification of trace
497
metal extractable contents in a sediment reference material (CRM601) following a three-step sequential
498
extraction procedure. Sci. Total Environ. 1997, 205, 223–234.
499
26. Sutherland, R.A., Tack, F.M.G., Tolosa, C.A., Verloo, M.G. Metal Extraction from Road Sediment using
500
Different Strength Reagents: Impact on Anthropogenic Contaminant Signals. Environ Monit Assess2001,
501
71-3, 221-242. https://doi.org/10.1023/A:1011810319015
502
27. Malov, A.I. Estimation of uranium migration parameters in sandstone aquifers. J. Environ. Radioact. 2016,
503
153, 61-67.
504
28. Malov, A.I. Evolution of the groundwater chemistry in the coastal aquifers of the south-eastern White Sea
505
area (NW Russia) using 14C and 234U-238U dating. Sci. Total Environ. 2018, 616–617, 1208-1223.
506
29. Andreas, J.N., and Kay, R.L.F. The evolution of enhanced 234U/238U activity ratios for dissolved uranium
507
and groundwater dating. 4th Int. Conf. on Geochronology, Cosmochronology and Isotope Geology,
508
Denver, Colo., 1978. U.S. Geol. Surv., Open-File Rep. 1978, 78-701, 11-13.
30. Fröhlich, K., and Gellermann, R. On the potential use of uranium isotopes for groundwater dating. Chem.
510
Geol. 1987, 65, 67-77.
511
31. Andreas, J.N., and Kay, R.L.F. The U contentand234U/238U activity ratios of dissolved uranium in
512
groundwaters from Triassic sandstones in England. Isotope Geoscience 1983, 1, 101- 117.
513
32. Stankovsky, A.F., Verichev, E.M., Grib, V.P., et al. The Vendian in the Southeastern White Sea Region. Izv.
514
Akad. Nauk SSSR, Ser. Geol. 1981, 2, 78–87.
515
33. Stankovsky, A.F., Verichev, E.M., Dobeiko, I.P. The Vendian in Southeastern White Sea Region. In: The
516
Vendian: Historical-Geological and Paleontological Evidence, vol. 2: Stratigraphy and Geological Processes.
517
Nauka: Moscow, 1985, 67–76 (in Russian).
518
34. Malov, A.I.Water-Rock Interaction in Vendian Sandy-Clayey Rocks of the Mezen Syneclise. Lithol. Miner.
519
Resour. 2004, 39-4, 345–356.
520
35. Grazhdankin, D.V., Podkovyrov, V.N., Maslov, A.V. Paleoclimatic Environments of the Formation of
521
Upper Vendian Rocks on the Belomorian-Kuloi Plateau, Southeastern White Sea Region. Lithol Miner
522
Resour 2005, 40, 232. https://doi.org/10.1007/s10987-005-0024-x
523
36. Bonotto, D.M., Andrews, J.N. The mechanism of 234U/238U activity ratio enhancement in karstic limestone
524
groundwater. Chem. Geol. (Isot. Geosci. Sec.) 1993, 103, 193-206.
525
37. Bonotto, D.M., Andrews, J.N. The transfer of uranium isotopes 234U and 238U to the waters interacting
526
with carbonates from Mendip Hills area (England). Appl. Radiat. Isotopes 2000, 52, 965-983.
527
38. Singh, S. P., Tack, F. M. G., Verloo, M. G. Solid-phase distribution of heavy metals as affected by single
528
reagent extraction in dredged sediment derived surface soils. Chem. Spec. Bioavail.1996, 8, 37–43.
529
39.
Malyshev, V.I., Bakhur, A.E., Manuylova, L.I. et a. Methods for measuring the volumetric activity of uranium530
isotopes (234, 238) in natural water sample alpha spectrometry with radiochemical separation. VIMS: Moscow,
531
1999a (in Russian).
532
40. Fröhlich, K. Dating of old groundwater using uranium isotopes – principles and applications. In: Isotope
533
methods for dating old groundwater. IAEA: Vienna, 2013, 153-178.
534
41.
Malyshev, V.I., Bakhur, A.E., Manuylova, L.I. et al. Methods for measuring the specific activity of535
uranium isotopes (234, 238) in soils, sediments, rocks and building materials alpha spectrometry with
536
radiochemical separation. VIMS: Moscow, 1999b (in Russian).
537
42. Malov, A.I.Application of Geological Benchmarks for Determining Groundwater Residence Time in the
538
Aquifer Based on Uranium Isotope Data: Evidence from the Severnaya Dvina Basin. Lithol. Miner. Resour.
539
2013, 48-3, 254–265.
540
43. Krishnaswami, S., Graustein, W. C., Turekian, K. K., and Dowd, J. F. Radium, thorium and radioactive
541
lead isotopes in groundwaters: Application to the in situ determination of adsorption-desorption rate
542
constants and retardation factors. Water Resources Res. 1982, 18, 1663-1675.
543
44. Pearson, F.J., Norowha, C.J., Andrews, R.W. Mathematical modelling of the distribution of natural 14C,
544
234U, and 238U in a regional groundwater system, Radiocarbon 1983, 25, 291–300.
![Table 1. The average chemical composition of the red siltstones of the Padun Formation of the Vendian in research area (from 18 determinations) [34] and green siltstones of the sample GGS2-11 (depth 99.5 m), %](https://thumb-us.123doks.com/thumbv2/123dok_us/1083218.1609042/4.595.111.483.125.431/chemical-composition-siltstones-formation-vendian-research-determinations-siltstones.webp)