Modification of Graphene Oxide and Preparation of RuO2 Nanocomposites
Kyeong-Won Parka
aDepartment of Chemistry and Faculty of General Education, Gyeongsang National University,
Jinju 52828, Republic of Korea. E-mail: [email protected]; Tel: 55-755-7880; Fax:
+82-55-755-7881
Abstract
Graphene-oxide (G) was prepared by the Hummers’ method. A G-COOH layer was
synthesised using chloroacetic acid and G. To fabricate carboxylated graphene-RuO2
(G-COORu) nano-composites, RuO2 nano-particles were grown on graphene layers using a
one-step thermal method, -COOH(G-COOH), and RuCl3. All materials were characterised using
X-ray diffraction, transmission electron microscopy, scanning electron microscopy, 13
C-nuclear magnetic resonance as well as X-ray photoelectron, Fourier-transform infrared
spectroscopy, and Raman. The electrochemical characteristics of the G-COORu
supercapacitors were analysed using electrochemical impedance spectroscopy, cyclic
voltammetry, constant current charge–discharge tests, and Nyquist impedance plots. The
supercapacitors exhibit a specific capacitance of ~125 F g-1 at 100 mA cm-2 within the potential
range of 0–1.0 V. The method used here provides a simple approach for the deposition of RuO2
nano-particles on graphene layers and can be widened to the fabrication of other classes of
hybrids based on G layers for specific technical applications.
Keywords: graphene oxide; nano-composite; ruthenium oxide; supercapacitor; XRD; XPS
1. Introduction
After graphene was developed from graphite, active research focusing on various scientific
and technical applications of graphene, including energy storage materials [1-3],
nano-electronics, and optoelectronic devices, has been conducted [4-7]. Graphene layers,
which are composed of carbon and have a two-dimensional structure [8,9], are used in
electrochemical energy storage applications because of their excellent chemical stability [9],
large surface area [10,11], and high electrical conductivity [11,12]. Graphene layers overlap
each other to create a network, which accelerates the transfer of electrons between the active
material and charge amasser. Therefore, they are excellent candidates for electrode materials
in energy storage systems. Redox-active materials are increasingly grown on such conductive
graphene layers. Consequently, the capacity increase of energy storage materials has become
a major research topic in electrochemistry.
Almost graphene-based nano-composites are arranged by the reduction of graphene oxide (G)
and subsequent loading of quasi-capacitive nano-materials. However, the good electrical and
surface properties of graphene layers cannot be fully utilised due to the formation of graphene
aggregates during the reaction. Therefore, a strategy is required to synthesise nano-composites
with good electrochemical properties on the surface of graphene. Accordingly, research on
the large-scale fabrication of individual graphene layers has recently attracted great interest
[13-15]. In addition, G layers have great potential for future applications due to their very
large specific surface areas, oxygen-bearing functional groups (including epoxides, carboxyl
groups, hydroxyl, and carbonyl), and high hydrophilicity [13-14].
In a previous study, G layers modified with polyethylene glycol were used as aqueous carriers
for water-insoluble drug delivery [16]. The oxygen-bearing functional groups of the G layers
were used as sites for the deposition of porphyrins, organic macro-molecules, and metal
optoelectronic materials with various functionalities has been developed [17-19]. Unique
nano-spheres that form on G layers can be applied in many technical fields such as
nano-electronics [20], batteries [21], nano-composites [22], sensors [23], and
micro-supercapacitors [24].
Several reports have been published on the growth and exfoliation properties of graphene [8].
Metal oxides, such as NiO, MnO, IrO2, MnO2, and RuO2, are known to contribute to the
pseudocapacitance and thus can develop the capacitance of carbon-based supercapacitors
[25-28]. Ruthenium oxide can be applied as a molecular sieve [29], catalyst [30], battery electrode
material [31], and supercapacitor [32-37].
The interest in RuO2 as a pseudocapacitor electrode material is increasing because of its high
theoretical capacitance, environmental friendliness, and wide potential window.
To obtain a larger capacitance from a given amount of RuO2, the pseudocapacitor must be
prepared as a small-sized, hydrated amorphous and porous structure. In addition to a large
surface area, it should provide conduction paths that enable protons to access the inner parts
of RuO2. Therefore, scientists have used carbon-based materials, such as carbon nano-tubes
(CNT) or G, to improve the performance of RuO2. In most studies, nano-composites are
combinations of RuO2 and carbon materials [38-40]. In addition, carboxylic acid (-COOH)
groups derivatised with Ru, that is, -COORu, have also been reported [41-43].
We previously treated a G sample with Cl-CH2-COOH(chloroacetic acid) under strong basic
conditions to activate epoxide and ester groups and convert hydroxyl groups to -COOH
moieties [44,45]. It was anticipated that the carboxylate groups produced under strongly basic
conditions would function as binding sites for Ru ions.
In this study, we report a easy one-step solvent thermal method for the synthesis of G-COORu
nanocomposites. In this method, G-COOH and RuCl3 are used as precursors for the formation
2. Experimental Methods
2.1 Preparation of G
The G samples were prepared according to the modified Hummers’ method [46,47] by
reacting commercial graphite powder (Aldrich; 5.5 g) and NaNO3 (4.0 g) with concentrated
H2SO4 (380 mL). The mixture was stirred in an ice bath, and KMnO4 (23.0 g) was slowly
added over a duration of 60 min. The stirring in an ice bath was continued for 120 min.
Subsequently, the mixture was vigorously stirred for 48 hrs at room temperature and then
700.0 mL of an aqueous H2SO4 solution (5 wt.%) was added over a duration of 60 min under
stirring, while the temperature was maintained at 97 °C. The resultant mixture was further
stirred for 120 min at 97 °C. After the temperature was reduced to 62 °C, 16 mL H2O2 (30.0
wt.% aqueous solution) was injected, and the mixture was stirred for 120 min at room
temperature. To remove extraneous oxidation products, the resultant mixture was purified by
repeating the following procedure 18 times: centrifugation, removal of supernatant liquid,
dispersion of solids using vigorous stirring, and ultrasonication for 60 min at 150.0 W. The
resultant solids were recovered by centrifugation, washed with ethanol and deionised water
until H+ was completely removed, and then dried in air at 45 °C.
2.2 Carboxylation of G
For the carboxylation, an aqueous suspension (6.0 mL) of G was diluted by a factor of 2.0 to
a concentration of ~2.0 mg/mL and then ultrasonicated for 60 min to obtain a clear solution.
Subsequently, NaOH (1.20 g) and Cl-CH2-COOH (chloroacetic acid; 1.00 g) were injected to
the G solution and the mixture was ultrasonicated for 120 min [44,45]to convert the -OH
groups into -COOH via the conjugation of acetic acid moieties, thereby producing G-COOH.
The resulting G-COOH solution was neutralised and subsequently purified by repeated
2.3 Preparation of the G-COORu nano-composite
The G-COORu nano-composite was synthesised using a hydrothermal process. The G-COOH
(0.50 g) and RuCl3xH2O (1.00 g) were dispersed in deionised water (20.0 mL) and
ultrasonicated for 25 min. Subsequently, the mixture was transferred to a teflon-lined
autoclave and heated to 182 °C for 600 min. After cooling to room temperature, the resulting
grey-black suspension was filtered through a 0.22 m microporous membrane to separate the
G-COORu nanocomposite.
2.4 Characterisation of G, G-COOH, and the G-COORu nanocomposite
Powder X-ray diffraction (XRD) patterns of the samples were recorded on a Bruker
D8-Advance diffractometer using Cu Kα radiation (λ = 0.15420 nm), scattering angles (2θ) of 4°–
82°, 41 keV, and a cathode current of 20.0 mA. Scanning electron microscopy (SEM) images
were obtained using a JEOL JSM-840A SEM equipped with an energy-dispersive
spectrometer (EDS). Transmission electron microscopy (TEM) images were obtained using a
JEOL JEM-200 CX TEM operated at 200 kV. Raman spectra of the samples were measured
at the sample surface using a confocal Raman microscope system equipped with a 514.5 nm
Ar laser module (Jobin Yvon-Horiba LabRAM, Olympus BX 41 microscope). The samples
were ultrasonicated in EtOH, and they were applied to a glass slide in the form of drops for
the analyses. The samples were analysed using a green laser with a 51× maximum
magnification and a red laser with a 101× magnification.
Solid-state 13C-cross-polarisation magic angle spinning nuclear magnetic resonance
spectroscopy (13C-NMR) experiments were performed on a 400 MHz solid-state Bruker
Avance II+ spectrometer. Fourier-transform infrared (FTIR) spectra were recorded using the
attenuated total reflectance (ATR) equipment of a Nicolet iS50 FTIR spectrometer. The
radiation (hv = 1486.6 eV). The pressure in the analyser was maintained at ~6.70 × 10⁻⁷ Pa.
The XPS data were processed using a DS-300 data system.
2.5 Preparation of working electrodes
The electrodes were prepared by mixing 80 wt% of G-COORu nano-composites, 10 wt% of
acetylene black, and 10 wt% of polytetrafluoroethylene (PTFE) slurry in a
tetrahydrofuran(THF) solvent. The mixtures were pressed onto a Ni foam grid and dried at
above 75 °C overnight. The prepared working electrode contained ~16.0 mg of the
electroactive material and had a geometric surface area of ~1.0 cm2.
2.6 Electrochemical study
A typical three-electrode experimental cell, including working electrode, Pt wire counter
electrode, and Ag/AgCl reference electrode, was used to measure the electrochemical
properties of the working electrode. All electrochemical measurements were conducted in a
1.0 M Na2SO4 electrolyte. Galvanostatic charge–discharge, cyclic voltammetry (CV), and
electrochemical impedance spectroscopy (EIS) measurements were conducted on a VERSA
STAT 3 instrument (Princeton Applied Research, USA). Impedance spectroscopy
measurements were performed at a direct current (DC) bias of 50.0 mV with a sinusoidal
signal of 0.10 mV over the frequency range of 10.0 kHz to 0.10 Hz.
3. Results and Discussion
Graphene oxide was prepared from powder graphite via the modified Hummers’ method
[46,47]. The G-COOH was obtained by the reaction of GO with chloroacetic acid. In addition,
a G-COORu nanocomposite was prepared from G-COOH and RuCl3. The surface
morphology and structure of the samples were analysed using TEM and SEM, as described in
Section 2.
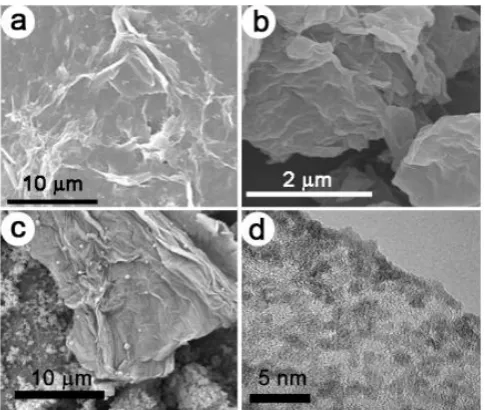
Figure 1 shows the TEM and SEM results for G-COOH, G, and G-COORu. The general
thin plates were well exfoliated. The G was exfoliated as single layers such that jeep-shaped
G can be observed (Fig. 1a). The single-layer character of G-COOH causes its wrinkled
appearance (Fig. 1b). The RuO2 nanoparticles (~2.0 nm) can be observed on the surface of
G-COOH (Figs 1c and 1d).
Fig. 1. SEM images of (a) G, (b) COOH, and (c) COORu and (d) TEM image of G-COORu.
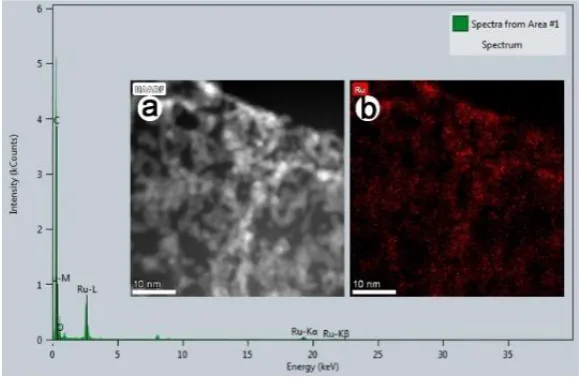
The chemical composition of the G-COORu sample was analysed using an EDS mounted on
a SEM (Fig. 2a). The EDS spectrum shows that the G-COORu sample only consists of Ru, O,
and C, thus confirming the chemical purity of the sample. The Ru map shown in Fig. 2b
correlates well with the EDS map of Ru in the G-COORu sample shown in the inset (a) of
Fig. 2. The Ru map correlates (Fig. 2b) well with the remaining red parts of the G-COORu
Fig. 2. Energy-dispersive (EDS) spectrum of G-COORu. The insets show (a) a TEM image of G-COORu and (b) the RuO-linked G-COOH map.
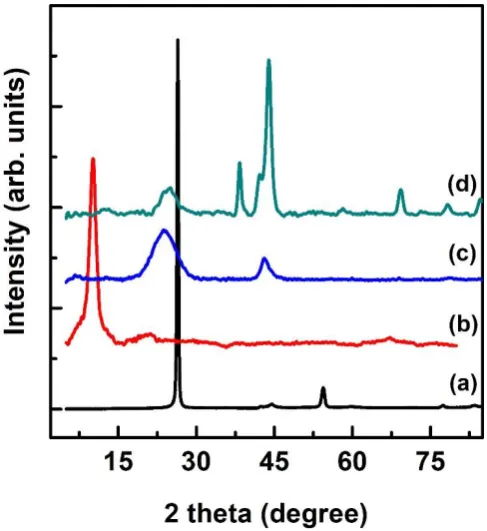
The crystalline structures of the RuO2 nanoparticle wires on G-COOH were analysed using
XRD. The XRD patterns shown in Fig. 3 reveal the (110) diffraction peak of graphite (Fig.
3a) at 26.80°, which implies that the interlayer spacing is 0.340 nm. After exfoliation, the
interlayer spacing of G (Fig. 3b; 10.10°, 0.870 nm) was greater than that of graphite due to
the introduction of oxygenated functional groups on the graphene layers [48-50].The XRD
pattern of G-COOH (Fig. 3c) exhibits main peaks at 25.04° and 44.31°. The XRD peaks (Fig.
3d) of the G-COORu nanocomposite can be assigned to RuO2 (JCPDS-01-1253). The peaks
observed in the pattern of the G-RuO2 nanocomposite correspond to Ru metal
(JCPDS-01-1253), indicating that RuCl3 was partially reduced to Ru metal in the composite. This
phenomenon is attributed to spontaneous reduction via electron transfer from the graphene
surface to RuCl3 during the formation of the material [51]. The (002) and (001) diffraction
peaks in the XRD patterns demonstrate the presence of G and graphene. However, these peaks
disappear in the spectra of the G-RuO2 nanocomposites, which indicates the disordered
restacking of graphene layers. Therefore, the characteristic diffractions peaks of the layered
structure disappear.
Fig. 3. Powder X-ray diffraction (XRD) patterns of (a) graphite, (b) graphene oxide (G), (c) G-COOH, and (d) G-COORu.
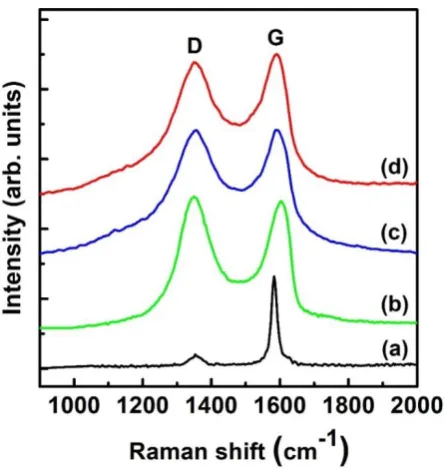
Raman spectroscopy can be employed to characterise the ordering, bonding, and crystallite
size of carbon materials. It is known that the G band (~1582 cm-1) is due to the in-plane phonon
modes of graphene, which indicate sp2 bonding. Moreover, the D band at ~1352 cm-1 is
attributed to the disorder in the graphene layers (sp3 bonding) [53]. Figure 4 shows the Raman
spectra of graphite, G, G-COOH, and G-COORu. The peaks observed at ~1591 cm-1 and
~1350 correspond to the G and D bands, respectively. The Raman spectrum of graphite (Fig.
4a) shows the in-phase vibration of the graphite lattice at 1592 cm-1 (G band) and a weak D
band at 1352 cm-1 [53,54], which indicate a well-ordered structure. The G band in the Raman
presence of isolated double bonds that resonate at higher frequencies compared with graphite
band [55]. In addition, the D band at 1338 cm-1 becomes prominent, indicating smaller
in-plane sp2 domains (G band) caused by extensive oxidation during exfoliation. The Raman
spectra of G-COOH and G-COORu also exhibit G and D bands (Figs 4c and d). Notably, the
increase in the G/D intensity ratios of G-COOH and G-COORu compared with the intensity
of G indicates a decrease in the sizes of the in-plane sp2 domains and a simultaneous increase
in areas with disordered structures upon reduction [56].
Fig. 4. Raman spectra of (a) graphite, (b) graphene oxide (G), (c) COOH, and (d) G-COORu.
The 13C NMR spectrum of G (Fig. 5a) confirms the presence of abundant epoxide and
hydroxyl groups [57], which align perpendicular to the carbon atoms in the basal plane. The
amount of carboxyl groups at the edges of the basal plane is too small for 13C NMR detection,
which agrees with previous studies [57] on G prepared by the Hummers’ method [46].
the exfoliated G is significantly reduced (Fig. 5b). As shown in Fig. 5c, -COOH groups and
Ru ions are present in combination with the generated -COORu, but the -COOH groups
disappeared. In addition, many sp2 carbon atoms were introduced, as demonstrated by the
increased peak height in the 91–151 ppm range, which indicates the formation of
graphene-based materials.
Fig. 5.13C-NMR spectra of (a) graphene oxide (G), (b) G-COOH, and (c) G-COORu.
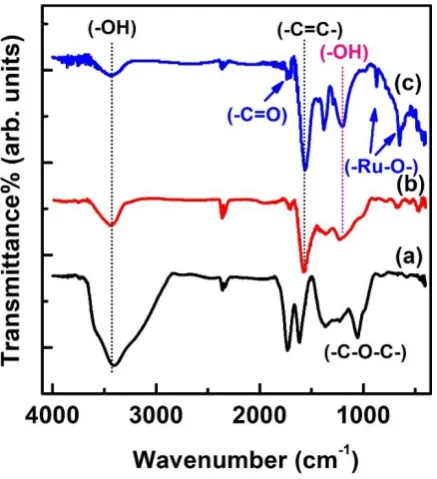
The FTIR spectra were obtained to characterise the oxygen-bearing functional groups of G
after the reduction. Figure 6a shows the characteristic bands in the FTIR spectra of G: a broad
band ranging from 3601 to 3251 cm-1, which indicates the presence of -OH groups; stretching
vibrations corresponding to the C=O bonds of carboxylic groups at 1713 cm-1; stretching
vibrations corresponding to the C-O bonds of ether groups at 1056 cm-1; an in-plane -OH
bending mode observed at 1348 cm-1, and a C=C aromatic ring stretching peak at 1571 cm-1
[58]. The FTIR spectra confirm that G contains carbonyl, hydroxyl, epoxy, and carboxylic
chloroacetic acid are shown in Figs. 6b and c. The intensities of the characteristic vibration
bands due to the νC=O, νC-O-C, and νC-OH vibrations dramatically decrease, indicating the
efficient reduction of G. New peaks at 871 and 658 cm-1 can be observed in Fig. 6c, which are
characteristics of the Ru-O and O-Ru-O stretching vibrations of RuO2 [59].
Fig. 6. Fourier-transform infrared (FTIR) spectra of (a) graphene oxide (G), (b) G-COOH, and (c) G-COORu.
The chemical states of G-COORu were investigated by XPS. As shown in Fig. 7a, the XPS
results demonstrate the presence of the elements O, C, and Ru. Figure 7b shows that the O 1s
spectrum can be divided into four parts: peaks of Ru–O–Ru at 529.7 eV and Ru–O–H at 530.8
eV, which can be ascribed to RuO2 [60,61]; deconvoluted peaks at 284.7, 285.8, 288, and
288.8 eV in the C 1s/Ru 3d spectrum (Fig. 7c), which can be attributed to C–C, C–O, C=O,
and O–C=O, respectively [62,63]; peaks of Ru 3d5/2 at 281.1 eV and Ru 3d3/2 at 285.2 eV,
which represent the doublet due to the spin-orbit coupling at a fixed distance of 4.170 eV; and
to RuO2 [64]. Furthermore, two satellite peaks are located at 281.7 and 286.1 eV. They have
a shake-up feature and are caused by the final state effect [61,65].
The two peaks at 462.35 and 484.8 eV in Fig. 7d correspond to Ru 3p3/2 and Ru 3p1/2 [66–68],
respectively. The Ru 3p3/2 peak can be deconvoluted into two components, which correspond
to RuO2 (462.3 eV) and RuOH (465.3 eV) [69].
Fig. 7. X-ray photoelectron spectra (XPS) of (a) graphene oxide (G)-COORu, (b) O 1s, (c) C 1s/Ru 3d, and (d) Ru 3d.
The performance of a supercapacitor device using graphene-based materials can be analysed
using galvanostatic charge–discharge, CV, and EIS analyses. The EIS analysis is one of the
main methods that is used to examine the fundamental behaviour of electrode materials for
supercapacitors [70]. The specific capacitance of a material is calculated from the slope of its
charge–discharge curves [71]. The EIS data are analysed using Nyquist plots. Each data point
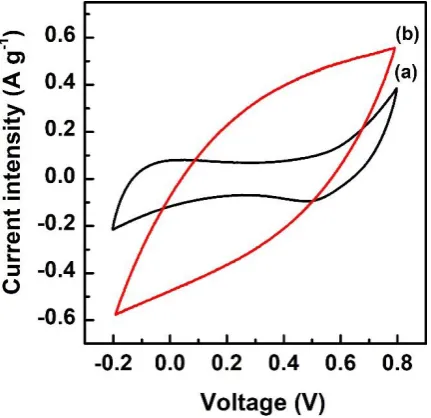
suitable tool to estimate the difference between non-faradic and faradic reactions. Figure 8
shows the CV curves obtained for the G-COOH (Fig. 8a) and G-COORu (Fig. 9b) electrodes
using a three-electrode cell at a voltage scan rate of 10 mV/s in an 1 M Na2SO4 electrolyte,
with a Pt wire as auxiliary electrode and Ag/AgCl as reference electrode. The CV curve
obtained for G-COORu has a rectangular shape within a potential window of -0.20 to 0.80 V
(vs. Ag/AgCl), which indicates double-layer capacitance characteristics. However, when the
potential increases to ~0.80 V, hydrogen evolution becomes increasingly apparent.
Fig. 8. Cyclic voltammetry (CV) curves of (a) graphene oxide (G)-COOH and (b) G-COORu.
Galvanostatic cycling of supercapacitor electrodes was performed at a constant current density
of 100 mA g-1. Figure 9 shows that the charge–discharge curves are linear over the whole
potential range and have constant slopes, indicating nearly perfect capacitive behaviour
[71,72]. The specific capacitance was evaluated using the slope of the charge–discharge curve,
according to the equation C = IΔt/(mΔV), where I is the applied current and m (16.0 mg, not
including the mass of PEFE) is the mass of each electrode [71,72]. The maximum specific
according to the relation CVi2/2 [71,73], where C is the specific capacitance (125 F g-1) and
Vi is the initial voltage (0.0 V).
Fig. 9. Galvanostatic charge–discharge curves of graphene oxide (G)-COORu at 100 mA g-1.
The charge–discharge curves of G-COORu at different specific currents (80, 100, 120, and
150 mA g-1) within the potential window of 0.0 to 1.0 V are shown in Fig. 10. Even at a high
specific current of 100 mA g-1, a specific capacitance of ~126 F g-1 was achieved, implying
that the ratio of G-COOH (1) to RuO2 (2) of the composite has a relatively good rate capability
at any specific current. Note that it is very important for the electrode materials of a
Fig. 10. Galvanostatic charge–discharge curves of graphene oxide (G)-COORu at 80, 100, 130, and 150 mA g-1.
A long cycling life is an important requirement for supercapacitor electrodes [74,71]. A
cycling life test (>501 cycles) was conducted on the ternary composite electrode. Figure 11
demonstrates very stable charge–discharge cycles and shows that the decay of the specific
capacity of the composite electrodes after 501 cycles is less than 5.0%. The results of the
charge–discharge cycle testing of the ternary composite film suggest that the synergetic
interaction between G-COORu and PTFE significantly improves the electrical properties and
Fig. 11. Results of the galvanostatic charge–discharge 501-cycle test for (G)-COORu at 100 mA g-1 (100% = ~125F g-1).
A typical Nyquist impedance plot for this electrode is presented in Fig. 12. This plot was
recorded at an alternating current (AC) voltage amplitude of 50.0 mV, frequency ranging from
0.10 Hz to 10.0 kHz, and initial potential of 0.10 V. The plot shows one depressed semicircle
with a larger diameter at high frequency, which is due to the high charge transfer resistance.
This semicircular loop at high frequency is too small to be identified and the slope of the
impedance plot at low frequency increases and becomes purely capacitive [75,76]. The
45°-slope portion of the Nyquist plot can be attributed to the Warburg resistance, which results
from the frequency dependence of the ion diffusion and transport in the electrolyte. The large
Warburg region of these electrodes indicates a large variation in the ion diffusion path lengths
Fig. 12. Nyquist impedance plot of (G)-COORu.
4. Conclusions
In summary, we used a hydrothermal procedure to prepare G-COORu nanocomposites,
identify the properties and morphology of the materials, and investigate their electrochemical
properties. The G-COORu nanocomposites exhibited high specific capacitances of 100 mA g
-1 to 126 F g-1 in the potential range of 0–1 V. More research and optimisation are needed to
achieve an improved performance of the nanocomposites. However, based on the present
results, we strongly believe that graphene-based materials are likely to be used in
high-efficiency supercapacitors.
Conflicts of interest
There are no conflicts to declare.
Funding
This research did not receive by any specific grant from agencies in the public,
References
[1] S. Zhai, Li Wei, H. E. Karahan, X. Chen and Y. Chen, Energy Storage Mater., 19 (2019)
102–123.
[2] B. Wang, T. Ruan, Y. Chen, F. Jin, L. Peng, Y. Zhou, D. Wang and S. Dou, Energy Storage
Mater., 24 (2020) 22–51.
[3] Q. Wu, Y. X. Xu, Z. Y. Yao, A. R. Liu and G. Q. Shi, ACS Nano, 4 (2010) 1963.
[4] S. Zhai, C. Wang, H. E. Karahan, Y. Wang, X. Chen, X. Sui, Q. Huang, X. Liao, X. Wang
and Y. Chen, Small., 14 (2018) 1800582.
[5] X. Zhang, X. Chen, C. Chen, T. Liu, M. Liu, C. Zhang, T. Huang and A. Yu, RSC Adv., 8
(2018) 39829–39836.
[6] V. C. Tung, L. M. Chen, M. J. Allen, J. K. Wassei, K. Nelson, R. B. Kaner and Y. Yang,
Nano Lett., 9 (2009) 1949.
[7] A. K. Mishra and S. Ramaprabhu, J. Phys. Chem. C, 115 (2011) 14006–14013.
[8] K. S. Novoselov, A. K. Geim, S. V. Morozov, D. Jiang, Y. Zhang, S. V. Dubonos, I. V.
Grigorieva and A. A. Firsov, Science, 306 (2004) 666.
[9] A. K. Geim and K. S. Novoselov, Nat. Mater., 6 (2007) 183.
[10] S. Stankovich, D. A. Dikin, R. D. Piner, K. A. Kohlhaas, A. Kleinhammes, Y. Jia, Y.
Wu, S. T. Nguyen and R. S. Ruoff, Carbon., 45 (2007) 1558.
[11] S. Stankovich, D. A. Dikin, G. H. B. Dommett, K. M. Kohlhaas, E. J. Zimney, E. A.
Stach, R. D. Piner, S. T. Nguyen and R. S. Ruoff, Nature, 442 (2006) 282.
[12] H. A. Becerril, J. Mao, Z. F. Liu, R. M. Stoltenberg, Z. Bao and Y. S. Chen, ACS Nano,
2 (2008) 463.
[13] D. Li, M. B. Müller, S. Gilje, R. B. Kaner and G. G. Wallace, Nat. Nanotech., 3 (2008)
101.
[15] V. C. Tung, M. J. Allen, Y. Yang and R. B. Kaner, Nat. Nanotech., 4 (2009) 25.
[16] Z. Liu, J. T. Robinson, X. Sun and H. J. Dai, J. Am. Chem. Soc., 130 (2008) 10876.
[17] J. R. Lomeda, C. D. Doyle, D. V. Kosynkin, W. F. Hwang and J. M. Tour, J. Am. Chem.
Soc., 130 (2008) 16201.
[18] R. Muszynski, B. Seger and P. V. J. Kamat, J. Phys. Chem. C, 112 (2008) 5263.
[19] Y. Xu, Z. Liu, X. Zhang, Y. Wang, J. Tian, Y. Huang, Y. Ma, X. Zhang and Y. Chen,
Adv. Mater., 21 (2009) 1275.
[20] Y. Sui and J. Appenzeller, Nano Lett., 9 (2009) 2973.
[21] H. Huang, F. Zhou, X. Shi, J. Qin and Z.-S. Wu, Energy Storage Mater., 23 (2019) 664–
669.
[22] H. Wan, G. Peng, X. Yao, J. Yang and X. Xu, Energy Storage Mater., 4 (2016) 59–65.
[23] C. S. Shan, H. F. Yang, J. F. Song, D. X. Han, A. Ivaska and L. Niu, Anal. Chem., 81
(2009) 2378.
[24] V. Rodríguez-Mata, J. Hernández-Ferrer, C. Carrera, A. M. Benito and E.
García-Bordejé, Energy Storage Mater., 25 (2020) 740–749.
[25] Y. P. Zhang, H. B. Li, L. K. Pan, T. Lu and Z. J. Sun, Electroanal. Chem., 634 (2009)
68.
[26] B. J. Lee, S. R. Sivakkumar, J. M. Ko, J. H. Kim, S. M. Jo and D. Y. Kim, J. Power
Sources, 168 (2007) 546.
[27] Y. Shan and L. Gao, Mater. Chem. Phys., 103 (2007) 206.
[28] G. Arabale, D. Wagh, M. Kulkarni, I. S. Mulla, S. P. Vernekar, K. Vijayamohanan and
A. M. Rao, Chem. Phys. Lett., 376 (2003) 207.
[29] Y. F. Shen, R. P. Zerger, R. N. De Guzman, S. L. Suib, L. McCurdy, D. I. Potter and C.
[30] H. Over, Y. D. Kim, A. P. Seitsonen, S. Wendt, E. Lundgren, M. Schmid, P. Varga, A.
Morgante and G. Ertl, Science, 287 (2000) 1474–1476.
[31] J. Huang, Z. Jin, Z.-L. Xu, L. Qin and J.-K. Kim, Energy Storage Mater., 8 (2017) 110–
118.
[32] V. K. A. Muniraj, P. K. Dwivedi, P. S. Tamhane, S. Szunerits, R. Boukherroub and M.
V. Shelke, ACS Appl. Mater. Interfaces, 11 (2019) 18349–18360.
[33] Q. Jiang, N. Kurra, M. Alhabeb, Y. Gogotsi and H. N. Alshareef, Adv. Energy Mater., 8
(2018) 1703043.
[34] H. Ma, D. Kong, Y. Xu, X. Xie, Y. Tao, Z. Xiao, W. Lv, H. D. Jang, J. Huang and Q.‐H.
Yang, Disassembly–Reassembly Approach to RuO2/Graphene Composites for Ultrahigh
Volumetric Capacitance Supercapacitor, Small, 13 (2017) 1700418.
[35] V. K. A. Muniraj, C. K. Kamaja and M. V. Shelke, ACS Sustainable Chem. Eng., 4 (2016)
2528–2534.
[36] P. Wang, Y. Xu, H. Liu, Y. Chen, J. Yang and Q. Tan, Nano Energy, 15 (2015) 116–124.
[37] K. Brousse, S. Pinaud, S. Nguyen, P.-F. Fazzini, R. Makarem, C. Josse, Y. Thimont, B.
Chaudret, P.-L. Taberna, M. Respaud and P. Simon, Adv. Energy Mater., 10 (2020) 1903136.
[38] Y. Sato, K. Yomogida, T. Nanaumi, K. Kobayakawa, Y. Ohsawa and M. Kawai,
Electrochem. Solid State Lett., 3 (2000) 113–116.
[39] M. Ramani, B. S. Haran, R. E. White, B. N. Popov and L. Arsov, J. Power Sources, 93
(2001) 209–214.
[40] J. Zhang, D. Jiang, B. Chen, J. Zhu, L. Jiang and H. Fang, J. Electrochem. Soc., 148
(2001) A1362–A1367.
[41] T. Wang, L. Gao, J. Hou, S. J. A. Herou, J. T. Griffiths, W. Li, J. Dong, S. Gao, M.-M.
Titirici, R. V. Kumar, A. K. Cheetham, X. Bao, Q. Fu and S. K. Smoukov, Nat. Commun., 10
[42] P. Pachfule, X. Yang, Q.-L. Zhu, N. Tsumori, T. Uchida and Q. Xu, J. Mater. Chem. A,
5 (2017) 4835–4841.
[43] X. Qin, X. Zhang, M. Wang, Y. Dong, J. Liu, Z. Zhu, M. Li, D. Yang and Y. Shao, Anal.
Chem., 90 (2018) 11622–11628.
[44] X. Sun, Z. Liu, K. Welsher, J. T. Robinson, A. Goodwin, S. Zaric and H. Dai, Nano Res.,
1 (2008) 203.
[45] G. T. Hermanson, in Bioconjugate Techniques, Academic Press, San Diego, 1996, 2.
[46] W. Hummerʼs and R. Offeman, J. Am. Chem. Soc., 80 (1958) 1339.
[47] S. Donner, H. W. Li, E. S. Yeung and M. D. Porter, Anal. Chem., 78 (2006) 2816.
[48] H. K. Jeong, Y. P. Lee, R. J. W. E. Lahaye, M. H. Park, K. H. An, I. J. Kim, C. W. Yang,
C. Y. Park, R. S. Ruoff and Y. H. Lee, J. Am. Chem. Soc., 130 (2008) 1362.
[49] C. Xu, X. Wang and J. Zhu, J. Phys. Chem. C, 112 (2008) 19841.
[50] A. B. Bourlinos, D. Gournis, D. Petridis, T. Szabo, A. Szeri and I. Dekany, Langmuir, 19
(2003) 6050.
[51] H.C. Choi, M. Shim, S. Bangsaruntip and H. Dai, J. Am. Chem. Soc., 124 (2002) 9058–
9059.
[52] Y. Yang, L.L. Ren, C. Zhang, S. Huang and T.X. Liu, ACS Appl. Mater. Interfaces, 3
(2011) 2779–2785.
[53] A. C. Ferrari, J. C. Meyer, V. Scardaci, C. Casiraghi, M. Lazzeri, F. Mauri, S. Piscanec,
D. Jiang, K. S. Novoselov and S. Roth, Phys. Rev. Lett., 97 (2006) 187401.
[54] F. Tuinstra and J. L. Koenig, J. Chem. Phys., 53 (1970) 1126.
[55] K. N. Kudin, B. Ozbas, H. C. Schniepp, R. K. Prud'homme, I. A. Aksay and R. Car, Nano
Lett., 8 (2008) 36.
[56] A. C. Ferrari and J. Robertson, J. Phys. Rev. B, 61 (2000) 14095.
[58] L. J. Bellamy, in The Infrared Spectra of Complex Molecules, Chapman and Hall,
London, 1975.
[59] S. Dobos, I. Boszormenyi, V. Silberer, L. Guczi and J. Mink, Inorg. Chem. Acta, 96
(1985) L13.
[60] S. Kong, K. Cheng, T. Ouyang, Y. Gao, K. Ye, G. Wang and D. Cao, Electrochim. Acta,
246 (2017) 433–442.
[61] K. H. Kwak, D. W. Kim, Y. Kang and J. Suk, J. Mater. Chem. A, 4 (2016) 16356–16367.
[62] P. Zhang, R. Wang, M. He, J. Lang, S. Xu and X. Yan, Adv. Funct. Mater., 26 (2016)
1354–1364.
[63] J. Lu, Y. Lei, K.C. Lau, X. Luo, P. Du, J. Wen, R. S. Assary, U. Das, D. J. Miller, J. W.
Elam, H. M. Albishri, D. A. El-Hady, Y. K. Sun, L. A. Curtiss and K. Amine, Nat. Commun.,
4 (2013) 2383.
[64] H. Huang, J. Zhu, D. Li, C. Shen, M. Li, X. Zhang, Q. Jiang, J. Zhang and Y. Wu, J.
Mater. Chem. A, 5 (2017) 4560–4567.
[65] W. Wang, S. Guo, I. Lee, K. Ahmed, J. Zhong, Z. Favors, F. Zaera, M. Ozkan and C. S.
Ozkan, Sci. Rep., 4 (2014) 4452.
[66] Y. N. Chang, W. Q. Zhou, J. Wu, G. Ye, Q. J. Zhou, D. Q. Li, D. H. Zhu, T. X. Li, G. M.
Nie, Y. K. Du and J. K. Xu, Electrochim. Acta, 283 (2018) 744–754.
[67] K. Brousse, S. Nguyen, A. Gillet, S. Pinaud, R. Tan, A. Meffre, K. Soulantica, B.
Chaudret, P. L. Taberna, M. Respaud and P. Simon, Electrochim. Acta, 281 (2018) 816–821.
[68] Y. Liu, B. Li, Z. Cheng, C. Li, X. Chang, S. Guo, P. He and H. Zhou, J. Power Sources,
395 (2018) 439–443.
[69] W. Wang, S. Guo, I. Lee, K. Ahmed, J. Zhong, Z. Favors, F. Zaera, M. Ozkan and C. S.
[70] W. Sugimoto, H. Iwata, K. Yokoshima, Y. Murakami and Y. Takasu, J. Phys. Chem. B,
109 (2005) 7330.
[71] B. E. Conway, Kluwer Academic/Plenum Publishers, New York, 1999, 15.
[72] D. Y. Qu, J. Power Sources, 109 (2002) 403.
[73] E. Raymundo-Piñero, F. Leroux and F. Béguin, Adv. Mater., 18 (2006) 1877.
[74] P. Simon and Y. Gogotsi, Nat. Mater., 7 (2008) 845.
[75] L. Cao, F. Xu, Y. Y. Liang and H. L. Li, Adv. Mater., 20 (2004) 1853.