4521
THE EFFECT OF STRATEGIC ORIENTATION,
SUPPLY CHAIN CAPABILITY, INNOVATION
CAPABILITY ON COMPETITIVE ADVANTAGE
AND PERFORMANCE OF FURNITURE RETAILS
Lusy Evylia Puspita, Budiman Christiananta, Lena Ellitan
Abstract-The furniture retail industry which is experiencing challenges with a decline in growth, changes in buying behaviour with e-commerce and other digital platforms, makes competition in this industry more stringent. Building a sustainable competitive advantage that affects business performance, is done through the establishment of Strategic Orientation as a valuable resource , as well as strategic capabilities through Supply Chain Capability and Innovation Capability. By using the Resources Based View approach, this study is aimed to see how the influence of resources (Strategic Orientation) and capabilities (Supply Chain Capability and Innovation Capability), build competitive advantage that meets the attributes of VRIN (Valuable, Rare, In-imitable, Non-substitution) that have an impact on Business Performance as measured by perceptions of retail owners or managers. Using Structural Equation Modelling (SEM ) analysis with the AMOS program, the study sample was 156 owners or heads of traditional furniture retail stores in Surabaya, Indonesia . The findings of this study state that the Strategic Orientation and Supply Chain Capability have a significant effect on Competitive Advantage and Business Performance. Innovation Capability affects Competitive Advantage but does not significantly influence Furniture Retail Performance.
Keywords – Business Performance, Competitive Advantage, Innovation Capability, Resource Based View (RBV), Retail Industry, Strategic Orientation, Supply Chain Capability
—————————— ——————————
1.
INTRODUCTION
The trade sector, particularly retail industry, is one of the crucial drivers of the Indonesian economy with a contribution to the Gross Domestic Product (GDP) of 13.2% which is the second largest sector after manufacturing (Coordinating Ministry for Economic Affairs, 2019). The retail business, which is the final part of a product's travel chain to reach the final consumer, is in a very competitive business environment. In the midst of positive macroeconomic conditions in Indonesia with GDP growth of 5.17% in 2018, the retail industry has experienced a decline in growth every year. In 2017-2018 this sector only grew 4%-5%, after previously in 2014-2015 the average growth in this industry reached 15% . This phenomenon gap, according to the Indonesian Retailers' Association (APRINDO), is an anomaly in retail conditions that are experiencing pressure on Indonesia's positive macroeconomic conditions due to changes in consumer lifestyles and technological innovations (Kompas.com, 2017). Technological innovation with the internet has shifted the conventional way of shopping at brick and mortar stores, switching to digital platforms through e-commerce and other digital applications.
This phenomenon occurs not only in retail for groceries products, but also in furniture retail in Indonesia. Retail sales for furniture products in Indonesia are dominated by traditional retailers , which sell their products in small, self-owned or rented shops, are family-owned stores (mom and pop stores), and are located in locations close to homes or traditional markets (Sunanto, 2012; Ministry of Trade, 2013). Domestic furniture consumption reaches IDR 9 trillion annually in 2013, which is fulfilled from 55% of local furniture products while 45% is imported products from China (Indonesian Ministry of Trade's Trade Research and Development Agency, 2017). Furniture retail market in Indonesia reached USD 29.571 billion, with growth of 3.9% in 2017. The challenge facing the industry is the growth that is predicted to fall, in 2018 the sector grew at 3.6% and is projected in 2020 will experience growth decline at 3.1% (Euromonitor International, 2017). Technological innovations with the presence of online furniture sales through e-commerce and other digital platforms that grow significantly by 11.5% per year make competition tighter, in addition to the inclusion of modern national or international retailers who have a network of outlets in several cities in Indonesia.
Competitive advantage comes from resource ownership and capabilities which has a characteristic VRIN (Valuable, Rare, inimitable, Non-substitution) (Barney, 1991). This study is based on the approach of Resource Based View (RBV) who see that the company is a collection of asset ownership either tangible and intangible, as well as capabilities that are different from one another. The choice of strategic orientation becomes a resource that will shape competitive advantage and company performance, as well as the company's strategic capabilities. Strategic orientation is a unique resource which is an element to build competitive advantage and has an influence on company performance (Ho, 2014). The retail industry with its function to provide the highest purchase value for its ————————————————
Lusy Evylia Puspita, Ph.D student, School of Post Graduate, Widya
Mandala Chatolic University Surabaya, Indonesia, E-mail: [email protected]
Budiman Christiananta, Professor in School of Post Graduate, Widya
Mandala Chatolic University Surabaya, Indonesia, E-mail: [email protected]
Lena Elitan, Ph.D., Associate Professor in Faculty of Business, Widya
4522 consumers through products and services, is highly
dependent on its strategic capabilities, how to build a Supply Chain Capability and Innovation Capability as a competitive advantage .
Seeing how traditional furniture retailing builds competitive advantage and business performance through strategic orientation, supply Chain capabilities and innovation capabilities, will enrich previous studies in the RBV tradition, through strategic orientation constructs, supply chain capabilities and innovation capabilities, with competitive advantage and business performance as an endogenous variable. The phenomenon of online sales business that has begun to shift buying behaviour in traditional shops, has grown significantly. By entering the sales platform through website and social media Instagram, as one indicator in the composite variable of marketing innovation, it becomes novelty in this study.
2.
CONCEPTUAL FRAMEWORK AND
HYPOTHESIS DEVELOPMENT
This research is explanatory for explaining the relationship between the study variables namely Strategic Orientation, Supply Chain Capability, Innovation Capability towards
Competitive Advantage and Business
Performance. This study will describe the shape of a causal relationship between some of the concepts, a few variables or some of the strategies is causality hypothesis developed in management (Ferdinand, 2014 ). Using the Resource Based View approach and conceptual model developed by Barney (1991), this research model was developed by looking at the relationship between resource variables (Strategic Orientation) and capabilities ( Supply Chain Capability and Innovation Capability) to competitive advantage and business performance, such as those illustrated in the Conceptual Framework Model in Figure 1.
Figure 1: Conceptual Framework Model
Strategic Orientation and Competitive Advantage Strategic orientation is one source of competitive advantage. In the perspective of RBV states that a company can gain a competitive advantage and improve its performance within a short own resources and capabilities
are valuable and rare, while a competitive advantage in a sustainable manner if the resources and capabilities can not be duplicated and there is no substitute (Barney, 1991). Strategic orientation is a means used by companies to manage and carry out activities in business and efforts to maintain and improve business performance (Hakala, 2010). According to Gatingnon and Xuereb (1997), strategic orientation is the principles that direct and influence company activities and build behaviour directed to ensure business success and performance. Research on Strategic Management of Strategic Orientation mention that the strategic orientation can increase competitive advantage and business performance (Cadogan et al., 2009; Ruokonen and Saarenketo, 2009). Other research states that strategic orientation is a unique and valuable resource, contributing to competitive advantage and performance (Ho, 2014). Empirical research conducted on strategic orientation and its influence on competitive advantage is research conducted by Garcia et al. (2018) examined the effect of strategic orientation and dynamic capabilities on competitive advantage as an intervening variable and performance as a dependent variable. The findings in the study indicate that all hypotheses to test the effect of variables are accepted. Other studies that support that strategic orientation influences competitive advantage are Mahmood and Hanafi (2013) and Zhou et al. (2009). Formulated hypothesis:
H1: Strategic Orientation effect Competitive Advantage
Supply Chain Capability and Competitive Advantage Managing Supply Chain Capability is the essence of the company's existence, in the midst of intense competition, the supply chain capability becomes a crucial issue because it involves how the company builds its competitive advantage in a sustainable manner against its competitors and influences the company's performance (Suharto and Devie, 2013; Rahmasari, 2011; Li et al., 2004; ). The concept of supply chain is an approach that streamlines the integration of suppliers, manufacturing, warehouses and storage, so that goods can be distributed in the right amount, the right location, and the right time to minimize costs (Christoper, 1998, in Suharto and Devie, 2013). Supply Chain Capability is a medium to build competitive advantage (Chandra and Kumar, 2000; Holmberg, 2000), in his research it was stated that managing supply chain is a way to improve competitive advantage by reducing uncertainty and improving services. From the explanation above, the hypothesis is formulated as follows:
H2: Supply Chain Capability affect the Competitive Advantage
4523 significant effect on competitive advantage and
performance (Keskin, 2006; Badawy, 2009, Guzman et al, 2019). From the explanation above, the hypothesis is formulated as follows:
H3: Innovation Capability influences Competitive Advantage
Strategic Orientation and Business Performance
Strategic Orientation are valuable resources that have contributed to competitive advantage and performance (Ho, 2014). Determining the right strategic orientation will affect competitive advantage, so that alternative choices of strategic orientation will be more influential compared to single strategic orientation (Kumar et al., 2011). Research conducted by Ho (2014), looking at multiple strategic orientations and business performance in high-tech companies, some findings from the results of the study found that strategic orientation consisting of elements of market orientation and entrepreneurial orientation has a positive influence on business performance, while orientation relationships and technology have no influence on business performance. In studies of strategic orientation and business performance there is still the inconsistency of results. Research conducted by Franczak et al. (2009) and Altindag et al., (2011) in family companies and small and medium scale businesses, found that overall strategic orientation had a significant influence on competitive advantage and business performance. From the explanation above, the hypothesis is formulated as follows:
H4: Strategic Orientation influences Business Performance
Supply Chain Capability and Business Performance The management of supply chain is believed by many companies to increase customer value in the form of the level of customer satisfaction which ultimately impacts on the growth of company profits (AMR, 1997 in Chandra and Kumar, 2000). Managing Supply Chain Capability is the essence of the company's existence, in the midst of intense competition the supply chain capability becomes a crucial issue because it involves how the company builds its competitive advantage in a sustainable manner against its competitors and influences the company's performance (Suharto and Devie, 2013; Rahmasari, 2011; Li et al., 2004). Supply Chain Capability is an element that forms a competitive advantage and influences business performance. Supply chain capability can be measured from strategic partnerships, customer relationships, information focus, distribution services ( Li et al., 2004; Defee and Fugate, 2010). From the explanation above, the hypothesis is formulated as follows:
H5: Supply Chain Capability influences Business Performance
Business Innovation and Performance Capabilities The capability of innovation is the ability to continuously change knowledge and ideas into new products, processes and systems that benefit companies and stakeholders (Lawson and Samson, 2001). Innovation is defined as the creation or improvement of products, processes and management systems, or new ways to sell existing products or improvements from existing ones (Guzman et
al., 201 9 ). Some research on the effect of innovation capabilities on business performance still contains findings inconsistencies. Research supports that innovation capabilities have an impact on business performance is conducted by Keskin (2006), Badawy (2009), Guzman et al. (2019). Study conducted by Guzman et al. (2019) on small and medium scale enterprises in the state of Mexico, produced findings that the innovation capability of variables consisting of elements of product innovation, process innovation, marketing innovation and managerial innovation had a positive significant relationship to business performance. From the explanation above, the hypothesis is formulated as follows:
H6: Innovation Capability influences Business Performance
Competitive Advantage and Business Performance From Barney's (1991) conceptual model it is found that competitive advantage influences business performance. The study of strategic resources that meet VRIN criteria and their effects on performance, through a meta-analysis study conducted by Crook et al. (2008), obtained the findings that resources and performance have stronger linkage if the resource meets the attributes of RBV that is valuable, rare, inimitable, non-substitution. Business performance is a multidimensional construct, organizational strategy and activities of different organizations have different influences on the performance of the organization (Lumpkin and Dess, 1996). In general, current performance measurements are carried out by looking at performance
indicators in financial and
non-financial performance (Hilman and Kaliappen, 2015 ). From the description above we formulated the following hypothesis can be formulated:
H7: Competitive Advantage influences Business Performance
3.
METHODOLOGY
3.1. Research Design
This study is included in explanatory research, because in this study the relationship or influence between variables under study will be explained. Explanatory research focuses on the relationship problem between the variables studied. Judging from the purpose of research, this study is a causal research (causal studies) for this study intends to examine the influence between variables, among which is the concept of causality hypothesis (Ferdinand, 2014 ).
3.2. Population and Sample
The population in this study were 257 traditional furniture retail shops in the city of Surabaya ( Surabaya City Investment Office, 2019). The sampling technique is done by Probability or Simple Random Sampling, a sampling technique that provides equal opportunities for each member of the population (Sugiyono, 2014; Ferdinand,
2014). Simple random sampling,
4524 Slovin formula, the sample size obtained was 156
stores . In this study respondents from the selected sample were shop owners or managers/shop heads.
3.3. Variable and Operational Definition
This study consists of five latent variables or formed variables which are classified into three variables, namely: Strategic Orientation (X1), Supply Chain Capability (X2) and Innovation Capability (X3) as exogenous variables. Competitive Advantage (Y1) is an intervening variable. Business Performance (Y2) is an endogenous variable. For the data scale in this study measured using a Likert scale classified as interval data, which has a range of 1 to 5, namely: Strongly agree = 5, agree = 4, Neutral or Doubtful = 3, Disagree = 2, and Very Disagree = 1.
The definition of exogenous, intervening and endogenous variables can be explained as follows:
Strategic Orientation (X1 ): is the respondent's perception of the basic principles used by the company to direct all of its business activities in achieving superior business performance. Strategic orientation indicators refer to Ho (2014) and Hakala (2010), namely: Market Orientation, Entrepreneurial Orientation, Relationship Orientation, Technology Orientation.
Supply Chain Capability (X2) : is the respondent's perception of the company's competence in making solutions in dealing with company issues related to product and service regulation, effectiveness and efficiency of demand and product flow, coordination and integration of business activities between suppliers and retailers. Indicators of supply chain capability are: Strategic Partnership, Customer Relationship, Information Focus/Information Sharing, Distribution Service
Innovation Capability (X3): respondents' perceptions of the company's ability to create product innovations, process innovations, marketing innovations and managerial innovations that provide benefits for stakeholders. Indicators capability of innovation is (Guzman et al., 2019): Product
Innovation, Processes Innovation, Marketing
Innovation, Managerial Innovation.
Competitive Advantage (Y1) : respondents' perceptions of the company's position compared to its competitors, to be able to use the internal strength possessed to give more value than its competitors. Competitive advantage is built from resources and capabilities that have the following requirements (Bharawadj et al., 1993; Barney, 1991): Unique, Inimitable, Rare, Non-Substitution, Competitive Prices.
Business Performance (Y2) : the respondents’ perception to the achievement or achievement of the company as measured by indicators of financial and non-financial (Hilman and Kaliappen, 2015). The indicators used to measure business performance are Financial and Non-Financial Performance.
3.4. Research Instrument and Data Collection Procedures
The main instrument used in this study was a questionnaire, consisting of a number of structured
questions from indicators on each research variable. The procedure of collecting data through a questionnaire was carried out in three stages, namely making a visit or contacting the shop owner or shop head for socialization to explain the purpose of the research and the willingness to become respondents . The second stage gives questionnaires to shop owners or shop heads to fill out . The third stage is the collection of questionnaires that have been filled in, to further process data processing.
4.
DATA ANALYSIS
4.1.Validity and Reliability Testing
In this study the validity and reliability tests were carried out in two stages, the first being the validity and reliability tests for each question item in the questionnaire. The first stage of the test was carried out with the help of the SPSS program, to measure validity using the product moment formula, while reliability was measured using the internal consistency method through Cronbach Alpha. Valid declared if the correlation between items and factors must be positive and the probability of a maximum correlation of 5% (p The items are declared reliable if the Cronbach Alpha reliability coefficient. The second stage of validity and reliability tests are carried out on indicators of the research latent variable. This test is performed using Confirmatory Factor Analysis (CFA) and Construct Reliability (CR) using the Amos 24 program. It is declared valid if the loading value ( Reliability was measured with using CR with a cut-off value of at least 0.7. From the results of testing the validity and reliability of the first phase of each item declared valid and reliable for doing measurement. In the second stage each indicator variable is declared valid and reliable to measure each latent variable.
4.2. Data Analysis Techniques
Empirical data collected was analysed using descriptive analysis methods and Structural Equation Modelling (SEM) analysis. Analysis descriptive empirical data is used to interpret the results of research through the use of a frequency distribution. This analysis is to describe the profile and characteristics of the respondents, as well as the tendency of respondents associated with the variable research. Structural Equation Modelling Analysis (SEM) is carried out to find out and analyse causality relationships between variables, both direct and indirect relationships between the observed variables or constructs.
5.
FINDING AND DISCUSSION
5.1.Respondent Profile
4525 that the traditional furniture stores are located close to the
location of the store is the biggest competitor (42.3%). Little did state that modern retail stores is a competitor of them (9.6%) of the total respondents.
5.2. Model and Hypothesis
Figure 2: Effect of Strategic Orientation, Supply Chain Capability, Innovation Capability on Business Performance through Competitive Advantage
After testing the validity and reliability of each indicator variable of the latent variable declared valid and reliable, multivariate data is normal, there is no singularity and no outliers, Figure 2 shows the path diagram analysis for each latent variable. From the overall model testing the model meets the goodness of fit indices so that the model is declared good (2 = 159.814; df =132; = 0.061; RMSEA= 0.062; GFI= 0.912; AGFI= 0.886; CMIN/DF= 1.197; TLI= 0.950; CFI= 0.961). From the accepted model each path coefficient can be interpreted, which is the hypothesis in the study, with structural equation model as follows:
Y1 = 0.295 X1 + 0.334 X2 + 0.284 X3
Y2 = 0.512 X1 + 0.269 X2 + 0.075 X3 + 0.265 Y1
X1 = Strategic Orientation; X2 = Supply Chain Capability; X3 = Innovation Capability; Y1 = Competitive Advantage; Y2 = Business Performance.
From testing the path coefficients and structural equations, the details are presented in the Table 1:
Table 1: Results of the Test Coefficient of the Business Performance Model
From the structural equation involving variables and the path between variables there are influences between variables which include direct influence, indirect effect and total effect, as presented in Table 2, Table 3 and Table 4.
Table 2 : Direct Effects of Research Variables
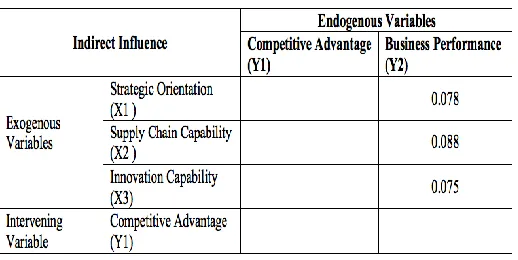
Table 3 : Indirect Effects of Research Variables
Table 4 : Effects of Total Research Variables
Variable
Coefficient
CR
Prob
Information
Strategic Orientation (X1) èCompetitive Advantage (Y1)
.295
1.990
.047
Significant
Supply Chain Capability (X2) èCompetitive Advantage
(Y1)
.334
1.973
.049
Significant
Innovation Capability (X3) èCompetitive Advantage (Y1)
.284
2.916
.004
Significant
Strategic Orientation (X1) èBusiness Performance (Y2)
.512
3.594
.000
Significant
Supply Chain Capability (X1) èBusiness Performance
(Y2)
.269
1.986
.048
Significant
4526 Strategic Orientation towards Competitive Advantage
and Business Performance
From the path coefficient test and structural equation as shown in Figure 2 and Table 1, it is found that the Strategic Orientation have a significant effect on Competitive Advantage. This can be seen from the value of the path coefficient that is positive at 0.295 with a CR value of 1.990 obtained a significance probability () of 0.047 which is smaller than the significance level () 0.05. With this positive trend, it can be interpreted that every time there is an increase in strategic orientation, it will increase competitive advantage. Of the four indicators measuring variables Strategic Orientation namely Market Orientation, Entrepreneurial Orientation, Relationships Orientation and Technology Orientation, of the CFA analysis it is found that Market Orientation is the most significant indicator for measuring the strategic orientation seen from the loading value of 0.925. While other indicators sequentially level of significance in measuring the Strategic Orientation is Relationships Orientation (0.851), Entrepreneurial Orientation (0.829) and Technology Orientation (0.804). Strategic Orientation which is a configuration (Hakala, 2010) and multi-strategic (Ho, 2014) is more complementary, with the determination of alternative strategic orientation that will affect competitive advantage and performance, compared to only one alternative or single strategic (Kumar et al., 2012). Configuring the right strategic orientation will allow traditional furniture retailers to build competitive advantage through products and services at competitive prices, rare, not easily replaceable, irrevocable and unique.
Strategic orientation has a significant and positive effect on Business Performance . This can be seen from the path coefficient that is positive at 0.512 with a CR value of 3.594 and a significance probability obtained (p) of 0.000 which is smaller than the significance level () determined at 0.05. With this positive tendency it can be interpreted that every time there is an increase in Strategic Orientation it will improve Business Performance as measured by the perception of the owner or head of the store of financial and non-financial performance. From the CFA analysis of the indicator variables of latent variables Business Performance, it was found that the Non-Financial Performance indicators as seen from purchasing preferences and customer loyalty, are more significant indicators in measuring Business Performance, this is seen from the loading value of 0.828, while the Financial Performance as measured by sales growth and profitability per year of at least 5% over the last three years, has a smaller loading value of 0.742. This finding is in line with previous research which states that Strategic Orientation has an influence on Business Performance (Franczak et al., 2009; Altindag et al., 2011). From Table 2 about the direct relationship between variables, it is found that Strategic Orientation is an exogenous variable that has the largest direct relationship to Business Performance, seen from the loading value of 0.512. It can be interpreted that Business Performance is influenced the most by exogenous variables Strategic Orientation, compared to other exogenous variables. In total direct and indirect relationships Strategic
Orientation has the largest total relationship to Business Performance (Table 3).
From the above explanation it was concluded that:
H1: Strategic Orientation influences Competitive Advantage, accepted.
H4: Strategic Orientation influences Business Performance, accepted.
Supply Chain Capability for Competitive Advantage and Business Performance
From the results of testing the path coefficient and structural model equations, it is found that the Supply Chain Capability has a significant and positive effect on Competitive Advantage. This can be seen from the path coefficient that is positive at 0.334 with a CR value of 1.973 and a significance probability (p) was obtained of 0.049 which is smaller than the significance level () which is determined at 0.05. Thus Supply Chain Capability directly influences Competitive Advantage, which means that increasing Supply Chain Capability will increase Competitive Advantage. Supply Chain Capability is measured by a variable indicator of Strategic Partnership, Customer Relationship, Information Focus and Distribution Service. From the CFA analysis of the indicator variables of the Supply Chain Capability latent variable, it was found that the Information Focus is the most significant indicator to measure the Supply Chain Capability seen from the loading value of 0.939. Sequentially the significant indicator variables to measure Supply Chain Capability are Strategic Partnership (0.874), Customer Relationship (0.746) and Distribution Service (0.668). Supply Chain Capability which is the core capability that enables a company to carry out efficiency and integration in its supplier channels from suppliers, manufactures, warehouses, stores to end consumers (Christopher, 1998 in Suharto and Devie, 2013). From Table 2 it can be seen that Supply Chain Capability is an exogenous variable that has the largest direct relationship to Competitive Advantage with a loading value of 0.334. Can be interpreted that the Supply Chain Capability exogenous variables has biggest influence toward Competitive Advantage than other exogenous variables .Supply Chain Capability has a significant and positive effect on Business Performance . This can be seen from the path coefficient that is positive at 0.269 with a CR value of 1.986 and a significance probability (p) of 0.048 is obtained which is less than the significance level () determined at 0.05. Thus the Supply Chain Capability affects Business Performance, which means that every time there is an increase in Supply Chain Capability, it will affect the increase in Business Performance . Supply Chain Capability is a critical point for the retail industry that affects its performance. This finding is in line with previous studies which state that Supply Chain Capability influences Business Performance (Suharto and Devie, 2013; Li et al., 2004 ; Chandra and Kumar, 2000; Rahmasari, 2011). In Table 2 about the indirect relationship between variables, it can be seen that Supply Chain Capability has the largest indirect relationship through Competitive Advantage to Business Performance with a loading value of 0.088 . It can be interpreted that the Supply Chain Capability has a greater influence on Business Performance through Competitive Advantage. From the above explanation it can be concluded:
4527 H5: Supply Chain Capability influences Business
Performance, accepted
Innovation Capability for Competitive Advantage and Business Performance
From the results of testing the path coefficient and structural model equations, it is found that the Innovation Capability has a significant and positive effect on Competitive Advantage . This is evident from the positive marked path coefficient of 0.284 with a CR value of 2.916 and a significance probability (p) of 0.004 is obtained which is smaller than the significance level () determined at 0.05. Thus the Innovation Capability directly affects the Competitive Advantage of 0.284, which means that every time there is an increase in Innovation Capability (X3), it will increase Competitive Advantage. Innovation Capability which has four indicator variables namely Product Innovation, Process Innovation, Marketing Innovation and Managerial Innovation, from the CFA analysis conducted for each indicator variable from the latent variable Innovation Capability, it is found that Marketing Innovation has the greatest significance to measure Innovation Capability, compared with other indicator variables, seen from the loading value of 0.891. Sequentially, the significant indicator variables for measuring Innovation Capability after Marketing Innovation are Product Innovation (0.843), Process Innovation (0.621), Managerial Innovation (0.585). Innovation capability is the main key from the source of competitive advantage (Shoham and Fiegenbaum, 2002), a process that allows adaptation and build sustainable competitive advantage (Johanson, 2004, in Breznik and Hisrich, 2014). The findings in this study support previous research that states that Innovation Capability have influence on the competitive advantage (Chatzoglou and Chatzoudes, 2017; Guzman et al., 201 9 ; Badawy, 2009; Wang and Ahmed, 2007).From the path coefficient test and structural model equation, it is found that the Innovation Capability has no significant effect on Business Performance . This can be seen from the path coefficient that is positive at 0.075 with a CR value of 1.099 and a significance probability (p) is obtained 0.272 which is greater than the significance level () determined at 0.05. Thus Innovation Capability has no significant effect on Business Performance, which means that every time there is an increase in Innovation Capability, it will not increase or decrease Business Performance. The characteristics of the traditional furniture retail industry that has limited resources to innovate, and the ownership structure and management of the family business are a challenge for traditional furniture retailers to innovate. Innovation Capability does not directly affect Business Performance, but it is significant if through Competitive Advantage.
From the above explanation, it can be concluded:
H 3: Innovation Capability influences Competitive Advantage, accepted
H6: Innovation Capability influences Business Performance, rejected
Competitive Advantage and Business Performance From the results of testing the path coefficient and structural model equations, it was found that Competitive Advantage has a significant and positive effect on Business Performance. This can be seen from the path coefficient that is positive at 0.265 with a CR value of 2.600 and a significance probability (p) is obtained 0.009 which is
smaller than the significance level () which is determined at 0.05. Thus Competitive Advantage has a direct effect on Business Performance of 0.265, which means that every time there is an increase in Competitive Advantage it will improve Business Performance. Competitive Advantage which is the company's position to provide more value to the market compared to that carried out by competitors. Competitive Advantage is built from resources and capabilities (Bharawadj et al., 1993; Barney, 1991). From this finding, it is found that the resources and capabilities which consist of Strategic Orientation, Supply Chain Capability and Innovation Capability have a significant influence on Competitive Advantage in the form of products and services that have competitive prices, are rare, have no substitute, are not easily imitated and are unique. Through Competitive Advantage significantly affects Business Performance both Non-Financial Performance as measured by purchasing preferences and customer loyalty, also influences Financial Performance, which is the ability to increase sales and profitability of at least 5% per year for the past three years. This finding is in line with previous research which states that Competitive Advantage influences Performance (Barney, 1991; Crook, 2008 ; Garcia and Moreno, 2018; Mahmood and Hanafi, 2013; Zhou et al., 2009; Li et al., 200 4 ; Suharto and Devie, 2013).
From the above explanation it was concluded that:
H7: Competitive Advantage influences Business Performance, accepted
6.
CONCLUSIONS AND SUGGESTIONS
From the presentation of study findings about the relationship of Strategic Orientation, Supply Chain Capability, Innovation Capability to Competitive Advantage and Business Performance in the traditional furniture retail industry, several findings and also suggestions are given regarding the relationship between research variables. Strategic Orientation is a source of competitive advantage that affects Business Performance. Strategic orientation is a multi-strategic configuration and consists of market orientation, relationship orientation, entrepreneurial orientation and technology orientation, accuracy to determine alternative strategic orientation will determine competitive advantage and performance. From this study, it was found that market orientation as measured by customer and competitor orientation, had the greatest significance to measure strategic orientation, followed by relationship orientation with customers and suppliers. Strategic orientation is the biggest factor that has an influence on Business Performance, in addition to other factors in this study.Supply Chain Capability is the biggest factor influencing Competitive Advantage. Capabilities consisting of indicators of strategic partnership, customer relationship, information focus and distribution service , become a source of competitive advantage. Information focus is a significant indicator to build this capability, the company's ability to distribute and access important information from all members of the supply chain, will affect competitive advantage and performance. The communication that is developed among all members of the supply chain, will be an important capability to build competitive advantage.
4528 managerial innovation become a source of competitive
advantage. Marketing innovation as measured by innovations carried out on the sales channel by making online sales through websites and social media Instagram, is significantly able to become the capability of innovation owned, in addition to other innovations. The capability of innovation does not significantly influence business performance but through competitive advantage. The characteristic of the traditional furniture retail industry is one of the challenges for the creation of innovation capabilities, namely the limited resources owned, the ownership structure and managerial family business which is very much determined by the managerial style of the owner.
REFERENCES
[1] Altindag, E., Cemal, Z, & Zafer, A. (2011). Strategic Orientation on Firm Performance in Turkish Family Owned Firms. Eurasian Business Review, 1, 18-36.
[2] The Agency for the Assessment and Development of Trade of the Ministry of Trade of the Republic of Indonesia. (2017). Furniture commodity info. Jakarta: Author.
[3] Badawy, AM (2009), The game changer: how you can drive revenue and profit growth with innovation. Journal of Engineering and Technology Management, Vol. 26 No. 1/2, 97-99.
[4] Barney, J. (1991). Firm resources and sustained competitive advantage. Journal of Management, 17 (1), 99-120.
[5] Bharadwaj, S., Varadarajan, P.R., Fahy, J. (1993). Sustainable competitive advantage in service industries: a conceptual model and research propositions. Journal of Marketing, 57 (4), 83-99.
[6] Breznik, L., Hisrich, R.D. (2014). Dynamic capabilities vs. innovation capability: are they related ? Journal of Small Business and Enterprise Development, 21 (3), 368-384.
[7] Cadogan, JW., Kuivalainen, O., Sundqvist, S. (2009). Export market oriented behaviour and export performance: quadatric and moderating effects differing degrees of market dynamism and internationalization. Journal of International Marketing, 17 (4), 71-89.
[8] Chandra, C., Kumar, S. (2000). Supply chain management in theory and practice: a passing fad or a fundamental change? Industrial Management and Data Systems, 100 (3), 100-113.
[9] Chatzoglou, P., Dimitrios, C. (2017). The role of innovation in competitive building advantages: an empirical investigation. European Journal of Innovation Management, 21 (1), 44-69.
[10]Crook, TR, Ketchen, DJ, Combs, JG, & Todd, SY (2008). Strategic resources and performance: a meta-analysis. Strategic Management Journal, 29, 1141-1154.
[11]Day, GS, Wensley, R. (1988). Assessing advantage: a framework for diagnosing competitive superiority. Journal of Marketing, 52, 1-20.
[12]Defee, CC, Fugate, BS (2010). Changing perspective of capabilities in the dynamic supply
chain era. The International Journal of Logistics Management, 21 (2), 180-206.
[13]Dess, GD, Robinson, RB (1984). Measuring organizational performance in the absence of objective measures: the case of the privately held firm and conglomerate business unit. Strategic Management Journal, 5 (3), 265-273.
[14]Surabaya City One-Stop Service Investment Office, 2019
[15]Euromonitor International. (2017). Euromonitor Passport Home and Garden: Wooden Retailing in Indonesia 2014-2021. Singapore: Author.
[16]Ferdinand, A. (2014). Management research methods research guidelines for thesis writing, thesis and management science dissertations. Semarang: Pustaka Utama Series. [17]Franczak, J., Larry, W., & Eric, M. (2009). An
Empirical examination of strategic orientation and sme performance. National Proceedings Winter 2009 Conference of Small Business Institute, 68-90.
[18]Garcia, AN, Moreno, MR, & Pires, P.DA.B. (2018). Competitive advantages as a complete mediator variable in strategic resources, dynamic capabilities and performance relations in the car sales sector. Journal of Business, 10 (1), 24-37.
[19]Gatingnon, H., Xuereb, JM (1995). Strategic orientation of the firm and new product performance. Journal of Marketing Research, 34, 77-90.
[20]Guzman, GM, Reyes, JA, Castro, SYP, & Kumar, V. (2019). Innovation capabilities and performance: are they truly linked in SMEs? International Journal of Innovation Science, 11 (1), 48-62.
[21]Hakala, H. (2010). Strategic orientation in management literature: three approaches to understanding the interaction between market, technology, entrepreneurial, and learning orientation. International Journal of Management Reviews, 13 (2), 199-217.
[22]Hilman, H. and Kaliappen, N. (2015). Innovation strategies and performance: are they truly linked? World Journal of Entrepreneurship, Management and Sustainable Development, Vol. 11 No. 1, pp. 48-63.
[23]Ho, YW. (2014). Multiple strategic orientation and business performance: a comprehensive investigation of high-tech firms. Digital library of Adelaide University School of Business, October 2014. Downloaded 27 February 2018 from https://digital.library.adelaide.edu.au .
[24]Holmberg, S. (2000). A system perspective on supply chain measurement. International Journal of Physical Distribution & Logistics Management, 17 (4), 495-510.
[25]The Coordinating Ministry for Economic Affairs in Indonesia. (2019). Indonesia's Economic Outlook 2019. Delivered at the seminar, Medan July 1, 2019.
4529 [27]Keskin , H. (2006). Market orientation, learning
orientation, and innovation capabilities in
SMEs. European Journal of
Innovation Management , 9, 396-417.
[28]Kompas.com (2017). Anomaly in modern retail in Indonesia . Downloaded December 6, 2018 from https://properti.kompas.com .
[29]Kumar, K., Boesso, G., Favotto, F. and Menini, A. (2012) Strategic orientation, innovation, patterns and performances of SMEs and large companies. Journal of Small Business and Enterprise Development, 19, 132-145.
[30]Lawson, B., Samson, D. (2001). Developing innovation capability in organizations: a dynamic capabilities approach. International Journal of Innovation Management, 5 (3), 337-400.
[31]Li, S .; Bhanu, RN, TS Ragu, N., & Subba, R. (2004). The impact of supply chain management practices on competitive advantage and organizational performance. The International Journal of Management Science, 107-124.
[32]Lumpkin, GT, Dess, GG (1996). Clarifying the entrepreneurial orientation constructing and linking it to performance. Academy of Management Review , 21, 135-172.
[33]Mahmood, R., Hanafi, N. (2013). Entrepreneurial orientation and business performance of women-owned small and medium enterprises in Malaysia: competitive advantage as a mediator. International Journal of Business and Social Science, Vol. 4 (1), 82-90.
[34]Rahmasari, L. (2011), The effect of supply chain management on company performance and competitive advantage (Case Study in the creative industries in Central Java). Scientific Informatics Magazine, 2 (3), 89-103.
[35]Ruokonen, M., Saarenketo, S. (2009). The strategic orientation of rapidly internalizing software companies. European Business Review , 21 (1), 17-41.
[36]Shoham, A., Fiegenbaum, A. (2002). Competitive determinants of organizational risk taking attitude: the role of strategy reference points. Management Decision, Vol. 40 (2), 127-141
[37]Sugiyono (2014). Management research methods are quantitative, qualitative, combination approaches (mixed methods), action research, evaluation research . Bandung: Alfabeta.
[38]Suharto, R., Devie. (2013). Analyze the effect of supply chain management on competitive advantage and company performance. Business Accounting Review, 1 (2).
[39]Sukoco, BM. (2015). Strategy theory: evolution & evaluation. Surabaya: Airlangga University Press. [40]Sunanto, S. (2012). Modern retail impact on store
preferences and traditional retailers in West Java. Asian Journal of Business Research , 2 (2), 7-23.
[41]Wang, CL, Ahmed, PK (2007). Dynamic capabilities: a review and research agenda. International Journal of Management Review , 9 (1), 31-51.
[42]Zhou, KZ, Brown, JR, & Dev, CS (2009). Market orientation, competitive advantage, and performance: a demand-based perspective. Journal of Business Review h, 62 (11), 1063-1070.