IJEDR1702251
International Journal of Engineering Development and Research (www.ijedr.org)1603
Simplified method of analysis by Fourier transform of
XAFS data and bond length determination of some Fe
compounds using Mathcad
Neetu Parsai
1, Ravindra Parsai
21School of Physics, Devi Ahilya University, Indore, 452001 2SVKM'S, NMIMS University, MPSTME, Shirpur, 425405
________________________________________________________________________________________________________ Abstract— X-ray absorption fine structure (XAFS) data analysis method has been demonstrated for some Iron
compounds. Theoretical calculations of XAFS data has been done in software Mathcad. Different XAFS parameters of XAFS equation have been calculated. The phase shift parameter has been calculated from the experimental data using LSS method. The backscattering amplitude has been taken from standard table of Mckale. Other parameters have been taken from crystallographic data table. These parameters have been used as input to the XAFS equation to generate theoretical XAFS data. The XAFS data and its Fourier transform agree well with the corresponding experimental data. First shell bond length has been calculated from theoretical and experimental data of magnitude of Fourier transform. The first shell bond length has also been calculated using LSS method. The values of bond lengths calculated theoretically for the first coordination shell agrees well with the experimental values, crystallographic values and the values obtained from LSS method.
IndexTerms—Absorption, Mathcad, XAFS, Bond length.
________________________________________________________________________________________________________
I.INTRODUCTION
X-ray absorption fine structure (XAFS) is influenced by the immediate surroundings of the absorbing atom. The environment of a metal ion in its complexes can be studied with the help of X-ray absorption K-edge and the fine structure. X-ray absorption spectroscopy (XAS) has been used in determining the local atomic and electronic structure of the absorbing centers (atoms) in various fields of science. The XAS method has become more approachable with the use of synchrotron sources all over the world. It has found considerable achievement in the theory and practical realization with the use of convenient and easily available software packages1.
The term XAFS covers both X-ray absorption near edge structure (XANES) and extended X-ray absorption fine structure (EXAFS). XANES can be used to determine the valence state and coordination geometry, while EXAFS can be used to determine the local molecular structure of a particular element within a sample.The EXAFS region arises due to single scattering processes and extends up to 2000 eV from an edge.
The present communication is aimed to provide a simpler technique of EXAFS analysis by using computer software Mathcad. A simplified method has been presented for the analysis of extended X-ray absorption fine structure (EXAFS) data and determining the first shell bond length. The same method has been satisfactory demonstrated earlier for some transition metal foils and copper compounds.2-4
In the present work the technique has been described by using the available EXAFS data of some of the Iron compounds obtained at room temperature at the synchrotron EXAFS beamlines. The theoretical EXAFS data have been generated in MathCAD, for the first coordination shell around the absorbing atom, using the EXAFS equation. For the input in this equation, the phase shift for the backscattered photoelectron wave has been calculated from the experimental data using LSS method5, the
backscattering amplitude has been taken from the standard table of Mckale6, which is based on curved wave approximation and
other parameters have been taken from crystallographic data. Fourier transforms of both the experimental and theoretical data have been computed and they agree well with each other in case of all the compounds. The first shell bond lengths in all the compounds have been computed from the Fourier transforms and they have been found to agree well with the crystallographic values.
II.METHODOLOGY
IJEDR1702251
International Journal of Engineering Development and Research (www.ijedr.org)1604
2
0 2 2
2
( ) ( )
( ) sin 2 2 ( ) exp -2
exp -2 / ( )
j j
j j j
j j
j
N S F k
k kR k k
kR R k
(1)
where k is the photoelectron wave vector, Nj is the number of atoms of type j at radial distance Rj from the absorber. The exponential term exp (–2σj2k2) represents fluctuations of distances due to structural and thermal disorder. The exponential term
exp( 2 Rj/ ( ))k
represents contribution due to finite mean free paths λ(k) of the photoelectrons (between 5 and 10 Å for photoelectron energies from 30 to 1000 eV). S02 is an average amplitude reduction factor; its value is usually 0.8–0.9. F kj( ) is a
scattering amplitude function characteristic of the jth atom, δj(k) is a phase function that takes account of the varying potential field along which the photoelectron moves.
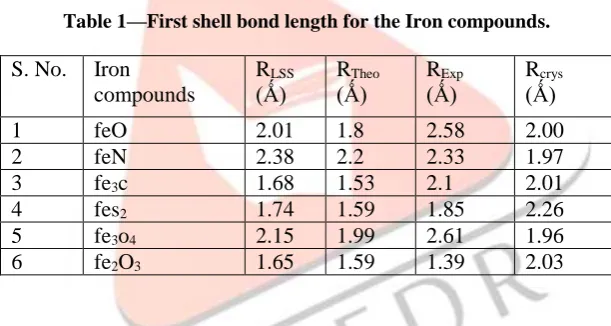
Fig. 1 —Experimental EXAFS spectra for Iron compounds.
be seen from equation (1) that the above parameters have to be known to determine the final ( ) k function. The coordination number, distance and disorder, the backscattering amplitudes has been taken from standard tables and phase shifts have been determined from experimental data analysis. Tt was found that the backscattering amplitude and phase shifts are transferable from one compound to the other, if the same absorber-back scatterer pair is involved11.
Fourier transform of the EXAFS function
( )
k
results in a radial distribution function8. The Fourier transformation isdefined by
max
min
1
( ) ( ) exp(2 )
2
k n
n R k k k ikR dk
(2)
The radial distribution function is defined in R-space and will have peaks at RRj corresponding to average radial distance
(R) of the jth atom from the absorbing atom. Thus, the positions of the peaks in the Fourier transform of the EXAFS signal are
related to the distance of the neighbouring atoms from absorbing atom and the magnitude of Fourier transform is related to the number of neighbouring atoms at this distance. The distance found in the Fourier transformation is about 0.2-0.5 Ǻ shorter than the actual distance due to the energy dependence of the phase factors in the sine function of EXAFS equation.
IJEDR1702251
International Journal of Engineering Development and Research (www.ijedr.org)1605
standard EXAFS equation given in Eq. (1) for the first shell. The values of N1, 12 and λ are taken from crystallographic data12,13.
The backscattering amplitude Fj(k) has been taken from the tables of Mckale6. The phase shift has been extracted from the
experimental data using LSS method5.
0 2 4 6 8 10 12 14 16
-0.6 -0.4 -0.2 0.0 0.2 0.4 0.6
FeO
(k)
k(Å-1)
O r i g i n P r o 8 E v a l u a t i o n O r i g i n P r o 8 E v a l u a t i o n
O r i g i n P r o 8 E v a l u a t i o n O r i g i n P r o 8 E v a l u a t i o n
O r i g i n P r o 8 E v a l u a t i o n O r i g i n P r o 8 E v a l u a t i o n
O r i g i n P r o 8 E v a l u a t i o n O r i g i n P r o 8 E v a l u a t i o n
O r i g i n P r o 8 E v a l u a t i o n O r i g i n P r o 8 E v a l u a t i o n
O r i g i n P r o 8 E v a l u a t i o n O r i g i n P r o 8 E v a l u a t i o n
O r i g i n P r o 8 E v a l u a t i o n O r i g i n P r o 8 E v a l u a t i o n
0 2 4 6 8 10 12 14 16
-0.4 -0.3 -0.2 -0.1 0.0 0.1 0.2 0.3 0.4
FeN
(k)
k(Å-1)
O r i g i n P r o 8 E v a l u a t i o n O r i g i n P r o 8 E v a l u a t i o n
O r i g i n P r o 8 E v a l u a t i o n O r i g i n P r o 8 E v a l u a t i o n
O r i g i n P r o 8 E v a l u a t i o n O r i g i n P r o 8 E v a l u a t i o n
O r i g i n P r o 8 E v a l u a t i o n O r i g i n P r o 8 E v a l u a t i o n
O r i g i n P r o 8 E v a l u a t i o n O r i g i n P r o 8 E v a l u a t i o n
O r i g i n P r o 8 E v a l u a t i o n O r i g i n P r o 8 E v a l u a t i o n
O r i g i n P r o 8 E v a l u a t i o n O r i g i n P r o 8 E v a l u a t i o n
0 2 4 6 8 10 12 14 16
-0.8 -0.6 -0.4 -0.2 0.0 0.2 0.4 0.6
0.8 Fe3C
(k)
k(Å-1)
O r i g i n P r o 8 E v a l u a t i o n O r i g i n P r o 8 E v a l u a t i o n
O r i g i n P r o 8 E v a l u a t i o n O r i g i n P r o 8 E v a l u a t i o n
O r i g i n P r o 8 E v a l u a t i o n O r i g i n P r o 8 E v a l u a t i o n
O r i g i n P r o 8 E v a l u a t i o n O r i g i n P r o 8 E v a l u a t i o n
O r i g i n P r o 8 E v a l u a t i o n O r i g i n P r o 8 E v a l u a t i o n
O r i g i n P r o 8 E v a l u a t i o n O r i g i n P r o 8 E v a l u a t i o n
O r i g i n P r o 8 E v a l u a t i o n O r i g i n P r o 8 E v a l u a t i o n
0 2 4 6 8 10 12 14 16
-0.8 -0.6 -0.4 -0.2 0.0 0.2 0.4 0.6 0.8
FeS2
(k)
k(Å-1)
O r i g i n P r o 8 E v a l u a t i o n O r i g i n P r o 8 E v a l u a t i o n
O r i g i n P r o 8 E v a l u a t i o n O r i g i n P r o 8 E v a l u a t i o n
O r i g i n P r o 8 E v a l u a t i o n O r i g i n P r o 8 E v a l u a t i o n
O r i g i n P r o 8 E v a l u a t i o n O r i g i n P r o 8 E v a l u a t i o n
O r i g i n P r o 8 E v a l u a t i o n O r i g i n P r o 8 E v a l u a t i o n
O r i g i n P r o 8 E v a l u a t i o n O r i g i n P r o 8 E v a l u a t i o n
O r i g i n P r o 8 E v a l u a t i o n O r i g i n P r o 8 E v a l u a t i o n
0 2 4 6 8 10 12 14 16
-0.8 -0.6 -0.4 -0.2 0.0 0.2 0.4 0.6 0.8 1.0
(k)
k(Å-1)
Fe2O3
O r i g i n P r o 8 E v a l u a t i o n O r i g i n P r o 8 E v a l u a t i o n
O r i g i n P r o 8 E v a l u a t i o n O r i g i n P r o 8 E v a l u a t i o n
O r i g i n P r o 8 E v a l u a t i o n O r i g i n P r o 8 E v a l u a t i o n
O r i g i n P r o 8 E v a l u a t i o n O r i g i n P r o 8 E v a l u a t i o n
O r i g i n P r o 8 E v a l u a t i o n O r i g i n P r o 8 E v a l u a t i o n
O r i g i n P r o 8 E v a l u a t i o n O r i g i n P r o 8 E v a l u a t i o n
O r i g i n P r o 8 E v a l u a t i o n O r i g i n P r o 8 E v a l u a t i o n
0 2 4 6 8 10 12 14 16
-0.4 -0.2 0.0 0.2
0.4 Fe3O4
(k)
k(Å-1)
O r i g i n P r o 8 E v a l u a t i o n O r i g i n P r o 8 E v a l u a t i o n
O r i g i n P r o 8 E v a l u a t i o n O r i g i n P r o 8 E v a l u a t i o n
O r i g i n P r o 8 E v a l u a t i o n O r i g i n P r o 8 E v a l u a t i o n
O r i g i n P r o 8 E v a l u a t i o n O r i g i n P r o 8 E v a l u a t i o n
O r i g i n P r o 8 E v a l u a t i o n O r i g i n P r o 8 E v a l u a t i o n
O r i g i n P r o 8 E v a l u a t i o n O r i g i n P r o 8 E v a l u a t i o n
O r i g i n P r o 8 E v a l u a t i o n O r i g i n P r o 8 E v a l u a t i o n
Fig. 2 —Theoretical (solid line) EXAFS spectra for Iron compounds. For calculations the backscattering amplitude has been taken from the
tables of of Mckale3 (for R= 2.5 Å).
III.RESULTS AND DISCUSSION
Fig. 1 shows experimental curves for FeO, FeN, Fe3C, FeS2, Fe2O3, Fe3O4 Iron compounds. Fig. 2 shows corresponding
computed ( )k versus k curves. For the computation of the data for Fig. 2, the phase factor has been extracted from the experimental data and the back scattering amplitude has been taken from the theoretical tables of Mckale6 for a distance of 2.5
[Ǻ] from the central absorbing atom.
IJEDR1702251
International Journal of Engineering Development and Research (www.ijedr.org)1606
0 2 4
0.0 0.5 1.0 1.5 2.0 2.5 3.0 FeO Mag n itu d e o f F o u rie r tran sfo rm
R (Å) O r i g i n P r o 8 E v a l u a t i o n O r i g i n P r o 8 E v a l u a t i o n
O r i g i n P r o 8 E v a l u a t i o n O r i g i n P r o 8 E v a l u a t i o n
O r i g i n P r o 8 E v a l u a t i o n O r i g i n P r o 8 E v a l u a t i o n
O r i g i n P r o 8 E v a l u a t i o n O r i g i n P r o 8 E v a l u a t i o n
O r i g i n P r o 8 E v a l u a t i o n O r i g i n P r o 8 E v a l u a t i o n
O r i g i n P r o 8 E v a l u a t i o n O r i g i n P r o 8 E v a l u a t i o n
O r i g i n P r o 8 E v a l u a t i o n O r i g i n P r o 8 E v a l u a t i o n
0 2 4
0.0 0.5 1.0 1.5 2.0 FeN Mag n itu d e o f F o u rie r tran sfo rm
R (Å)
O r i g i n P r o 8 E v a l u a t i o n O r i g i n P r o 8 E v a l u a t i o n
O r i g i n P r o 8 E v a l u a t i o n O r i g i n P r o 8 E v a l u a t i o n
O r i g i n P r o 8 E v a l u a t i o n O r i g i n P r o 8 E v a l u a t i o n
O r i g i n P r o 8 E v a l u a t i o n O r i g i n P r o 8 E v a l u a t i o n
O r i g i n P r o 8 E v a l u a t i o n O r i g i n P r o 8 E v a l u a t i o n
O r i g i n P r o 8 E v a l u a t i o n O r i g i n P r o 8 E v a l u a t i o n
O r i g i n P r o 8 E v a l u a t i o n O r i g i n P r o 8 E v a l u a t i o n
0 2 4
-0.5 0.0 0.5 1.0 1.5 2.0 2.5 3.0 3.5 4.0 Mag n itu d e o f F o u rie r tran sfo rm
R (Å) Fe3C O r i g i n P r o 8 E v a l u a t i o n O r i g i n P r o 8 E v a l u a t i o n
O r i g i n P r o 8 E v a l u a t i o n O r i g i n P r o 8 E v a l u a t i o n
O r i g i n P r o 8 E v a l u a t i o n O r i g i n P r o 8 E v a l u a t i o n
O r i g i n P r o 8 E v a l u a t i o n O r i g i n P r o 8 E v a l u a t i o n
O r i g i n P r o 8 E v a l u a t i o n O r i g i n P r o 8 E v a l u a t i o n
O r i g i n P r o 8 E v a l u a t i o n O r i g i n P r o 8 E v a l u a t i o n
O r i g i n P r o 8 E v a l u a t i o n O r i g i n P r o 8 E v a l u a t i o n
0 2 4
-0.5 0.0 0.5 1.0 1.5 2.0 2.5 3.0 3.5 4.0 FeS2 Mag n itu d e o f F o u rie r tran sfo rm
R (Å) O r i g i n P r o 8 E v a l u a t i o n O r i g i n P r o 8 E v a l u a t i o n
O r i g i n P r o 8 E v a l u a t i o n O r i g i n P r o 8 E v a l u a t i o n
O r i g i n P r o 8 E v a l u a t i o n O r i g i n P r o 8 E v a l u a t i o n
O r i g i n P r o 8 E v a l u a t i o n O r i g i n P r o 8 E v a l u a t i o n
O r i g i n P r o 8 E v a l u a t i o n O r i g i n P r o 8 E v a l u a t i o n
O r i g i n P r o 8 E v a l u a t i o n O r i g i n P r o 8 E v a l u a t i o n
O r i g i n P r o 8 E v a l u a t i o n O r i g i n P r o 8 E v a l u a t i o n
0 2 4
0 1 2 3 4
Fe2O3
Mag n itu d e o f F o u rie r tran sfo rm
R (Å)
O r i g i n P r o 8 E v a l u a t i o n O r i g i n P r o 8 E v a l u a t i o n
O r i g i n P r o 8 E v a l u a t i o n O r i g i n P r o 8 E v a l u a t i o n
O r i g i n P r o 8 E v a l u a t i o n O r i g i n P r o 8 E v a l u a t i o n
O r i g i n P r o 8 E v a l u a t i o n O r i g i n P r o 8 E v a l u a t i o n
O r i g i n P r o 8 E v a l u a t i o n O r i g i n P r o 8 E v a l u a t i o n
O r i g i n P r o 8 E v a l u a t i o n O r i g i n P r o 8 E v a l u a t i o n
O r i g i n P r o 8 E v a l u a t i o n O r i g i n P r o 8 E v a l u a t i o n
0 2 4
0.0 0.5 1.0 1.5 2.0 2.5 3.0
Fe3O4
Mag n itu d e o f F o u rie r tran sfo rm
R (Å)
O r i g i n P r o 8 E v a l u a t i o n O r i g i n P r o 8 E v a l u a t i o n
O r i g i n P r o 8 E v a l u a t i o n O r i g i n P r o 8 E v a l u a t i o n
O r i g i n P r o 8 E v a l u a t i o n O r i g i n P r o 8 E v a l u a t i o n
O r i g i n P r o 8 E v a l u a t i o n O r i g i n P r o 8 E v a l u a t i o n
O r i g i n P r o 8 E v a l u a t i o n O r i g i n P r o 8 E v a l u a t i o n
O r i g i n P r o 8 E v a l u a t i o n O r i g i n P r o 8 E v a l u a t i o n
O r i g i n P r o 8 E v a l u a t i o n O r i g i n P r o 8 E v a l u a t i o n
Fig. 4 —
Magnitudes of Fourier transform of the EXAFS spectra of Fig. 2.
The ( ) k versus k spectra are then Fourier transformed. The amplitudes of the Fourier transform of the experimental and theoretical EXAFS curves of Fig. 1 and Fig. 2 are shown in Fig. 3 and Fig. 4 respectively. It is seen from Figs 1 to 4 that t he theoretical ( )k versus k curves as well as their Fourier transforms are in reasonable agreement with their experimental counterparts, showing that the simplified method presented in this work is quite satisfactory to analyze Iron compounds.
The values of the bond length for the first shell in these Iron compounds have been reported in Table 1. The bond lengths have calculated from magnitude of Fourier transform of theoretical and experimental XAFS curves. The values of the bond lengths have been found to be in good agreement with the crystallographic values12and the values obtained by LSS method5 which are
also given in Table 1.
Table 1—First shell bond length for the Iron compounds.
S. No.
Iron
compounds
R
LSS(Ǻ)
R
Theo(Ǻ)
R
Exp(Ǻ)
R
crys(Ǻ)
1
feO
2.01
1.8
2.58
2.00
2
feN
2.38
2.2
2.33
1.97
3
fe
3c
1.68
1.53
2.1
2.01
4
fes
21.74
1.59
1.85
2.26
5
fe
3o
42.15
1.99
2.61
1.96
6
fe
2O
31.65
1.59
1.39
2.03
IV.CONCLUSIONS
One of the more innovative and simple method of EXAFS data analysis has been presented using software Mathcad and demonstrated for some Iron compounds. The experimental EXAFS data has been analyzed using LSS method and Fourier transform method employing software Athena. The EXAFS data also computed theoretically using Fourier transform method employing software Mathcad. The theoretical ( ) k versus k curves agree well with the experimental ( )k versus k curves. The Fourier transforms of the computed ( )k data fit well with the Fourier transforms of the experimental ( )k data for all the compounds. The first shell bond length determined by the present method shows good agreement with the experimental value calculated using LSS method, Fourier transform method and the crystallographic value for all the studied Iron compounds.
REFERENCES
[1] See the Program Library of the European Synchronous Center ESRF in Internet: http://www.esrf.fr/. [2] Mishra A, Parsai N&Shrivastava B D, Indian Journal of Pure & Applied Physics49 (2011) 25-29. [3] Parsai N, Mishra A &Shrivastava B D, X-Ray Spectrom., 41 (2012) 219.
[4] Mishra A, ParsaiN &Shrivastava B D, Solid state Physics, AIP ConfProc, 1447 (2012) 173. [5] Lytle F W, Sayers D E & Stern E A, Phys Rev B, 11 (1975) 4825.
[6] McKale A G, Knapp G S & Chan S K,Phys Rev B, 33(1986) 841. [7] Lee P A &Pendry J B, Phys. Rev. B, 11(1975) 2795.
[8] Gurman S J &Pettifer R F, Phil. Mag. B, 40 (1979) 345.
IJEDR1702251
International Journal of Engineering Development and Research (www.ijedr.org)1607
[10]Teo B K, EXAFS: Basic Principles and Data Analysis, Inorganic Chemistry Concepts, Vol. 9, Springer-Verlag, Berlin 1986.
[11]Bunker B A & Stern E A, Phys Rev B, 27 (1983) 1017.
[12]Stern E A, Sayers D E & Lytle F W, Phys Rev B, 11 (1975) 4836.
![Fig. 1 shows experimental curves for FeO, FeN, Fe3computed experimental data and the back scattering amplitude has been taken from the theoretical tables of Mckale[Ǻ] from the central absorbing atom](https://thumb-us.123doks.com/thumbv2/123dok_us/8210640.1371879/3.595.83.521.504.706/experimental-computed-experimental-scattering-amplitude-theoretical-central-absorbing.webp)