www.nat-hazards-earth-syst-sci.net/17/765/2017/ doi:10.5194/nhess-17-765-2017
© Author(s) 2017. CC Attribution 3.0 License.
Costs of sea dikes – regressions and uncertainty estimates
Stephan Lenk1, Diego Rybski1, Oliver Heidrich2, Richard J. Dawson2, and Jürgen P. Kropp1,3
1Potsdam Institute for Climate Impact Research – PIK, Member of Leibniz Association, P.O. Box 601203,
14412 Potsdam, Germany
2School of Civil Engineering & Geosciences & Tyndall Centre for Climate Change Research, Newcastle University,
Newcastle upon Tyne NE1 7RU, UK
3University of Potsdam, Institute of Earth and Environmental Science, Potsdam, Germany
Correspondence to:Diego Rybski (ca-dr@rybski.de)
Received: 12 August 2016 – Discussion started: 26 August 2016
Revised: 14 February 2017 – Accepted: 13 March 2017 – Published: 29 May 2017
Abstract. Failure to consider the costs of adaptation strate-gies can be seen by decision makers as a barrier to imple-menting coastal protection measures. In order to validate adaptation strategies to sea-level rise in the form of coastal protection, a consistent and repeatable assessment of the costs is necessary. This paper significantly extends current knowledge on cost estimates by developing – and implement-ing usimplement-ing real coastal dike data – probabilistic functions of dike costs. Data from Canada and the Netherlands are anal-ysed and related to published studies from the US, UK, and Vietnam in order to provide a reproducible estimate of typ-ical sea dike costs and their uncertainty. We plot the costs divided by dike length as a function of height and test four different regression models. Our analysis shows that a linear function without intercept is sufficient to model the costs, i.e. fixed costs and higher-order contributions such as that due to the volume of core fill material are less significant. We also characterise the spread around the regression models which represents an uncertainty stemming from factors beyond dike length and height. Drawing an analogy with project cost overruns, we employ log-normal distributions and calculate that the range between 3xandx/3 contains 95 % of the data, wherex represents the corresponding regression value. We compare our estimates with previously published unit costs for other countries. We note that the unit costs depend not only on the country and land use (urban/non-urban) of the sites where the dikes are being constructed but also on char-acteristics included in the costs, e.g. property acquisition, utility relocation, and project management. This paper gives decision makers an order of magnitude on the protection costs, which can help to remove potential barriers to
develop-ing adaptation strategies. Although the focus of this research is sea dikes, our approach is applicable and transferable to other adaptation measures.
1 Introduction
Sea-level rise represents a foreseeable consequence of cli-mate change and there is considerable interest in comparing coastal flood damage with adaptation costs (Hallegatte et al., 2013; Boettle et al., 2013b). In line with rising temperature and sea levels, more frequent and severe storm surges need to be anticipated (Menéndez and Woodworth, 2010). The construction of dikes and similar defensive measures has a long history and coastal protection represents a conventional means to adapt to the threat of sea-level rise (Jonkman et al., 2013). In 1990 it was estimated that protecting 360 000 km of the coasts globally against a 1 m sea-level rise would cost at least USD 500 billion over a 100-year period (Dronkers et al., 1990).
2014), and (iv) the construction costs of the adaptation mea-sure (Jonkman et al., 2013; Aerts et al., 2013).
While the climate impact and adaptation research commu-nity has made progress in assessing the categories (i)–(iii), the construction costs of protection measures (category iv) are poorly reported in the literature. These are considered an engineering problem yet are also of utmost importance for decision makers in order to assess the scale of the investment that is required to provide protection and is achievable for the resources available. Failure to consider the costs of strategies can invalidate, or at least expose as impractical, recommen-dations from research studies. However, engineers hesitate to provide general and transferable costs. Academic literature is lacking “real-life” auditable cost information on adaptation measures (Heidrich et al., 2013) which can be of use to in-ternational, national, and local decision makers. Indeed, pro-viding an order of magnitude and reducing uncertainties on the protection costs can remove potential barriers in design-ing and implementdesign-ing adaptation strategies (Reckien et al., 2015; Heidrich et al., 2016).
One way to investigate construction costs is to study sim-ilar dikes that were planned or constructed in the past. Us-ing historic construction costs is referred to as the elemental costs projection approach (BCIS, 2012). However, civil en-gineering works are profoundly influenced by factors such as scale, nature, and characteristics of the project. This means that a straightforward use of this approach is not always sen-sible as rates, prices, and discounts can fluctuate dramatically over short periods of time and between projects (MacDon-ald, 2013). For various reasons a synthesis of coastal pro-tection costs is very limited. On the one hand, the costs of coastal protection projects in different countries and regions are affected by socio-economic conditions like land value, land use, building prices, gross domestic product (GDP), and the level of income. On the other hand, the comparability of projects is often hindered by heterogeneity and a lack of in-formation about the site and project specifics, e.g. site prepa-ration, site access, and material sourcing. In addition, defence measures differ in engineering, design, and specific features like detailed dimensions and unit costs are not reported in the academic literature. Thus, it is difficult to make generalised estimates of the costs of a sea dike project of length l and heighthat a given site and country.
Most authors studying adaptation to sea-level rise and ad-junctive costs refer to Hoozemans et al. (1993) or Jonkman et al. (2013). The former estimated unit costs for three coastal protection measures according to the Dutch standard includ-ing dike design, construction, taxes, fees, levies, and royal-ties (Hoozemans et al., 1993). The latter investigated costs for coastal protection of low-lying delta areas using project-oriented case studies for the Netherlands, New Orleans, and Vietnam (Jonkman et al., 2013). The authors estimated unit costs for constructing and raising different types of hard and soft coastal protection measures and analysed the rela-tionship between dike height, dike cross section, and costs
of raising dikes. Based on data from three countries it has been suggested that the estimates from Hoozemans et al. (1993) significantly overestimate the costs of constructing dikes (Linham et al., 2010).
Many of the above-mentioned studies use “unit costs”, i.e. the dike costs can be expressed per metre height. This, however, implies the assumption that there is a linear rela-tion without fixed costs – an assumprela-tion that to our knowl-edge has not been supported quantitatively so far. In addi-tion, uncertainty is at most quantified in terms of a range, i.e. some upper or lower values. This paper significantly ex-tends these approaches by developing probabilistic functions of dike costs and implementing them using real coastal dike data.
In order to provide areproducible assessment of typical protection costs and their uncertainties, the work reported here explores estimated construction costs for sea dikes in Canada (Metro Vancouver) and in the Netherlands. We ad-dress two questions. First, what is the appropriate functional form for the costs of a sea dike as a function of its height? Since both the footprint and the volume are proportional to the height of a dike, the costs of a unit of fixed length should increase linearly and quadratically with the height, respec-tively, leading to the question of the composite “functional form”.
Second, what is the range of uncertainty that needs to be considered? Although our findings are related to sea dikes, our research approach and determination of uncertainty is po-tentially applicable and transferable to other adaptation mea-sures. In the research on climate change adaptation, the con-straints related to quantifying coastal protection costs listed above represent anuncertaintywhich needs to be taken into account when cost effectiveness of adaptation measures is studied.
2 Data
We base our main analysis on two data sources, namely Cost of Adaptation – Sea Dikes & Alternative Strategies (Delcan Corporation, 2012) for Canada (Metro Vancouver) and Kosten van maatregelen – Informatie ten behoeve van het project Waterveiligheid 21e eeuw(de Grave and Baase, 2011) for the Netherlands. The advantage is that the data these reports contain are homogeneous (at least within each of both reports) since the cost figures come from the same sources and the same case studies, and they relate to similar constructions, i.e. sea and estuarine dikes. Moreover, local conditions, e.g. affecting the exact shape of the dikes, have been taken into account.
2.1 Canada
Estimated costs to protect Vancouver and neighbouring mu-nicipalities against sea-level rise by 2100 are provided by Delcan Corporation (2012) – for a summary see Sect. A1. The protection measures are subdivided into 36 shoreline reaches of more than 250 km length between the Burrard Inlet and Boundary Bay. A reach is a general term for a length of a stream or river, usually suggesting a level, un-interrupted stretch. The Canadian report provides estimates in the preparation phase and we do not have any information about whether any of the planned dike has actually been con-structed to date. Since it is not specified, we assume all costs are given in 2012 Canadian dollars (CAD).
The costs presented in the Canadian study are referred to as a “class D estimate” (Delcan Corporation, 2012). Ac-cording to Public Works and Government Services Canada this means an indicative estimate giving unit costs based on a comprehensive assumptions and project requirements list. This kind of estimate is developed during the project feasibil-ity and design stage (Public Works and Government Services Canada) and therefore subject to change.
Table 4.3A and B in Delcan Corporation (2012) list the length and estimated costs separated for each dike, which al-lows us to calculate the costs per unit length. In addition, Ta-ble 2.1 in Delcan Corporation (2012) provides information about the expected flood levels in 2100 and the required in-crease of the dike height or the height of the dike to be built. Accordingly, we can study the costs per length as a function of the height, i.e. CAD per length in metres vs. height in me-tres. Eight of the reaches with bespoke features (e.g. barrier; see Sect. A1) have been excluded from the analysis. Addi-tional information is included on whether the dikes are to be raised or newly constructed and whether the corresponding site is urban or rural.
As detailed in Sect. A1, the costs consist of (i) structural flood protection/embankment; (ii) utility relocation, pump stations, and flood boxes; (iii) property acquisition; (iv) seis-mic resilience measures; (v) environmental compensation;
and (vi) site investigation, project management, and engi-neering.
2.2 Netherlands
The Dutch report (de Grave and Baase, 2011) provides the estimated costs needed to raise the height of dikes across the Netherlands in order to decrease the estimated risk of flood-ing by a factor of 10 relative to the present protection level. The estimates are broken down into 205 dikes of more than 2600 km length and the associated costs are estimated for several steps of raising the dike height (25, 50, 100, 200 cm), depending on the need.
Tables G and K in de Grave and Baase (2011) list the length, the height steps, and the associated cost estimates for two different scenarios. The first scenario assumes the flood risks according to the current installed protection and the current Dutch legislation. The second scenario takes into ac-count the improvement of flood protection planned between 2015 and 2020. According to Eijgenraam and Zwaneveld (2011) the second scenario is the more realistic one and the first is an underestimate. As, in addition, the second scenario is based on more recent developments, we choose to use only the cost estimates from the second scenario in this study.
As detailed in Sect. A2 the costs consist of (i) ground work and construction measures per unit length, (ii) special mea-sures, (iii) adjustment or relocation of infrastructure, (iv) land acquisition, (v) environmental compensation, and (vi) addi-tional costs for operations and maintenance.
3 Analysis
In the following we fit regressions to the data, quantify the uncertainty, and compare our results with previously pub-lished estimates.
3.1 Regressions
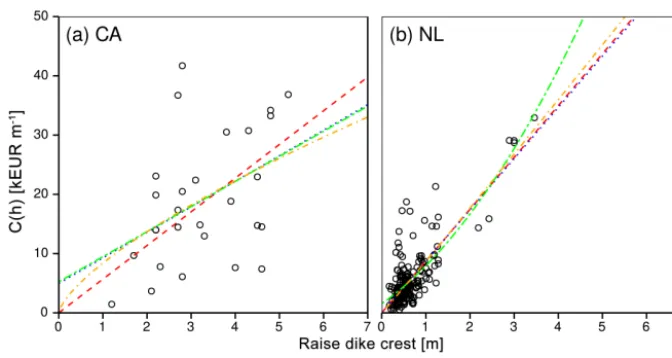
In Fig. 1 we plot the costs per metre length of dike as a func-tion of raising the height of the dikes. For the Canadian data (Fig. 1a) it can be seen that the costs are spread over a wide range roughly between 5000 and 40 000 EUR m−1 for dike construction (or raise) with final heights of 1 to 5 m. Only a weak tendency of reduced costs for lower heights can be inferred visually from Fig. 1. The correlation coefficient is %p=0.43[0.07,0.69]([·]denotes 95 % confidence). For the
Netherlands (Fig. 1b) the spread is overall smaller but most of the constructions are lower than 1 m and only a few values are available for a raise of roughly 3 m. Here, the correlation coefficient is%p=0.79[0.74,0.84].
Figure 1.Plot of dike costs versus crest height for all dikes with a linear fit without intercept, LWI (Eq. 1, red dashed line), a linear polynomial fit, LP (Eq. 2, blue dotted line), a quadratic polynomial fit, QP (Eq. 3, green double dashed line), and a power-law fit, PL (Eq. 4, orange dotted dashed line).(a)Twenty-eight Canadian dikes with the obtained fits and(b)205 dikes in the Netherlands with the obtained fits. The linear and quadratic polynomials collapse in(a)and the linear without intercept with the linear polynomial in(b); see main text.
and (iv) power law (PL):
LWI: C(h)=b h, (1)
LP: C(h)=a+b h, (2)
QP: C(h)=a+b h+c h2, (3)
PL: C(h)=b hβ, (4)
whereC(h)(in EUR m−1) is the dike cost per metre length andhis height (in m).a, b, c,andβare parameters, wherea denotes the intercept (fixed costs, which are independent of the dike height),bthe slope, also known as unit costs (Hooze-mans et al., 1993; Jonkman et al., 2013),cthe quadratic term, andβ the exponent of the power law. The parameters have corresponding units, such as EUR m−3 for c. For simplic-ity, we omit the units of the parameters. Following Hudson et al. (2015), cost elements can be well split into (1) planning and design costs, e.g. consulting and survey costs; (2) capi-tal costs, e.g. enabling and construction costs; (3) inspection costs, e.g. operational, public safety and monitoring program costs; and (4) maintenance costs, e.g. maintenance and re-placement costs.
Equation (1) is the simplest form, i.e. a linear relation with slopebstarting at 0 EUR m−2forh=0 m. In principle, even for very small projects, costs can emerge independent of the actual height (fixed costs) due to e.g. planning. Thus, Eq. (2) is similar to Eq. (1) but has an offset, i.e. the intercept a, which is linked to the preparation costs. Since the volume of the dike is proportional to the square of its height (see item 1b in Sect. A1), an additional quadratic term (see e.g. Diaz, 2016) in Eq. (3) leads to a second-order polynomial. Finally, the power-law Eq. (4) is inspired e.g. by Eq. (4) in Hinkel et al. (2014) and by Eq. (7) in Fankhauser (1995). Regression
fits were carried out using non-linear least-squares optimisa-tion of the fit parameters applying the Levenberg–Marquardt algorithm (Marquardt, 1963). Using constraints of the pa-rameters, we force the regressions to C(0)≥0 and to be monotonically increasing.
In Fig. 1a it can be seen for the Canadian data that the four models all have similar shapes and their deviations are small compared to the spread of the data. It is worth noting that the linear and the quadratic fits collapse; i.e. the best fit of Eq. (3) has a vanishing quadratic term (c≈0) so that it becomes a linear regression identical to Eq. (2). Since our regression models vary strongly in the number of parameters (1. . .3), those with more parameters are expected to perform better in terms of root-mean-squared error (RMSE). Thus, in or-der to compensate for this advantage, we explore the Akaike information criterion (AIC) (Akaike, 1974), which evaluates the trade-off between goodness of fit and complexity of the models considered.
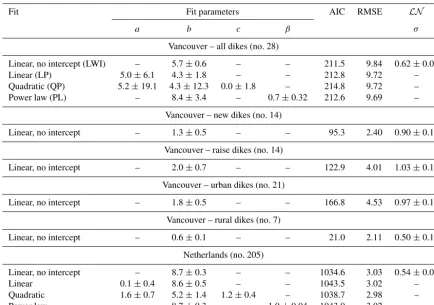
Table 1.Fit parameters according to Eq. (1)–(4), standard errors (±), and AIC and RMSE values for the regression types and parameterσ of the log-normal distributions (LN, Eq. 5) fitted to the residuals, for the data from Canada (Delcan Corporation, 2012) and the Netherlands
(de Grave and Baase, 2011). The root-mean-squared error is calculated according to RMSE= r
1
n
Pn i=1
Yi− ˆYi
2
, whereYˆiare the fitted
values andYiare the measured ones. For both AIC and RMSE, smaller values are better.
Fit Fit parameters AIC RMSE LN
a b c β σ
Vancouver – all dikes (no. 28)
Linear, no intercept (LWI) – 5.7±0.6 – – 211.5 9.84 0.62±0.08
Linear (LP) 5.0±6.1 4.3±1.8 – – 212.8 9.72 –
Quadratic (QP) 5.2±19.1 4.3±12.3 0.0±1.8 – 214.8 9.72 –
Power law (PL) – 8.4±3.4 – 0.7±0.32 212.6 9.69 –
Vancouver – new dikes (no. 14)
Linear, no intercept – 1.3±0.5 – – 95.3 2.40 0.90±0.19
Vancouver – raise dikes (no. 14)
Linear, no intercept – 2.0±0.7 – – 122.9 4.01 1.03±0.19
Vancouver – urban dikes (no. 21)
Linear, no intercept – 1.8±0.5 – – 166.8 4.53 0.97±0.15
Vancouver – rural dikes (no. 7)
Linear, no intercept – 0.6±0.1 – – 21.0 2.11 0.50±0.13
Netherlands (no. 205)
Linear, no intercept – 8.7±0.3 – – 1034.6 3.03 0.54±0.03
Linear 0.1±0.4 8.6±0.5 – – 1043.5 3.02 –
Quadratic 1.6±0.7 5.2±1.4 1.2±0.4 – 1038.7 2.98 –
Power law – 8.7±0.3 – 1.0±0.04 1043.0 3.02 –
costs, except earth fill, which contributes quadratically. The core material, however, represents a comparably small frac-tion of the total costs. Structural flood protecfrac-tion costs rep-resent approximately 10 % of the total costs and the earth fill costs represent approximately 85 % of the former (see Sect. A1).
The regressions for the Netherlands data are shown in Fig. 1b. Again, the fits are very similar and only the quadratic model, Eq. (3), deviates in the upper range h >3 m. In Table 1 it can be seen that according to AIC, the linear model without offset, Eq. (1), performs best and the quadratic model, Eq. (3), does second best. Here, the power law, Eq. (4), and the linear model without intercept, Eq. (1), col-lapse. The power law fits best forβ≈1 so that the two mod-els are identical, which is also reflected in similar resulting parametersb. A quadratic contribution might only take ef-fect for heights beyond the available h range, which is in agreement with (Jonkman et al., 2013). Moreover, the lin-ear model, Eq. (2), leads to a rather small offseta≈0.1 (in particular compared to the standard error of 0.4), so that it is almost identical to the regression without offset. Again, we can conclude that the linear contribution dominates and
fixed costs as well as non-linear contributions from the dike volume can be disregarded; i.e. non-linearities are not neces-sary.
3.2 Uncertainty
While the regressions characterise the typical relation be-tween dike height and costs, next we want to study the spread around the fits. These deviations of individual dikes are due to site-specific properties and design features that go beyond the height and length and are usually unavailable. There-fore, drawing the analogy with cost overruns, we employ log-normal distributionsLN(µ, σ )(Chou et al., 2009) to char-acterise the spread.
Accordingly, we analyse the residuals of the fits as an es-timate of the uncertainty. The residuals were calculated as the ratio of fitted to observed values. Then we fit log-normal probability distributions:
LN(r;µ, σ )=√ 1
2π σ rexp
(ln(r)−µ)2
2σ2
wherer=C(h)ˆ
C(h) denotes the residuals,µthe location parame-ter, andσ the scale parameter, using maximum likelihood es-timation, and employ the Kolmogorov–Smirnov test to eval-uate the goodness of fit.
Two features support the choice of the log-normal distribu-tion in this context. First, the log-normal distribudistribu-tion by defi-nition excludes negative values. Second, the statistical spread is relative (for the same reason). Instead of a fixed uncertainty e.g. in EUR, it is defined as a fraction, or percentage, which is plausible since bigger projects typically have larger absolute uncertainty.
For the Canadian and the Netherlands data, the estimated uncertainties are displayed together with the LWI regres-sions in Fig. 2. It can be seen that the uncertainty cov-ers a rather large range that increases (due to the log-normal definition) from low to high dikes, achieving ap-proximately EUR 10 000–100 000 for dikes of apap-proximately 4–6 m height (see Table 1 for the obtained parameters and Sect. 3.3).
In the log–log scale (insets of Fig. 2) one can see qual-itatively that the regressions and uncertainties represent the data reasonably well. The cost for raising a dike in Canada by 1 m is estimated to be EUR 6000, where the range be-tween 3.4x and x/3.4 contains 95 % of the uncertainty (x≈EUR 6000). Analogously, for the Netherlands, the esti-mate is about EUR 9000 with an uncertainty factor 2.9. Nev-ertheless, few values are located outside the 95 % ranges, suggesting that the log-normal distribution might only be a first approximation.
The Canadian data also include information about whether the dikes are completely new or existing dikes are to be raised. In addition, the land use in terms of urban/rural is specified, which strongly affects the land price (see Sect. A1) and eventually the design of construction. Thus, we anal-yse the data separately according to these four categories (new/raise, urban/rural). Due to the small sample size, we cannot fully disentangle all combinations; e.g. “new” in-cludes both urban and rural. We find that the fits for new and raised dikes are very similar but larger samples would be required to support this finding. In contrast, urban and rural dikes differ clearly in their costs and accordingly lead to dif-ferent slopes. The resulting fit parameters, i.e. unit costs and log standard deviations, are also included in Table 1. For the Netherlands a similar difference between urban and rural has been reported by de Grave and Baase (2011). Mostly the land value causes a discrepancy between urban and rural dikes. The actual land value, however, is very site specific and is highly sensitive to land-use and socio-economic changes as discussed earlier.
3.3 Comparison with results from other studies To compare our results with results from Hoozemans et al. (1993) and Jonkman et al. (2013) we converted all data to EUR for the Netherlands in 2012, involving three
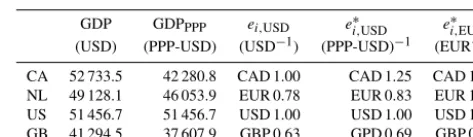
adjust-Table 2.GDP per capita, purchasing power parity (PPP) GDP per capita, and mean exchange rates (ei,USD) of 2012 (World Bank, 2016) for Canada, the Netherlands, and the USA, as well as the PPP-adjusted exchange ratesei,∗USDandei,∗EUR. The PPP-adjusted ex-change rates give the amount of money in the currency of the coun-try having the same purchasing power as USD 1.00 and EUR 1.00, respectively.
GDP GDPPPP ei,USD ei,∗USD e
∗
i,EUR
(USD) (PPP-USD) (USD−1) (PPP-USD)−1 (EUR−1) CA 52 733.5 42 280.8 CAD 1.00 CAD 1.25 CAD 1.51 NL 49 128.1 46 053.9 EUR 0.78 EUR 0.83 EUR 1.00 US 51 456.7 51 456.7 USD 1.00 USD 1.00 USD 1.20 GB 41 294.5 37 607.9 GBP 0.63 GPD 0.69 GBP 0.83
ments, namely currency, purchasing power, and reference year.
The easiest way of adjusting for different currencies would be to use the exchange rates. However, this does not take into account differences in purchasing power. Considering these, the exchange rates have to be adjusted. To do so, one method, used for example by the World Bank, is to adjust the exchange rate of a currencyi to US dollars (USD),ei,USD,
by correcting it using purchasing power parities (PPP). The World Bank provides both the GDP and the PPP-adjusted GPD (GDPPPP) for the countries of the world (World Bank,
2016). Using these, a correction factorce for the exchange rate can be derived by calculating the ratio of the GDP and the GDPPPP of a country according to ce=GDPPPP/GDP,
leading to an evaluation of how much currencyiis over- or under-rated in comparison to USD. Then the given exchange rateei,USDcan be corrected according toe∗i,USD=ei,USD/ce,
i.e. by dividing it by the correcting factorce. This gives the amount of currency i one has to spend to have the same purchasing power as USD 1.00. To convert the PPP-adjusted exchange rate ei,∗USD into EUR, it is divided by the PPP-adjusted exchange ratee∗EUR,USDfrom EUR into USD, which can be derived as described above. This leads to the result of e∗CAD,EUR=1.51 and eUSD∗ ,EUR=1.20 for 2012, mean-ing that CAD 1.51 and USD 1.20 have the same purchasmean-ing power as EUR 1.00 in the Netherlands in 2012. Using these factors, the cost estimates given in CAD and USD can be converted into EUR.
For the data from Hoozemans et al. (1993) the USD prices of 1993 were adjusted to prices of 2012 first by using im-plicit price deflator values for the GDP of the USA from the US Federal Reserve Bank (Federal Reserve Bank of St. Louis, 2016). The price deflator index is set toD2009=100
for 2009. For 1993 it isD1993=72.244 and for 2012 it is
D2012=105.231. The cost for 2012 is calculated
accord-ing toC2012=(C1993·D2012)/D1993. Then these values were
converted into EUR by dividing them by the PPP-adjusted exchange rateeUSD∗ ,EURof Table 2.
Figure 2.Spread of dike costs and estimated uncertainty. The dike costs are shown together with the linear regressions without intercept, Eq. (1), and with quantiles of estimated log-normal distributions.(a)Canadian dikes and(b)dikes in the Netherlands. The insets show the same items but in double logarithmic scale. The shades give the uncertainty inclosing estimated 95, 85, 75, and 65 % of the values (from light to dark).
values of 2012 by applying the same procedure using price deflators given by the US Federal Reserve Bank of St. Louis (Federal Reserve Bank of St. Louis, 2016). So the costs for 2012 is given byC2012=(C2009·D2012)/D2009, whereC2009
is the cost given by Jonkman et al. (2013) andD2009=99.2
andD2012=101.6.
We also include results for Great Britain by using the di-mensions of the dikes designed in the Canadian study to parameterise the calculation tool developed for the Envi-ronment Agency (Pettit and Robinson, 2012). We entered the dike dimensions and, utilising the 80th percentile of the costs, obtained estimations of the costs when the dikes spec-ified in Delcan Corporation (2012) (Sect. 2.1) were built in Great Britain.
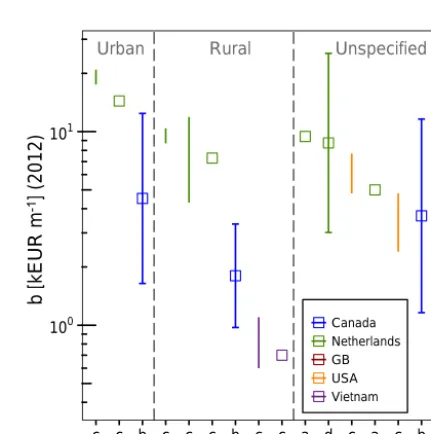
In Fig. 3 we compare the various values reported in the lit-erature with our estimates in terms ofb(the slope) known as unit costs as described above. According to the available in-formation, we separate dikes constructed on urban and rural land and those where land use is not specified. Moreover, we colour-code the five countries for which we have informa-tion, i.e. the Netherlands, Canada, the USA, Vietnam, and Great Britain. Where available, ranges and error bars (for 95 % uncertainty) are plotted. It can be seen that the cost esti-mates by Hoozemans et al. (1993) are not in all cases under-estimates as suggested by Jonkman et al. (2013). They line up quite well within the range of the other cost estimates for the Netherlands of de Grave and Baase (2011) and Jonkman et al. (2013). Further, it can be seen that the influence of land use, i.e. urban/rural, is smaller than the influence of the coun-try where the dike is constructed. Nevertheless, when con-sidering only individual countries there are still differences between land uses (as expected, urban dikes tend to be more expensive). Overall costs of dikes constructed in the
Nether-Urban Rural Unspecified
100 101
c c b c c c b c c a d c a c b e Source
b [
kEUR m
-1] (2012)
Canada Netherlands GB USA Vietnam
lands are the highest, followed by costs for dikes built in the USA, Canada, and Vietnam.
4 Summary and discussion
For both coastal protection projects, i.e. in Canada and the Netherlands, it is sufficient to express the typical costs of dikes per height and length, which is compatible with as-sumptions made in previous publications, e.g. in Jonkman et al. (2013). We offer a rigorous empirical basis for the assumption of constant unit costs (i.e. linear with height, no fixed costs). Moreover, we characterise the deviations of these typical costs with a log-normal distribution assuming the relative deviations are independent of height. This vari-ability captures influences which go beyond the two strongest factors, namely length and height. Although the data from the Netherlands cover mostly dikes, or dike raises, of less than 1 m, while the data from Canada include dikes as high as 7 m, the uncertainty is of similar order of magnitude; i.e. in both cases the multiplication with and division by a fac-tor of 3 includes approximately 95 %. In addition, we did not find statistical signatures of fixed costs or non-linearities for the dikes that we have analysed.
The uncertainty considered here stems from a lack of knowledge, i.e. by studying the costs only as a function of length and height, as we did not have more detailed infor-mation on the local conditions and requirements of the dikes available (although we assume that the authors of the reports did have greater knowledge). Hence, we borrow the concept of cost overruns to characterise the uncertainty of dike con-structions. It is worth noting that erected constructions may be affected by real cost overruns (the original Canadian study included 50 % contingency), which increase both the overall costs and the spread. Thus, in particular with regard to un-certainty, our results are probably only lower estimates. An-other aspect to be considered is that we assume all dikes to have equal probability, i.e. each dot in Fig. 1 is equally likely. However, which dike design and corresponding costs are re-quired depends on the local topography and their likelihood is characteristic of the case study. Moreover, we do not ac-count for any economic shock that would affect the costs, e.g. raw material and fuel costs, labour shocks, shocks affecting imports.
We also want to discuss another aspect that comes into play: when the total costs of an ensemble of dikes are aggre-gated, e.g. according to Ctot=PiliC(hi), where i are the indices of dikes considered. Due to the central limit theorem, the standard deviation decreases with the square root of the sample size. If the costs of the dikes are independent of each other, then one can expect that the relative uncertainty will decrease with the number of dikes. In reality, however, it can be expected that the costs of different dikes are correlated so that the relative uncertainty of the total costs is likely not to
shrink (Prahl et al., 2012, treat spatial correlations in a differ-ent context).
The transfer of our findings and conclusions to other coun-tries needs to be done with caution. Although plausible, we have no proof that the analogous parameters and consequent conclusions hold true in other countries. In particular, it can-not be excluded that fixed costs could represent a significant contribution in countries with weaker tradition in coastal pro-tection or in countries that so far have not been threatened by sea-level rise. Similar arguments could also apply to the unit costs. Further research is necessary to better understand the unit costs so that they can be transferred to other countries and circumstances.
In the context of riverine floods, the lack of good-quality cost estimates has hampered progress in the advance of large-scale flood risk modelling. There is an urgent need for data on the location of dikes as well as their costs and uncertainty (Ward et al., 2015). Given the information of flood manage-ment in place (i.e. existing protection levels), this could be done by automatised identification of the required protection courses (Boettle et al., 2017, 2014), and our method and re-sults could help to estimate the dike costs. Certainly, coastal and riverine dikes have different requirements, in particular regarding wave run-up and duration of floods. However, it is plausible that our main conclusions regarding linear cost function and uncertainty also apply to riverine dikes.
Comparing our estimates with the figures provided in the literature, we find that the costs differ more between the countries than between land uses. Nevertheless, within coun-tries the differences due to land uses are pronounced and, as expected, urban dikes tend to be more costly than rural ones. However, when comparing such cost estimates it is crucial to note which components are actually included in the figures. While in the Canadian report (Delcan Corporation, 2012) all components of the costs are disclosed, in other cases it might not be clear whether, for example, costs of property acqui-sition or project management are included or whether they refer to the pure costs of the physical construction.
To conclude, this study gives decision makers an order of magnitude on the protection costs which can remove poten-tial barriers to designing and implementing adaptation strate-gies in other countries. Future research may focus on the cre-ation of a “best practice” approach to understand how po-tential impacts are accounted for and to deliver to decision makers ways in which climate adaptation options such as sea dikes can be understood and measured, in terms of both in-vestment needed economically and in reducing risks of flood-ing and reduced damage costs.
Appendix A: Explicit cost estimates A1 Canada
The total costs (from Table 4.2 in Delcan Corporation, 2012) consist of the following:
1. Structural flood protection/embankment consists of 9 % of total costs. For a dike of length l, footprint f, and heighth, the following components are included, while “∼” represents proportionality.
a. Site preparation: clearing and removal of topsoil (costs/ l∼ht, wheretis the thickness of the layer) with an estimated unit cost of CAD 15 m−3. b. Core material: supplying and installing the dike
ma-terial (costs/ l∼f h, approximately costs/ l∼h2) with an estimated unit cost of CAD 40 m−3. c. Rip-rap: stone protection for the water side of the
dike (costs/ l∼ht, wheret is the thickness of the layer) with an estimated unit cost of CAD 50 m−3. d. Surface restoration: construction of a typical
as-phalt road in case there is already a road at the site; this applies to 5/36 reaches (costs/ l∼f ∼h, as-suming surface∼lf) with an estimated unit cost of CAD 100 m−2.
2. Utility relocation, pump stations, and flood boxes con-sist of 4 % of total costs.
a. It was assumed that dike construction will include 25 % extra in urban areas and 5 % for rural areas for utility relocation.
b. Upgrades of existing pump stations apply to 16/36 reaches, with an estimated unit cost of CAD 2.5 million.
c. Adjustment of drainage behind the dike and small pump station installation applies to 18/36 reaches, with an estimated unit cost of CAD 0.5 million. 3. Property acquisition consists of 17 % of total costs. The
area of property to be acquired is determined by the footprint, i.e. costs/ l∼f, approximately costs/ l∼h. Full purchase costs have been included, i.e. as derived from previous constructions. Residential property has double the value of commercial/industrial property and commercial/industrial property has 5 times the value of agricultural property.
a. Agricultural: 3 % of total costs, 9/36 reaches, 86 % of total area, estimated unit cost of CAD 22 m−2; b. Residential: 6 % of total costs, 7/36 reaches, 4 % of
total area, estimated unit cost of CAD 850 m−2;
c. Commercial/industrial: 8 % of total costs, 11/36 reaches, 11 % of total area, estimated unit cost of CAD 400 m−2.
4. Seismic resilience (vibro-replacement, deep soil mix-ing, toe berm) consists of 34 % of total costs.
Because the Vancouver area is seismically active, it is necessary to make dikes seismically resilient. De-pending on the soil profile at the dike location vibro-replacement, deep soil mixing or installing a toe berm is necessary.
a. Vibro-replacement: 10/36 reaches, with an esti-mated unit cost of CAD 22 m−2;
b. Deep soil mixing: 3/36 reaches, with an estimated unit cost of CAD 250 m−2;
c. Toe berm: 10/36 reaches.
5. Environmental compensation consists of 1 % of total costs and 4/36 reaches, with an estimated unit cost of CAD 250 m−2.
6. Site investigation, project management, and engineering (15 % on top of previous items) consist of 2 % of total costs.
7. Contingency (50 % on top of all previous items) consists of 33 % of total costs.
Prior to beginning the analysis, we perform a few steps: – exclude the following reaches: nos. 4 (floodwall), 5
(flood proofing, no information), 10 (barrier), 16 (dou-ble dike), 17 (flood proofing, no information), 23 (re-treat), 27 (barrier), 28 (flood proofing, no information); – disregard deep soil mixing of reaches 7, 8, and 22; and – disregard 50 % contingency on top of the total costs. This leads to a total of 28 reaches being analysed. A2 Netherlands
The dike raising costs of the Dutch study are based on a sys-tem of cost functions. To obtain the cost function for one dike reach there are eight calculation steps taken into account:
1. Identify the needed dike height raising by modelling the hydraulic strain for a given dike height and return level interval.
2. Process the information about the current and the re-quired dike profile to determine the needed ground and construction measures. This step takes into account:
a. the dike height of the initial situation,
b. the benching height of the initial situation if there is benching on the land side,
d. the required raising of the base body of the dike (corresponding to the required raising of the dike crest including an additional raising for settling and compaction),
e. broadening of the dike base for increasing macrostability, and
f. broadening of the dike base for piping.
3. Determine the range of ground and construction mea-sures according to a four step expulsion list with the following combinations of measures:
M1 complete solution with exclusively ground mea-sures,
M2 raising and fortification of the dike body with a combination of ground measures and one construc-tion measure on the dike toes on the land side, M3 dike raising in the ground and steepening of the
(in-side) embankment on one side in combination with one construction measure within the dike body, and M4 dike raising in the ground and steepening of both dike embankments in combination with a coffer-dam construction within the dike body.
According to the selected combination of measures, the new dike profile, the type and extent of the required con-struction measures, the additional footprint of the dike, the direct ground work and construction costs per unit of length, the length of the dike section to which the measures are applied, the total construction costs, and the additional costs for administration and maintenance are calculated.
4. Calculate the costs needed for dike reaches with special conditions. These special conditions consist of the con-struction of a cofferdam. The costs for this is estimated using both the horizontal and vertical length, the height and a standard cost function.
5. Estimate the costs needed for the adjustment of infras-tructure. This applies if there is an existing road or other type of traffic infrastructure which has to be reallocated. This also applies if there are crossroads or railways lo-cated above the dike which interfere with the raising of the dike. This may require the construction of a new dike section.
6. Identify costs for purchase of land. To estimate this kind of costs there are four cases which are being differenti-ated, namely built-up area, non built-up area, urban, and rural. For the two categories built-up and urban the land acquisition costs are considered to be high and for non built-up and rural comparatively low.
7. Determine costs for countryside and environment com-pensation measures. If a dike reach crosses a nature re-serve or an area of special scenic importance, it is nec-essary to acquire land create appropriate compensation measures.
8. Estimate the volume of the total investment costs and additional annual costs for administration and mainte-nance. The total investment costs are formed by sum-ming up the costs (including their administration and maintenance costs) of the previous seven steps. Based on this, the total administration and maintenance costs are defined as percentage of the total investment costs.
Appendix B: Overview of cost estimates
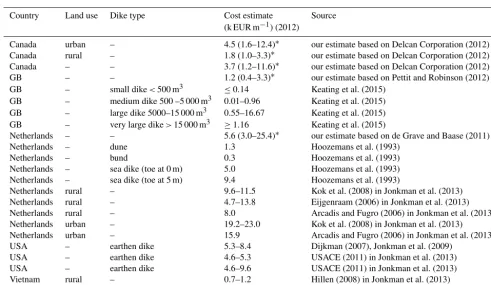
Table B1.Comparison of different cost estimations for raising a dike of length 1 km for a height of 1 m for different land uses and differ-ent dike types. Land use and dike types are labelled here when available. All values have been converted into 2012 Euros to make them comparable. See also Figure 3 in the main text.
Country Land use Dike type Cost estimate Source
(k EUR m−1) (2012)
Canada urban – 4.5 (1.6–12.4)∗ our estimate based on Delcan Corporation (2012)
Canada rural – 1.8 (1.0–3.3)∗ our estimate based on Delcan Corporation (2012)
Canada – – 3.7 (1.2–11.6)∗ our estimate based on Delcan Corporation (2012)
GB – – 1.2 (0.4–3.3)∗ our estimate based on Pettit and Robinson (2012)
GB – small dike<500 m3 ≤0.14 Keating et al. (2015)
GB – medium dike 500 –5 000 m3 0.01–0.96 Keating et al. (2015)
GB – large dike 5000–15 000 m3 0.55–16.67 Keating et al. (2015)
GB – very large dike>15 000 m3 ≥1.16 Keating et al. (2015)
Netherlands – – 5.6 (3.0–25.4)∗ our estimate based on de Grave and Baase (2011)
Netherlands – dune 1.3 Hoozemans et al. (1993)
Netherlands – bund 0.3 Hoozemans et al. (1993)
Netherlands – sea dike (toe at 0 m) 5.0 Hoozemans et al. (1993)
Netherlands – sea dike (toe at 5 m) 9.4 Hoozemans et al. (1993)
Netherlands rural – 9.6–11.5 Kok et al. (2008) in Jonkman et al. (2013)
Netherlands rural – 4.7–13.8 Eijgenraam (2006) in Jonkman et al. (2013)
Netherlands rural – 8.0 Arcadis and Fugro (2006) in Jonkman et al. (2013)
Netherlands urban – 19.2–23.0 Kok et al. (2008) in Jonkman et al. (2013)
Netherlands urban – 15.9 Arcadis and Fugro (2006) in Jonkman et al. (2013)
USA – earthen dike 5.3–8.4 Dijkman (2007), Jonkman et al. (2009)
USA – earthen dike 4.6–5.3 USACE (2011) in Jonkman et al. (2013)
USA – earthen dike 4.6–9.6 USACE (2011) in Jonkman et al. (2013)
Vietnam rural – 0.7–1.2 Hillen (2008) in Jonkman et al. (2013)
Vietnam rural – 0.8 Mai et al. (2008) in Jonkman et al. (2013)
Competing interests. The authors declare that they have no conflict of interest.
Acknowledgements. We thank H. Costa, G. Floater, R. J. Meijer, and Boris F. Prahl for useful discussions, M. Olonscheck for her translation skills, and C. J. Hewett for help with the manuscript. The research leading to these results has received funding from the European Community’s Seventh Framework Programme under grant agreement no. 308497 (Project RAMSES). The publication of this article was funded by the Open Access Fund of the Leibniz Association.
Edited by: B. Merz
Reviewed by: two anonymous referees
References
Aerts, J. C. J. H., Botzen, W. J. W., Moel, H. d., and Bowman, M.: Cost estimates for flood resilience and protection strate-gies in New York City, Ann. NY Acad. Sci., 1294, 1–104, doi:10.1111/nyas.12200, 2013.
Akaike, H.: A new look at the statistical model
identi-fication, IEEE T. Automat. Contr., AC–19, 716–723,
doi:10.1109/TAC.1974.1100705, 1974.
Arcadis and Fugro: Kostenfuncties Dijkringgebieden 7, 14, en 29, Report, Ministry of Transport, Public Works and Water Manage-ment, Amersfoort, Netherlands, in Dutch, 2006.
BCIS: Elemental Standard Form of Cost Analysis, Royal Insti-tuttion of Chartered Surveyors, London, 4th Edn., available at: http://www.rics.org/Global/BCIS_Elemental_Standard_Form_ of_Cost_Analysis_4th__NRM__Edition_2012.pdf (last access: 7 May 2017), 2012.
Boettle, M., Rybski, D., and Kropp, J. P.: How changing sea level extremes and protection measures alter coastal flood damages, Water Resour. Res., 49, 1199–1210, doi:10.1002/wrcr.20108, 2013a.
Boettle, M., Rybski, D., and Kropp, J. P.: Adaptation to Sea Level Rise: Calculating Costs and Benefits for the Case Study Kalund-borg, Denmark, in: Climate Change Adaptation in Practice, edited by: Schmidt-Thomé, P. and Klein, J., Wiley-Blackwell, Chichester, UK, chap. 3, 25–34, 2013b.
Boettle, M., Costa, L., Kriewald, S., Kropp, J. P., Prahl, B. F., and Rybski, D.: Development of a library of impact func-tions and general uncertainty measures (Deliverable 1.2), Tech. rep., RAMSES project: Reconciling Adaptation, Miti-gation and Sustainable Development for Cities, available at: http://www.ramses-cities.eu/fileadmin/uploads/Deliverables_ Uploaded/Development_of_a_library_of_impact_functions_ and_general_uncertainty_measures_D1.2.pdf (last access: 7 May 2017), 2014.
Boettle, M., Rybski, D., and Kropp, J. P.: Quantifying the effect of sea level rise and flood defence – a point process perspective on coastal flood damage, Nat. Hazards Earth Syst. Sci., 16, 559– 576, doi:10.5194/nhess-16-559-2016, 2016.
Prahl, B. F., Boettle, M., Costa, L., Kropp, J. P., and Rybski, D.: Damage and protection cost curves for coastal floods in the largest European cities, in preparation, 2017.
Bouwer, L. M.: Projections of Future Extreme Weather Losses Un-der Changes in Climate and Exposure, Risk. Anal., 33, 915–930, doi:10.1111/j.1539-6924.2012.01880.x, 2013.
Chou, J.-S., Yang, I.-T., and Chong, W. K.: Probabilistic simulation for developing likelihood distribution of
en-gineering project cost, Automat. Constr., 18, 570–577,
doi:10.1016/j.autcon.2008.12.001, 2009.
Dawson, R. and Hall, J.: Adaptive importance sampling for risk analysis of complex infrastructure systems, P. Roy. Soc. A – Math. Phy., 462, 3343–3362, doi:10.1098/rspa.2006.1720, 2006. Dawson, R. J., Dickson, M. E., Nicholls, R. J., Hall, J. W., Walk-den, M. J. A., Stansby, P. K., Mokrech, M., Richards, J., Zhou, J., Milligan, J., Jordan, A., Pearson, S., Rees, J., Bates, P. D., Kouk-oulas, S., and Watkinson, A. R.: Integrated analysis of risks of coastal flooding and cliff erosion under scenarios of long term change, Climatic Change, 95, 249–288, doi:10.1007/s10584-008-9532-8, 2009.
Dawson, R. J., Ball, T., Werritty, J., Werritty, A., Hall, J. W., and Roche, N.: Assessing the effectiveness of non-structural flood management measures in the Thames Estuary under condi-tions of socio-economic and environmental change, Global Envi-ron. Chang., 21, 628–646, doi:10.1016/j.gloenvcha.2011.01.013, 2011.
de Grave, P. and Baase, G.: Kosten van maatregelen, technical re-port, Deltares, Delft, Netherlands, 2011.
Delcan Corporation: Cost of Adaptation – Sea Dikes & Alternative Strategies, FINAL REPORT EB3762, British Columbia Ministry of Forests, Lands and Natural Resource Operations, Vancouver, available at: http://www.env.gov.bc.ca/wsd/public_safety/flood/ pdfs_word/cost_of_adaptation-final_report_oct2012.pdf (last access: 7 May 2017), 2012.
Diaz, D. B.: Estimating global damages from sea level rise with the Coastal Impact and Adaptation Model (CIAM), Climatic Change, 137, 143–156, doi:10.1007/s10584-016-1675-4, 2016. Dijkman, J.: A Dutch Perspective on Coastal Louisiana Flood Risk
Reduction and Landscape Stabilization, Report WL-Z4307 pre-pared for the United States Army European Research Office, Netherlands Water Partnership, Delft, Netherlands, 2007. Dronkers, J., Gilbert, J. T. E., Butler, L., Carey, J. J., Campbell,
J., James, E., McKenzie, C., Misdorp, R., Quin, N. Ries, K. L., Schroder, P. C., Spradley, J. R., Titus, J. G., Val-lianos, L., and von Dadelszen, J.: Strategies for Adaption to Sea Level Rise, Report, IPCC Coastal Zone
Man-agement Subgroup: Intergovernmental Panel on Climate
Change, Geneva, available at: http://papers.risingsea.net/ IPCC-1990-Strategies-for-Adaption-to-Sea-Level-Rise.html (last access: 7 May 2017), 1990.
Eijgenraam, C., Kind, J., Bak, C., Brekelmans, R., den Hertog, D., Duits, M., Roos, K., Vermeer, P., and Kuijken, W.: Economically Efficient Standards to Protect the Netherlands Against Flooding, Interfaces, 44, 7–21, doi:10.1287/inte.2013.0721, 2014. Eijgenraam, C. J. J.: Optimal safety standards for dike-ring areas,
Discussion paper, CPB Netherlands Bureau for Economic Policy Analysis, Den Haag, Netherlands, 2006.
Fankhauser, S.: Protection versus retreat: the economic costs of sea-level rise, Environ. Plann. A, 27, 299–319, doi:10.1068/a270299, 1995.
Federal Reserve Bank of St. Louis: Gross Domestic Product: Im-plicit Price Deflator, available at: https://research.stlouisfed.org/ fred2/series/GDPDEF, last access: 1 March 2016.
Flyvbjerg, B.: Policy and Planning for Large-Infrastructure Projects: Problems, Causes, Cures, Environ. Plann. B, 34, 578– 597, doi:10.1068/b32111, 2007a.
Flyvbjerg, B.: Cost Overruns and Demand Shortfalls in Urban Rail and Other Infrastructure, Transport. Plan. Techn., 30, 9–30, doi:10.1080/03081060701207938, 2007b.
Flyvbjerg, B. and Stewart, A.: Olympic Proportions: Cost and Cost Overrun at the Olympics 1960–2012, Working pa-per, Saïd Business School – University of Oxford, Oxford, doi:10.2139/ssrn.2238053, 2012.
Hallegatte, S., Green, C., Nicholls, R. J., and Corfee-Morlot, J.: Fu-ture flood losses in major coastal cities, NaFu-ture Climate Change, 3, 802–806, doi:10.1038/nclimate1979, 2013.
Heidrich, O., Dawson, R. J., Reckien, D., and Walsh, C. L.: Assess-ment of the climate preparedness of 30 urban areas in the UK, Climatic Change, 120, 771–784, doi:10.1007/s10584-013-0846-9, 2013.
Heidrich, O., Reckien, D., Olazabal, M., Foley, A., Salvia, M., Gre-gorio Hurtado, S. d., Orru, H., Flacke, J., Geneletti, D., Pietrap-ertosa, F., Hamann, J. J.-P., Tiwary, A., Feliu, E., and Daw-son, R. J.: National climate policies across Europe and their impacts on cities strategies, J. Environ. Manage., 168, 36–45, doi:10.1016/j.jenvman.2015.11.043, 2016.
Hillen, M. M.: Safety Standards Project, Risk Analysis for New Sea Dike Design Guidelines in Vietnam, technical report, Delft Uni-versity of Technology, Hanoi Water Ressources UniUni-versity, 2008. Hinkel, J., Lincke, D., Vafeidis, A. T., Perrette, M., Nicholls, R. J., Tol, R. S. J., Marzeion, B., Fettweis, X., Ionescu, C., and Lever-mann, A.: Coastal flood damage and adaptation costs under 21st century sea-level rise, P. Natl. Acad. Sci. USA, 111, 3292–3297, doi:10.1073/pnas.1222469111, 2014.
Hoozemans, F. M. J., Marchand, M., and Pennekamp, H. A.: A Global Vulnerability Analysis: Vulnerability Assessment for Population, Coastal Wetlands and Rice Production on a Global Scale, Delft Hydraulics, Delft, the Netherlands, 1993.
Hudson, T., Keating, K., and Pettit, A.: Cost estimation for coastal protection – summary of evidence, Report SC080039/R7, Environment Agency, Bristol, available at: https: //www.gov.uk/government/uploads/system/uploads/attachment_ data/file/411178/Cost_estimation_for_coastal_protection.pdf (last access: 7 May 2017), 2015.
Jongmann, B., Hochrainer-Stigler, S., Feyen, L., Aerts, J. C. J. H., Mechler, R., Botzen, W. J. W., Bouwer, L. M., Pflug, G., Ro-jas, R., and Ward, P. J.: Increasing stress on disaster-risk fi-nance due to large floods, Nature Climate Change, 4, 264–268, doi:10.1038/NCLIMATE2124, 2014.
Jonkman, S. N., Brinkhuis-Jak, M., and Kok, M.: Cost benefit anal-ysis and flood damage mitigation in the Netherlands, Heron, 49, 95–111, 2004.
Jonkman, S. N., Maskaant, B., Boyd, E., and Levitan, M. L.: Loss of life caused by the flooding of New Orleans after hurricane Katrina: analysis of the relationship between flood
characteris-tics and mortality, Risk. Anal., 5, 676–698, doi:10.1111/j.1539-6924.2008.01190.x, 2009.
Jonkman, S. N., Hillen, M. M., Nicholls, R. J., Kanning, W., and van Ledden, M.: Costs of Adapting Coastal Defences to Sea-Level Rise– New Estimates and Their Implications, J. Coastal Res., 29, 1212–1226, doi:10.2112/JCOASTRES-D-12-00230.1, 2013. Keating, K., Pettit, A., and Wood, A.: Cost estimation for fluvial
defences – summary of evidence, Research Contractor Report SC080039/R2, Environment Agency, Bristol, UK, available at: https://www.gov.uk/government/uploads/system/uploads/ attachment_data/file/411171/Cost_estimation_for_fluvial_ defences.pdf (last access: 7 May 2017), jBA Consulting, 2015. Kind, J. M.: Economically efficient flood protection standards
for the Netherlands, J. Flood Risk Management, 7, 103–117, doi:10.1111/jfr3.12026, 2014.
Klijn, F., Knoop, J. M., Ligtvoet, W., and Mens, M. J. P.: In search of robust flood risk management alternatives for the Netherlands, Nat. Hazards Earth Syst. Sci., 12, 1469–1479, doi:10.5194/nhess-12-1469-2012, 2012.
Kok, M., Jonkman, S., Kanning, W., Stijnen, J., and Rijcken, T.: Toekomst voor het Nederlandse polderconcept, Annex to “Work-ing Together with Water”, Delta Comittee, Den Haag, Nether-lands, in Dutch, 2008.
Kreibich, H., van den Berg, J. C. J. M., Bouwer, L. M., Bubeck, P., Ciavola, P., Green, C., Hallegatte, S., Logar, I., Meyer, V., Schwarze, R., and Thieken, A. H.: Costing Natural Hazards, Nature Climate Change, 4, 303–306, doi:10.1038/nclimate2182, 2014.
Linham, M. M., Green, C. H., and Nicholls, R. J.: Costs of adaptation to the effects of climate change in the
world’s large port cities, Report AV/WS2/D1/R14,
AVOID: Avoiding dangerous climate change, available at: http://www.avoid.uk.net/2010/07/avoid-1-costs-of-adaptation-to-the-effects-of-climate-change-in-the-worlds-large-port-cities/ (last access: 7 May 2017), work stream 2, 2010.
Love, P. E. D., Wang, X., Sing, C.-P., and Tiong, R. L. K.: De-termining the Probability of Project Cost Overruns, J. Con-str. Eng. Manage., 139, 321–330, doi:10.1061/(ASCE)CO.1943-7862.0000575, 2013.
MacDonald, M.: CESMM4 Carbon & Price Book 2013, ICE Pub-lishing, London, doi:10.1680/ccpb2013.58125, 2013.
Mai, C. V., van Gelder, P. H. A. J. M., Vrijling, J. K., and Mai, T. C.: Risk analysis of coastal flood defences: a Vietnam case, in: Proceedings of the 4th International Symposium on Flood De-fence (Toronto, Canada, Institute for Catastrophic Loss Reduc-tion), 931–938, 2008.
Marquardt, D. W.: An Algorithm for Least-Squares Estimations of Nonlinear Parameters, J. Soc. Ind. Appl. Math., 11, 431–441, 1963.
Menéndez, M. and Woodworth, P. L.: Changes in extreme high wa-ter levels based on a quasi-global tide-gauge data set, J. Geophys. Res., 115, C10011, doi:10.1029/2009JC005997, 2010.
Pettit, A. and Robinson, P.: Supporting Spreadsheet for the Long Term Costing Project, in: Flood and Coastal Erosion Risk Man-agement Research and Development Programme, JBA Consult-ing and Environment Agency (EA), Environment Agency (EA), Bristol, UK, 2012.
to German winter storms, Geophys. Res. Lett., 39, L06806, doi:10.1029/2012GL050961, 2012.
Prahl, B. F., Rybski, D., Boettle, M., and Kropp, J. P.: Dam-age functions for climate-related hazards: unification and uncer-tainty analysis, Nat. Hazards Earth Syst. Sci., 16, 1189–1203, doi:10.5194/nhess-16-1189-2016, 2016.
Public Works and Government Services Canada: Cost estima-tion definitions, available at: http://www.tpsgc-pwgsc.gc. ca/biens-property/sngp-npms/bi-rp/conn-know/couts-cost/ definition-eng.html (last access: 18 January 2016), last modified 2 March 2015.
Reckien, D., Flacke, J., Olazabal, M., and Heidrich, O.: The Influ-ence of Drivers and Barriers on Urban Adaptation and Mitigation Plans–An Empirical Analysis of European Cities, PLoS One, 10, 1–21, doi:10.1371/journal.pone.0135597, 2015.
USACE: Louisina Coastal Protection and Restoration (LAPCR), final technical report, US Army Corp of Engineers, available at: http://www.mvn.usace.army.mil/Portals/56/docs/environmental/ LaCPR/LACPRFinalTechnicalReportJune2009.pdf (last access: 21 May 2017), 2011.
Vousdoukas, M. I., Voukouvalas, E., Mentaschi, L., Dottori, F., Gia-rdino, A., Bouziotas, D., Bianchi, A., Salamon, P., and Feyen, L.: Developments in large-scale coastal flood hazard mapping, Nat. Hazards Earth Syst. Sci., 16, 1841–1853, doi:10.5194/nhess-16-1841-2016, 2016.
Ward, P. J., Jongman, B., Salamon, P., Simpson, A., Bates, P., De Groeve, T., Muis, S., de Perez, E. C., Rudari, R., Trigg, M. A., and Winsemius, H. C.: Usefulness and limitations of global flood risk models, Nature Climate Change, 5, 712–715, doi:10.1038/nclimate2742, 2015.