Study of Fluorescent Dyeing Process and Influence of
Mixture Dyes on High-visibility
Mohamed Hamdaoui, PhD, Ahlem Lanouar, Sabri Halaoua, PhD
Ecole Nationale d'Ingénieurs de Monastir, Université de Monastir, Monastir TUNISIA
Correspondence to:
Mohamed Hamdaoui email: [email protected]
ABSTRACT
In this paper, we present the results of an investigation and analysis of an experimental study of fluorescent disperse dyes used for dyeing polyester fabrics to high-visibility colors. This paper describes the results of spectrophotometric color measurements for yellow luminous, red luminous and orange luminous fluorescent dyes and their matching with the requirements of the EN 471 standard. The results of this study showed that the adsorption isotherms of polyester dyeing with fluorescent disperse luminous dyes follow the Nernst equation; the Nernst constants were determined and interpreted. The adsorption kinetics of fluorescent disperse dyes on polyester is studied by using the peudo-first-order model, the pseudo-second-order equation and the intraparticle diffusion equation. The results show that pseudo-second-order models fit well the experimental data with higher average regression coefficients (R²>0.98). They also show that high-visibility is influenced by the dye concentration, and that the dye mixtures can affect the high-visibility.
INTRODUCTION
The application of fluorescent dyes involves various fields. Recently, the application of fluorescent dyes in biochemical investigations and medical diagnoses [1,2] has known a great development. Fluorescent dyes have also been used in the construction of lasers, photoelectric cells, and solar batteries. For example, fluorescein class dyes are commercially available and used as coloring additives in food, cosmetics, and drugs [3,4].
For safety uses in other fields, American Tire has patents pending relating to the production of bicycle tyres that are available in a yellow florescent that can be seen at night by headlights from a distance of about feet [5]. Also, the fluorescent dyes were used in
But fluorescent dyes have long been used mainly for the dyeing of flat materials, especially textiles. The use of fluorescent dyes causes a significant increase in color brightness, which makes the dyed materials more easily perceptible, or more accurately visible. Indeed, fluorescent dyes are considered to be those dyes which absorb and emit radiation in the visible spectral range light and causes fluorescence. These dyes are defined as a group of organic dyestuffs which, when applied to a textile material, give rise to fluorescence under UV radiation and in daylight.
In the textile field, the main use of fluorescent dyes is in the coloration of synthetic fibers, especially polyester [6], polyamide and acrylics in conjunction with elastane fibers, for fashion, leisure, sportswear uses and especially for safety.
In industry, many textile materials are dyed with mixtures of dyes to achieve the exact reproducibility of the required color. The use of two or three fluorescent dyes with non-identical properties can affect the sorption of the dye and the high visibility.
In this paper, we studied the adsorption mechanism of the fluorescent disperse dyes on polyester fabrics from an aqueous solution and analyzed the experimental data to determine the adsorption isotherms equation and kinetic models. Finally, the influence of mixture dyes on the high visibility and fluorescence of the polyester fabrics was determined and analyzed.
MATERIALS AND METHODS
TABLE I.Dyes characteristics and measured wavelengths when the absorbance attains maxima.
N° Commercial Name Category λmax (nm)
1 Yellow Luminous Disperse dye 430
2 Red Luminous Disperse dye 564
3 Orange Luminous Disperse dye 484
Prior to dyeing, all polyester fabrics were prepared at 60°C for 30 min in a solution containing 1g /L detergent and 0.5 g/L sodium carbonate. Then, the fabric was rinsed at 40°C for 10 minutes. Finally, the sample was dried 120°C for 1 minute using a Mathis KTF-S continuous dryer.
The dyeing procedures were carried out according to the manufacturer’s instructions outlined in Figure 1, with the amounts of dispersing agent and acetic acid as shown in Table II. The dyeing processes were achieved in a laboratory apparatus (AHIBA Nuance speed, DataColor), with a liquor-to-fiber ratio of 10:1.
Time (min) Temperature (°C)
B C
B
90 70
50 5 min
5 min 5 min
A
FIGURE 1. Dyeing procedure.
TABLE II. Amount of Materials used for dyeing.
Step Materials Concentration
A Dispersing agent
Disperse dye Acetic acid
0.5 g/L y% 5 g/L B Water to rinse the fabric 10:1
C sodium carbonate
Sodium dithionite Dispersing agent
2 g/L 2 g/L 0.5 g/L
To study high-visibility colors, we used the basic parameter in accordance with the standard NF EN471; the color is characterized by the chromaticity co-ordinates x and y which determine the chroma saturation and hue, and the luminance factor (determining luminosity)β=Y/Y0, where Y0 = 100 is the three-chromatic co-ordinate for a perfect reflecting diffuser, and Y the co-ordinate for the color tested.
Textile materials are fluorescent when the chromaticity co-ordinates x and y are included within the boundaries of the area determined by the standard NF EN471, and the luminance factor was equal to or greater than the value given by the standard NF EN471. These parameters were determined on the dyed sample by using the DATACOLOR Spectrocolorimeter. The luminous factor and the chromaticity co-ordinates x and y were determined by the standard NF EN471 of the dyes used in this study and presented in Table III.
In this part of the study, nine dye mixtures were prepared in various concentration ratios as shown in
TABLE III.Luminous factor and the chromaticity co-ordinates x and y as determined by the standard NF EN471 of the dyes used in study.
Dye X Y
Minimum value of luminous factor 0
m Y/Y
β =
Luminous Yellow
0.387 0.356 0.398 0.460
0.610 0.494 0.452 0.540
0.7
Luminous Red
0.655 0.570 0.595 0.690
0.345 0.340 0.315 0.310
0.25
Luminous Orange
0.610 0.535 0.570 0.655
0.390 0.375 0.340 0.345
0.4
TABLE IV. Composition of the mixtures dye solutions prepared to study the high-visibility.
Composition of the dyes mixtures (g/L)
Sample designation Luminous Yellow Luminous Red Luminous Orange
RY 0.1 0.4 0
YR 0.4 0.1 0
RO 0 0.4 0.1
OR 0 0.1 0.4
YO 0.4 0 0.1
OY 0.1 0 0.4
Y(RO) 0.3 0.1 0.1
R(YO) 0.1 0.3 0.1
O(YR) 0.1 0.1 0.3
CHARACTERIZATION OF THE DYEING SYSTEM
Adsorption Equilibrium Study
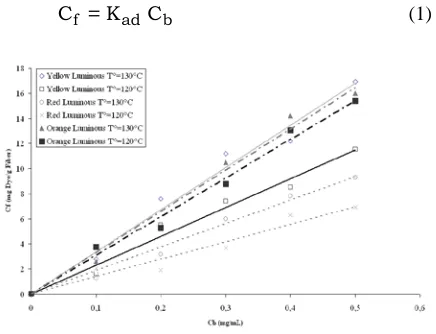
Adsorption isotherms, which are the presentation of the amount of solute adsorbed per unit of the adsorbent, as a function of the equilibrium concentration at constant temperature, were studied. In order to evaluate the time necessary for reaching the equilibrium for each fluorescent disperse dye and dyeing temperature, a series of preliminary experiments were carried out at two temperatures of 120°C and 130°C. The initial dyebath concentrations of the studied dye varied from 0.1 g/L to 0.5 g/L. After dyeing each solution, the equilibrium concentration (Ct) was determined by means of the calibration curve and measurement of the absorbance using the BIOCHROM spectrophotometer. Then, by subtracting the equilibrium concentration from the initial concentration, the adsorbed dyestuff concentration was calculated. This value was converted into mg of dye per g of polyester fiber. The obtained isotherms are plotted in Figure 2.
the dye, and the slope of the isotherm is equal to K. So, the adsorption isotherms of polyester dyeing with the fluorescent disperse luminous dyes follow the Nernst equation. The Nernst model is given in the following equation:
b ad
f K C
C =
(1)
Table V shows the results of the Nernst isotherm, indicating the reasonably good correlation between the experimental data and Nernst model for the yellow, red and orange fluorescent disperse dyes at both temperatures of 120 °C and 130 °C, as reflected by correlation coefficients (R²) (nearer to 1). For all dyes (yellow, red and orange), the Nernst adsorption constant (Kad) increased as the temperature was increased, suggesting that the adsorption of fluorescent luminous disperse dyes used in this study onto polyester fabrics was controlled by an exothermic process.
TABLE V. Parameter values from fitting the adsorption equilibrium data with isotherm Nernst model.
Dye Temperature Kad (mL/g) R²
Yellow 130°C
120°C
33.648 23.005
0.9803 0.9789
Red 130°C
120°C
18.776 13.933
0.9858 0.9458
Orange 130°C
120°C 32.964 30.893 0.9806 0.9884 Kinetics Study
In order to study the mechanism of the adsorption of the fluorescent dye on polyester fabric, kinetic models were used to test experimental data. These kinetic models included the pseudo-first order equation [7,8], the pseudo-second order equation [8,9] and the Intra-particle diffusion model [10,11].
Pseudo-First Order Model
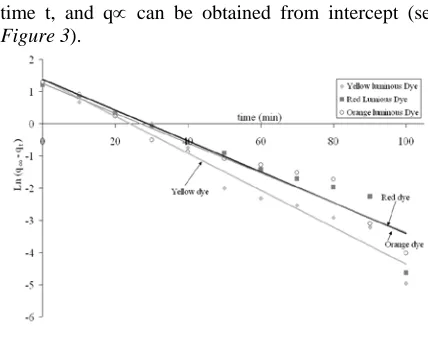
The pseudo-first order equation of Lagergren [7,8] is generally expressed as follows:
) q -(q dt dq t t ∞ 1 K = (2) Where: ∞
q and qt are, respectively, the sorption capacity at equilibrium and at time t (mg g-1), and K1 is the rate constant of the pseudo-first order sorption (min-1).
Integrating equation (2) with respect to boundary conditions t=0 to t=t and qt=0 to qt=qt. the integrated form of the equation becomes:
t K - ) (q Ln ) q -(q
Ln ∞ t = ∞ 1 (3)
So, the first order rate constant K1 can be obtained from the slope of plot between Ln(q∞-qt) versus time t, and q∝ can be obtained from intercept (see
Figure 3).
FIGURE 3. Pseudo-first-order kinetics of fluorescent dyes tested (C0 = 400 mg/L).
Pseudo-Second Order Model
The pseudo-second-order model [8,9] is represented by:
2 ∞ 2(q - qt) K
dt dqt =
(4)
Separating the variables gives:
dt K dqt 2 2 ∞ = ) q - q
( t (5)
By integrating the Eq. (5) with respect to boundary conditions t=0 to t=t and qt=0 to qt=qt, the form of the equation becomes the one that has a linear form:
∞ ∞ 2q q
1
q 2
t
t K
t = +
(6)
The plot of
q
t
versus t of equation (10) should give a
FIGURE 4. Pseudo-second-order kinetics of fluorescent dyes tested (C0 = 400 mg/L)
Intra-Particle Diffusion Model
To describe the mass transfer of intra-particle diffusion, Weber-Morris found that in many adsorption cases, the solute uptake varies almost proportionally with t1/2 rather than with the contact time t [10,11]:
1/2 int
t t
q =K
(7)
where:
Kint (mg g-1 min-0.5) is the intra-particle diffusion rate constant of the plot between qt versus time t1/2 (Figure
5).
In all cases of models, the amount of dye adsorbed per gram of cotton (mg/g cotton) at any time (qt) was calculated as follows:
W V ) C -(C
qt= 0 t (8)
where:
C0 is the initial dye concentration (mg/L) and Ct is the dye concentration after dyeing time t (mg/L), V is the volume of dye solution (L) and W is the weight of the polyester fabric (g) used.
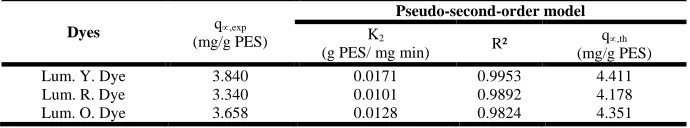
As has been shown in Table VI(a) and Table VI(b), the correlation coefficients for the pseudo-second-order kinetic model (R²>0.98 for all dyes tested) were higher than those for the pseudo-first-order kinetic model. These results imply that the adsorption system studied (fluorescent disperse luminous dye / polyester fabrics) obeys to the pseudo-second-order kinetic model.
TABLE VI(a).Kinetic parameters for Fluorescent disperse dyes adsorption on polyester fabrics (first-order model).
Dyes q∝,exp
(mg/g PES)
Pseudo-first-order model
K1 (min-1) R² q∝,th
(mg/g PES)
Lum. Y. Dye 3.840 0.0574 0.9665 3.969
Lum. R. Dye 3.340 0.0478 0.9162 3.934
Lum. O. Dye 3.658 0.0463 0.9404 3,493
TABLE VI(b). Kinetic parameters for Fluorescent disperse dyes adsorption on polyester fabrics (second-order model).
Dyes q∝,exp
(mg/g PES)
Pseudo-second-order model
K2
(g PES/ mg min) R²
q∝,th
(mg/g PES)
Lum. Y. Dye 3.840 0.0171 0.9953 4.411
Lum. R. Dye 3.340 0.0101 0.9892 4.178
FIGURE 5. Intra-particle diffusion model of fluorescent dyes tested (C0 = 400 mg/L).
As shown from the experimental data presented in
Figure 5, the plots present multi-linearity, indicating that two steps were taking place. Similar behavior has also been reported in the literature [12, 13].
As shown in Figure 5, an initial linear portion (from 0 to ≈50min) followed by a second one (after 50 min). The initial linear portion is the gradual adsorption stage, where the intra-particle diffusion is rate-controlled (Kint1>0.4242 min-1 for dyes tested). The second portion is the final equilibrium stage where the intra-particle diffusion slows down (Kint2 = 0.0413 min-1 for the yellow dye). Also, the results presented in Table VII indicate that the intra-particle diffusion model fits the experimental data very well in both periods (R²>0.9392).
TABLE VII. Kinetic parameters for Fluorescent disperse dyes adsorption on polyester fabrics.
Dyes
Intraparticle diffusion rates
Kint1 (min
-1) R²
Kint2
(min-1) R²
Yellow 0.5364 0.9905 0.0413 0.9887
Red 0.4242 0.9811 0.1181 0.9453
Orange 0.4786 0.9392 0.0995 0.9611
High-Visibility
1. Influence of dye concentration
The results of the color analyses of the dyeing obtained with the use of different concentrations of the fluorescent dyes tested are presented in Figures 6, 7 and 8.
FIGURE 6. The x-y chromaticity co-ordinates of the Yellow dye relative to the area boundaries in accordance with the EN-471:1994 standard.
FIGURE 7. The x-y chromaticity co-ordinates of the Red dye relative to the area boundaries in accordance with the EN-471:1994 standard.
The chromaticity co-ordinates of dyeings obtained through the use of the Disperse Luminous Yellow, Disperse Luminous Red, and Disperse Luminous Orange dyes changed with concentration. For example, the chromaticity co-ordinates obtained with the use of the yellow dye with a concentration higher than 0.10% also fall within the required area. However, the color parameters of dyeings carried out with the use of the red and the orange dye were positioned outside the area required by the standard for a concentration higher than 1% and 1.5%, respectively. Generally, the x-y co-ordinates of dyeings obtained with the use of the Red and Orange fluorescent dyes tested, unlike the yellow dye, were practically at the boundary of the colors required by
the standard. This means that a minimal change in concentration may have caused undesirable changes in the dyeing and a failure to meet the standard NF EN471 requirements for color.
2. Influence of mixture dyes
To observe the effect of mixture dyes on the high-visibility of the obtained color, nine different compositions of the three dyes tested were prepared as shown in Table IV. After dyeing, the dyed sample was tested using DATACOLOR Spectrocolorimeter to determine the luminous factor. The results of this study are presented in Table VIII:
TABLE VIII. Influence of mixture dyes on luminous factor and high-visibility color.
Sample designation Luminous factor measured
β
High-visibility colorRY 0.4063 Yes
YR 0.6091 No
RO 0.3897 Yes
OR 0.4550 Yes
YO 0.6964 No
OY 0.5100 Yes
Y(RO) 0.5642 No
R(YO) 0.4507 Yes
O(YR) 0.4913 Yes
Table VIII lists the results obtained from the calculation of the luminous factor. For a dyeing which meets the requirements of the above mentioned standard, the luminance factor β should be equal to or greater than the value given by the standard NF EN471.
By analyzing the results obtained and presented in
Table VIII, the color of the dyeing accessed by using the yellow dye, characterized by a significantly important value of βm, at concentration of 0.4% in binary mixtures or 0.3% in tertiary mixtures lose the high-visibility. On the contrary, all the other dyeings resulting from the use of the Disperse Luminous Yellow, Red, and Orange had a high-visibility color.
CONCLUSION
For the three dye/polyester fabric system, the kinetics of adsorption of fluorescent disperse Yellow Luminous, fluorescent disperse Red Luminous, and fluorescent disperse Orange Luminous were fitted well by the pseudo-second-order model (R²>0.98 for
Nernst equation as reflected by the correlation coefficients (R²) (nearer to 1). For all dyes (yellow, red and orange), the Nernst adsorption constant (Kad) increased with increasing temperature.
Throughout the study, we demonstrated that a minimal change in concentration and a mixture of dyes may cause undesirable changes in dyeing and a failure to meet the standard NF EN471 requirements for color.
REFERENCES
[1] Kitzerow, H.S., Liq Cryst. 1994, 16 (1) 1-31. [2] Doane, J. W., Vaz, N., Wu, B.G., and Zumer, S.
Appli Phys Lett. 1986, 48 269.
[3] Otterstätter, G. Drugs and Cosmetics, CRC Press, New York. 1999.
[4] Licudine, J. A., McQuate, G. T., Cunningham, R.T., Liquido, N. J., and Li, Q. X. Pest Manag Sci. 2002, 58 (1) 38-44.
[5] Bamfield, P. Roy Soc of Chem, . ISBN 0-8404-474-4, (2001).
[9] Ho, Y. S., McKay, G. Process Biochem. 1999, 34, 451-465.
[10] Weber, Jr. W. J., Morris, J. C., J Sanit Eng Div– ASCE. 1963, 89 31-59.
[11] Alkan, M., Demirbas, Ö. Dogan, M., Micropor Mesopor Mater. 2007, 101 (3) 388-396. [12] Özacar, M., Sengil, A., Colloids and Surfaces A:
Physicochem. Eng. Aspects. 2004, 242 105-113.
[13] Özacar, M., Adsorption. 2003, 9 125-132.
AUTHORS’ ADDRESSES Mohamed Hamdaoui, PhD Ahlem Lanouar
Sabri Halaoua, PhD
Ecole Nationale d'Ingénieurs de Monastir, Université de Monastir