97 Presmeg, N. (2006). Research on visualization in learning and teaching of mathematics. In A. Gutierrez
& P. Boero (Eds). Handbook of Research on the Psychology of Mathematics Education: Past, Present and Future, pp.205-235, The Netherlands: Sense Publishers.
Serra, M. (1997). Discovering geometry: An inductive approach (2nd ed.). California. Key Curriculum Press.
Singh, R. I. (2006). An investigation into learner understanding of the properties of selected quadrilaterals using manipulatives in a grade eight mathematics classes. Masters’ thesis. Durban, South Africa: University of KwaZulu-Natal.
Siyepu, S.W. (2005). The use of van Hiele theory to explore problems encountered in circle geometry: A grade 11 case study. Master’s thesis. Grahamstown, South Africa: Rhodes University.
Swan, M. (2001). Dealing with misconceptions in mathematics. In P. Gates (Ed.), In Issues in Mathematics Teaching, (pp. 147-165) London: Routledge Falmer.
Usiskin, Z. (2002). Teachers need a special type of content knowledge. ENC Focus, 9 (3), 14-15. Van Hiele, P. M. (1986). Structure and insight: A theory of mathematics education. Orlando, FL: Academic
Press.
Van Hiele, P. M. (1999). Developing geometric thinking through activities that begin with play. Teaching Children mathematics, 5 (6), 310-317.
Weber, R. (2004). Editor’s Comments. The rhetoric of positivism versus interpretivism: A personal view. MIS Quarterly, 28 (1), iii-xii.
Received: September 20, 2018 Accepted: January 08, 2019
Harrison Ngirishi MS, Education Specialist, University of KwaZulu- Natal, Durban, South Africa.
E-mail: [email protected]
Sarah Bansilal PhD, Professor, Head of Department of Mathematics Education, School of Education, University of KwaZulu-Natal, Durban, KwaZulu-Natal, South Africa.
E-mail: [email protected]
THE RELIABILITY OF STUDENTS’
EVALUATION OF TEACHING AT
SECONDARY SCHOOL LEVEL
Ugorji I. Ogbonnaya University of Pretoria, South Africa E-mail: [email protected]
Abstract
The Student Evaluation of Teaching (SET), although controversial, is a common practice at the higher education level for faculty appraisals and promotions, but seldom at secondary school level. Concerns have been raised as to whether students are informed and experienced enough to evaluate teachers’ teaching practices in a reliable way and arrive at valid outcomes. The purpose of this research was to explore the reliability of students’ evaluations of mathematics teaching at secondary school level. This research involved eight teachers, and 194 Grade 11 students from eight secondary schools in Bojanala District, North West province in South Africa. A SET questionnaire was developed, validated and used for data collection. The data were analysed by calculating the average deviation index of the students’ evaluations of each teacher per item and the Intraclass Correlation Coefficient (ICC) with SPSS. This was done using one-way random effects, absolute agreement and a multiple raters/measurements model. Both the ADI and ICC values showed a high degree of reliability of the SET. Hence, SET at secondary school level may provide a reliable indication of teachers’ educational practices that might be used for the formative assessment of teachers’ instruction. It can also assist in designing teacher training programmes for pre-service teachers and professional development programmes for in-service teachers. Keywords: Average Deviation Index,Intraclass Correlation Coefficient, reliability of SET, secondary school, student evaluation of teaching (SET).
Introduction
Ensuring that students are offered quality education is a priority for every government
and institution. One way of achieving this priority is by evaluating teachers’ educational practices. The evaluation of teachers’ educational practices could be achieved through Student Evaluation of Teaching (SET). SET is often used at the higher education level to appraise lecturers’ instruction practices and for faculty appraisals and promotions (Mandouit, 2018; Zabaleta, 2007). According to Penny and Coe (2004), the use of SET “as an indicator of teaching
quality is now a common feature in universities around the world” (p. 215) and the results from
SETs have been used to make critical judgements in higher education (Beran & Rokosh, 2009). In the United States, for example, SET is used as a major source of teaching evaluation by the majority (94.2%) of fourth-year liberal arts colleges (Miller & Seldin, 2014).
The evaluation of the education system in general faces the challenge of assessing the system in a valid and reliable manner (Taut & Rakoczy, 2016). In particular, the validity and reliability of SET is a contentious matter (Hattie, 2009; Hornstein, 2017). Some researchers
believe that the way in which students perceive effective teaching may be unrelated to good
teaching (Ko, Sammons, & Bakkum, 2013). For example, Beecham (2009) observes that SET
can become a measure of “customer [student] satisfaction” instead of a measure of educational
PROBLEMS OF EDUCATION IN THE 21st CENTURY Vol. 77, No. 1, 2019
98 Even though some researchers have raised concerns over the biases that may affect the
results of SET, other researchers who support SET adjudge it as the most acceptable criterion
for measuring the effectiveness of teaching. As noted by Theall and Franklin (2001), students are the most qualified source to rate the extent to which teaching is productive, informative,
satisfying or worthwhile. According to Theall and Franklin, studies have shown that students’ assessments of the amount learned in a subject and their overall evaluations of teachers are consistently highly correlated. Felder and Brent (2004) opined that SET should be an essential component of teaching evaluation because “students are in a better position than anyone else to judge certain aspects of teaching, such as how clear, interesting, respectful, and fair a course
instructor is, and they’re the only ones who can say how an instructor has influenced their attitude towards the course subject, their motivation to learn it, and their self-confidence” (p.
200). Similarly, Prebble et al. (2004) argued that SET is among the most reliable and accessible
indicators of teachers’ teaching effectiveness. This is due to the fact that SET might give a more
holistic rating of the teachers’ educational practices than other methods of teaching evaluation, like peer evaluation or teachers’ self-evaluation. According to Quaglia and Corso (2014), SET can provide relevant information relating to teachers’ instructional practices because students spend more time with the teacher in the classroom. Thus, their evaluations are more likely to
adequately give an indication of the teacher’s educational practices.
Many studies at higher education level have provided empirical evidence of the reliability and validity of SET (Arreola, 2007; Benton & Ryalls, 2016). However, the use of SET at secondary school level is rare (MET project, 2010) and studies on SET at secondary school level are sparse. The rare use of SET at secondary school level and the paucity of research of SET at that level of education may be due to concerns that students at school level might not be informed and experienced enough to give reliable and valid evaluations of teachers’ instructional practices and the educational systems supporting them. Nevertheless, some studies have shown that secondary school students, and even primary school pupils, can give
reliable evaluations of teachers’ educational practices. For example, Peterson, Wahlquist, and
Bone (2000) conducted 9,765 student surveys at elementary, middle and high school levels and found that SET was a reliable measure of teacher educational practices. Similarly, Kyriakides (2005) has found that surveying primary school students’ is a reliable measure of their teachers’ educational practices in Cyprus. In international research conducted in six European countries, Kyriakides et al. (2014) found that primary school students’ evaluation of teaching was reliable and valid. Other research (Irving, 2004; Wilkerson, Manatt, Rogers, & Maughan, 2000) has shown that secondary school students are capable of giving reliable and valid evaluation of teachers’ educational practices.
In South Africa, SET has not been practiced at secondary school level and hence has not
been the focus of any research. However, the evaluation of the quality of educational practices
provided by teachers was part of the broader objectives of the Integrated Quality Management System (IQMS) of public schools in South Africa (Education Labour Relations Council, 2003). However, as observed by Mji (2011) and Mpungose (2014), the system has not achieved its intended purpose and has been the subject of much criticism regarding the objectivity of the
evaluation of the quality of teachers’ educational practices. In the IQMS system, teachers’
self-evaluations and peer self-evaluations are used to appraise the teachers’ educational practices. SET results can be used as an input for the government and other stakeholders to create policies regarding teachers’ promotion and retention. SET might give insight into teachers’
educational practices and the quality of education that teachers provide to students. In addition, SET may be convenient in many educational settings and is also cost-effective. However, for
SET to be used at secondary school level, its reliability and validity will have to be scrutinised in order for it to be appropriately supported and carried out. There is a paucity of literature on
Vol. 77, No. 1, 2019 99
the research gap, this research explored the reliability of SET at secondary school level using
an average deviation measure and an intra-rater reliability (Intraclass Correlation Coefficient
[ICC]).
Background
Reliability refers to the consistency, stability, and generalisability of measurements or assessments (Hobson & Talbot, 2001). The reliability of a procedure or measure is the degree to which the procedure or measure yields consistent results (Benton & Li, 2017). Reliability
describes how far a particular procedure, such as SET, will produce similar results in different
circumstances, assuming nothing else has changed (Roberts, Priest, & Traynor, 2006). According
to Bruton, Conway and Holgate (2000), reliability reflects not just the degree of correlation, but
also an agreement between measurements. A procedure is said to be reliable when its results are not dependent on chance or unknown circumstances. The reliability of a procedure is usually tested by having many people perform the procedure on identical data and comparing their results. Through statistical measure, if the variation in the results exceeds a certain threshold, the procedure is judged to be unreliable (Vriezekolk, 2014).
The problem of this research was to explore the reliability of SET at secondary school level. The reliability of SET may be evaluated by considering the consistency of the ratings of the students in a class. If there is little variability in the students’ overall ratings of the teacher, it implies that the students tend to perceive the teacher’s instruction in the same way and therefore their evaluations may be considered reliable. However, if the students vary substantially in their overall ratings of the teacher, it means that their evaluations are not reliable and thus less helpful in giving a general impression of the teacher’s teaching (Benton & Li, 2017).
The consistency of SET can be measured by computing the average deviation index
(ADI) (Burke, Finkelstein, & Dusig, 1999), the within-group interrater reliability coefficient (James, Damaree, & Wolf, 1984), and the Intraclass Correlation Coefficient (ICC) (Koo & Li,
2016) of students’ ratings of teaching, among other measures.
Methodology of Research
Research Design
This research used quantitative descriptive research method and survey research design to explore the reliability of SET. According to Maree and Pietersen (2016), quantitative research
is a systematic and objective process of using numerical data from only a selected sub-group of
a population to generalise the findings to the population. Surveys are used to gather large scale
data that can be statistically manipulated in order to make generalisations (Creswell, 2015). In this research, a questionnaire was used to gather grade 11 students’ evaluations of their mathematics teachers’ educational practices across eight classes and the data were statistically
analysed to make inferences regarding the SET in question. This research is part of an ongoing
research project, which commenced in 2010 with the development of instruments. However, the data for this research were collected in September 2017.
Participants
The research was conducted in secondary schools in a North West Province, South
Africa. Eight Grade 11 mathematics classes from different secondary schools were involved in
PROBLEMS OF EDUCATION IN THE 21st CENTURY Vol. 77, No. 1, 2019
100 consented to their classes being used for the research. There were 194 students (ages 16 – 19
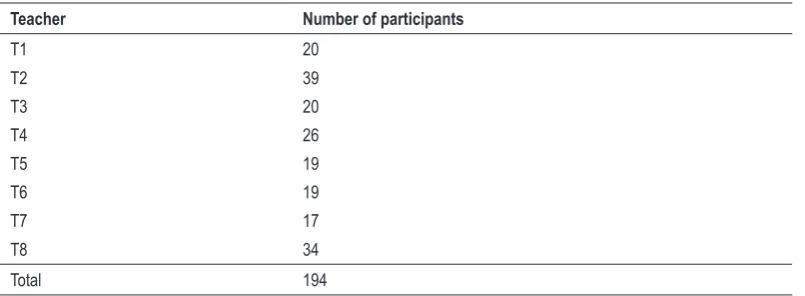
years old) from the mathematics classes in the eight secondary schools who participated in the research. The distribution of the participants per teacher (per class) is shown in Table 1.
Table 1. Participants per teacher.
Teacher Number of participants
T1 20
T2 39
T3 20
T4 26
T5 19
T6 19
T7 17
T8 34
Total 194
Ethical Considerations
As part of the ethical procedure of the University of South Africa, permission to conduct the research was obtained from the university’s ethics committee and from the provincial Department of Basic Education in the province where the research was conducted. Permission was also obtained from the principals and teachers whose students participated in the research. In addition, before the commencement of the research, the participants were informed in writing about the purpose of the research, that their participation in the research was voluntary and that they could withdraw from the research at will without prejudice. They were also told that the
information they provided would be treated as confidential and the report of the research would
keep them and their schools anonymous. They signed consent forms before participating in the research.
Instrument and Procedures
The data for this research were collected by means of a SET questionnaire. The questionnaire was a six-point Likert type rating scale. It consisted of 27 items that represent positive descriptors of teacher behaviour in which the students specified their levels of agreement
or disagreement with the item statements on the scale: 6 = strongly agree, 5 = agree, 4 = slightly
agree, 3 = slightly disagree, 2 = disagree, and 1 = strongly disagree. The questionnaire was
developed by the researcher.
To develop the instrument, the researcher started with a literature search relating to
the characteristics of effective teachers and teaching. Specifically, the researcher searched for studies that surveyed students’ and teachers’ views of effective teachers, such as that of Irving (2004). The researcher then perused official documents such as the South African Norms
and Standards for Educators documents (DoE, 2000), the National Curriculum Statement for mathematics (DoE, 2003) and any other related literature. Finally, the researcher interviewed a non-random sample of Grade 8 to Grade 12 mathematics students and teachers. These teachers
and students were asked to indicate their views of effective teachers. From those sources, a pool
of 186 items was created. For the 186 items, the researcher started a vetting process involving
Vol. 77, No. 1, 2019 101
teachers, students and university-based mathematics and science education researchers. The vetting process was carried out to ensure that the items were clear, had no ambiguity in meaning and that they would be easily understood by the students as recommended by Mogari (2004). Furthermore, the researcher did not want an extremely long instrument that could end up being unwieldy and taking too long to complete. Initially, the 186 items were scrutinised by six teachers (four mathematics teachers and two English language teachers) and 10 secondary school students. They recommended some grammatical changes and the removal of some items. For instance, it was suggested that the researchers use ‘learners’ instead of ‘students’ as this is standard practice in the high school system in South Africa. Following their suggestions, the researcher trimmed down the items to 135.
The researcher then requested four university-based mathematics and science education
researchers to examine the 135 items. They felt that a number of items were repetitive and that the instrument was too long, so some of the items were eliminated, resulting in an 84-item instrument. The four researchers were then asked to rate each of the 84-items in relation to assessing teacher educational practices using a 5 to 1 rating scale where 5 = strongly favourable; 4 = favourable; 3 = undecided; 2 = unfavourable and 1= strongly unfavourable.
From their rating of the items, the correlation coefficients between the average rating
for each item and the total (summed) score across all items in each subscale (Trochim, 2006)
were computed, and all of the items that had correlation coefficients that were less than .7 (r
<.7) were eliminated. This process resulted in 39 items, which were further reduced to 30
items by eliminating the 9 items with the least correlation coefficients among the 39 items.
This was done in order to reduce the number of items to 30 so that it would not be too long for the participants to complete because potential respondents may have been less inclined to participate in a long survey (Galesic & Bosnjak, 2009).
A factor analysis was used to further determine if the items in the instrument measured the theorised constructs and thus strengthened the validity of the instrument. A principal component factor analysis on SPSS was used to determine the factor loadings of the items of
the instrument. The first step was to carry out a preliminary analysis using the output of the R-matrix. The result revealed that three items had one-tailed significant values greater than .05.
Hence, it was judged better to eliminate the three items to avoid singularity (Field, 2005). The
final instrument was a 27-item instrument. According to Kaiser’s criterion (Field, 2005), five factors with eigenvalues greater than one were extracted from the 27 items. The five factors
were: teachers’ subject knowledge, lesson preparation, lesson presentation, student assessment, and student motivation.
The reliability of the instrument was established by calculating the Cronbach’s alpha value (Cohen, Manion, & Morrison, 2011), using data gathered in a pilot study of the instruments
from 109 students in four secondary schools. A coefficient alpha value of .95 was obtained. Based on the rule of thumb, this alpha value was deemed “excellent” (George & Mallery 2003, p. 231). Hence, the questionnaire was judged to be reliable.
Data were collected from the students involved in the research at the schools’ premises
between one and five days after the topic used for the research had been taught. Trigonometry
was used as the topic because it is a very important aspect of the school mathematics curriculum
and was perceived as one of the topics that students find challenging (Chauke, 2013; De Villiers
& Jugmohan, 2012).
Data Analysis
The data were analysed by computing the average deviation index (ADI) of the students’
evaluations of each teacher per item and the Intraclass Correlation Coefficient (ICC) of all the
PROBLEMS OF EDUCATION IN THE 21st CENTURY Vol. 77, No. 1, 2019
102 measure of interrater agreement for evaluators’ ratings of a single target on a single occasion
(Burke, Finkelstein, & Dusig, 1999). The students’ evaluations of the teachers in each of the schools were used for the ADI analysis.
ICC is a measure of the reliability of measurements or ratings. It is the ratio of variance among subjects (subject variability) over the total variance (Koo & Li, 2016). An ICC is a widely used reliability index in inter-rater reliability analyses (Koo & Li, 2016), and ranges from zero (no reliability) to one (perfect reliability). The ICC was computed using a
one-way-random effects, absolute agreement, multiple measurements model at a 95% confidence interval. According to Koo and Li (2016), the one-way random effects, absolute agreement, multiple measurements model is used when each subject is rated by a different set of randomly chosen
evaluators. According to Kirkwood and Sterne (2003), the reliability is considered excellent if the ICC > 0.75, it is considered fair to good if 0.4 < ICC < 0.75, and poor if ICC < 0.4.
Research Results
The data analyses results were categorised and presented in two parts: ADI of the students’ evaluations of each teacher per item and the average measure ICC.
Mean and Average Deviation Index
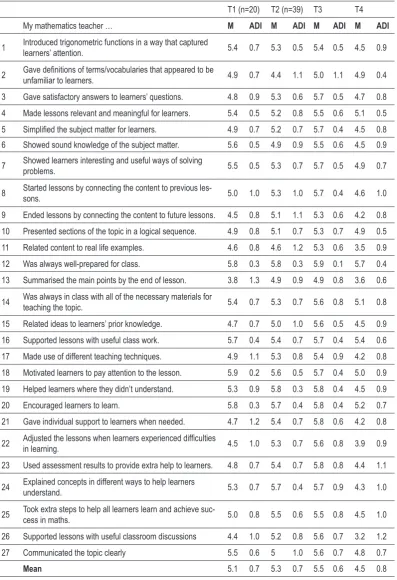
The mean (M) and the Average Deviation (AD) index of the students’ evaluations of each teacher per item are presented in Table 2. The table shows that the average deviation of the
students’ evaluations of the teachers on almost all of the 27 items of the questionnaire was less than or equal to one. In addition, the mean of the average deviation values for the evaluations of
each teacher across all of the items was less than one. According to Burke’s (2002) guidelines
for establishing ranges, the upper-limit cut-off for AD indices for 6-point Likert-type items
is one. Therefore, the results showed a near perfect interrater agreement among the students
in their evaluations of each of the teacher’s teaching. This finding implies that the students’
evaluations may be judged to be reliable.
Vol. 77, No. 1, 2019 103
Table 2a. Means and average deviation index of the students’ evaluations per item of the questionnaire (T1 – T4)
T1 (n=20) T2 (n=39) T3 T4
My mathematics teacher … M ADI M ADI M ADI M ADI
1 Introduced trigonometric functions in a way that captured learners’ attention. 5.4 0.7 5.3 0.5 5.4 0.5 4.5 0.9
2 Gave definitions of terms/vocabularies that appeared to be unfamiliar to learners. 4.9 0.7 4.4 1.1 5.0 1.1 4.9 0.4
3 Gave satisfactory answers to learners’ questions. 4.8 0.9 5.3 0.6 5.7 0.5 4.7 0.8 4 Made lessons relevant and meaningful for learners. 5.4 0.5 5.2 0.8 5.5 0.6 5.1 0.5
5 Simplified the subject matter for learners. 4.9 0.7 5.2 0.7 5.7 0.4 4.5 0.8
6 Showed sound knowledge of the subject matter. 5.6 0.5 4.9 0.9 5.5 0.6 4.5 0.9
7 Showed learners interesting and useful ways of solving problems. 5.5 0.5 5.3 0.7 5.7 0.5 4.9 0.7
8 Started lessons by connecting the content to previous les-sons. 5.0 1.0 5.3 1.0 5.7 0.4 4.6 1.0
9 Ended lessons by connecting the content to future lessons. 4.5 0.8 5.1 1.1 5.3 0.6 4.2 0.8 10 Presented sections of the topic in a logical sequence. 4.9 0.8 5.1 0.7 5.3 0.7 4.9 0.5 11 Related content to real life examples. 4.6 0.8 4.6 1.2 5.3 0.6 3.5 0.9 12 Was always well-prepared for class. 5.8 0.3 5.8 0.3 5.9 0.1 5.7 0.4 13 Summarised the main points by the end of lesson. 3.8 1.3 4.9 0.9 4.9 0.8 3.6 0.6
14 Was always in class with all of the necessary materials for teaching the topic. 5.4 0.7 5.3 0.7 5.6 0.8 5.1 0.8
15 Related ideas to learners’ prior knowledge. 4.7 0.7 5.0 1.0 5.6 0.5 4.5 0.9 16 Supported lessons with useful class work. 5.7 0.4 5.4 0.7 5.7 0.4 5.4 0.6 17 Made use of different teaching techniques. 4.9 1.1 5.3 0.8 5.4 0.9 4.2 0.8 18 Motivated learners to pay attention to the lesson. 5.9 0.2 5.6 0.5 5.7 0.4 5.0 0.9 19 Helped learners where they didn’t understand. 5.3 0.9 5.8 0.3 5.8 0.4 4.5 0.9 20 Encouraged learners to learn. 5.8 0.3 5.7 0.4 5.8 0.4 5.2 0.7 21 Gave individual support to learners when needed. 4.7 1.2 5.4 0.7 5.8 0.6 4.2 0.8
22 Adjusted the lessons when learners experienced difficulties in learning. 4.5 1.0 5.3 0.7 5.6 0.8 3.9 0.9
23 Used assessment results to provide extra help to learners. 4.8 0.7 5.4 0.7 5.8 0.8 4.4 1.1
24 Explained concepts in different ways to help learners understand. 5.3 0.7 5.7 0.4 5.7 0.9 4.3 1.0
25 Took extra steps to help all learners learn and achieve suc-cess in maths. 5.0 0.8 5.5 0.6 5.5 0.8 4.5 1.0
26 Supported lessons with useful classroom discussions 4.4 1.0 5.2 0.8 5.6 0.7 3.2 1.2 27 Communicated the topic clearly 5.5 0.6 5 1.0 5.6 0.7 4.8 0.7
PROBLEMS OF EDUCATION IN THE 21st CENTURY Vol. 77, No. 1, 2019
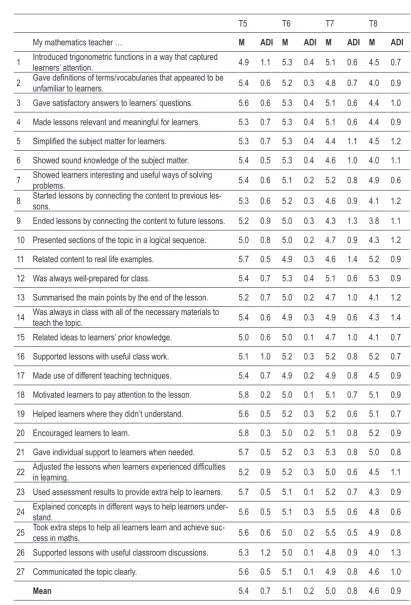
104 Table 2b. Means and average deviation index of students’ evaluations per item
of the questionnaire (T5 – T8)
T5 T6 T7 T8
My mathematics teacher … M ADI M ADI M ADI M ADI
1 Introduced trigonometric functions in a way that captured learners’ attention. 4.9 1.1 5.3 0.4 5.1 0.6 4.5 0.7
2 Gave definitions of terms/vocabularies that appeared to be unfamiliar to learners. 5.4 0.6 5.2 0.3 4.8 0.7 4.0 0.9
3 Gave satisfactory answers to learners’ questions. 5.6 0.6 5.3 0.4 5.1 0.6 4.4 1.0 4 Made lessons relevant and meaningful for learners. 5.3 0.7 5.3 0.4 5.1 0.6 4.4 0.9
5 Simplified the subject matter for learners. 5.3 0.7 5.3 0.4 4.4 1.1 4.5 1.2
6 Showed sound knowledge of the subject matter. 5.4 0.5 5.3 0.4 4.6 1.0 4.0 1.1
7 Showed learners interesting and useful ways of solving problems. 5.4 0.6 5.1 0.2 5.2 0.8 4.9 0.6
8 Started lessons by connecting the content to previous les-sons. 5.3 0.6 5.2 0.3 4.6 0.9 4.1 1.2
9 Ended lessons by connecting the content to future lessons. 5.2 0.9 5.0 0.3 4.3 1.3 3.8 1.1 10 Presented sections of the topic in a logical sequence. 5.0 0.8 5.0 0.2 4.7 0.9 4.3 1.2 11 Related content to real life examples. 5.7 0.5 4.9 0.3 4.6 1.4 5.2 0.9 12 Was always well-prepared for class. 5.4 0.7 5.3 0.4 5.1 0.6 5.3 0.9 13 Summarised the main points by the end of the lesson. 5.2 0.7 5.0 0.2 4.7 1.0 4.1 1.2
14 Was always in class with all of the necessary materials to teach the topic. 5.4 0.6 4.9 0.3 4.9 0.6 4.3 1.4
15 Related ideas to learners’ prior knowledge. 5.0 0.6 5.0 0.1 4.7 1.0 4.1 0.7 16 Supported lessons with useful class work. 5.1 1.0 5.2 0.3 5.2 0.8 5.2 0.7 17 Made use of different teaching techniques. 5.4 0.7 4.9 0.2 4.9 0.8 4.5 0.9 18 Motivated learners to pay attention to the lesson. 5.8 0.2 5.0 0.1 5.1 0.7 5.1 0.9 19 Helped learners where they didn’t understand. 5.6 0.5 5.2 0.3 5.2 0.6 5.1 0.7 20 Encouraged learners to learn. 5.8 0.3 5.0 0.2 5.1 0.8 5.2 0.9 21 Gave individual support to learners when needed. 5.7 0.5 5.2 0.3 5.3 0.8 5.0 0.8
22 Adjusted the lessons when learners experienced difficulties in learning. 5.2 0.9 5.2 0.3 5.0 0.6 4.5 1.1
23 Used assessment results to provide extra help to learners. 5.7 0.5 5.1 0.1 5.2 0.7 4.3 0.9
24 Explained concepts in different ways to help learners under-stand. 5.6 0.5 5.1 0.3 5.5 0.6 4.8 0.6
25 Took extra steps to help all learners learn and achieve suc-cess in maths. 5.6 0.6 5.0 0.2 5.5 0.5 4.9 0.8
26 Supported lessons with useful classroom discussions. 5.3 1.2 5.0 0.1 4.8 0.9 4.0 1.3 27 Communicated the topic clearly. 5.6 0.5 5.1 0.1 4.9 0.8 4.6 1.0
Mean 5.4 0.7 5.1 0.2 5.0 0.8 4.6 0.9
Vol. 77, No. 1, 2019 105
Intraclass Correlation Coefficient (ICC)
The result of the average measure ICC using a one-way random effects, absolute agreement, and multiple raters/measurements model at a 95% confidence interval is shown in
Table 3.
Table 3. Intraclass Correlation Coefficient of the students’ evaluations of the 8 teachers.
Intraclass Correlation
95% Confidence Interval F Test with True Value 0
Lower Bound Upper Bound Value df1 df2 p
Average Measures .865 .689 .961 7.396 9 70 <.001
One-way random effects model where people effects are random.
The average measures ICC is an index for the reliability of different raters averaged
together. A high degree of agreement was found among the students’ evaluations; the average
measured ICC was .865 at a 95% confidence interval (F(9,70) = 7.396, p<.001). This ICC value is excellent (Kirkwood & Sterne, 2003), which implies both a high degree of correlation and agreement among the students’ evaluations of the teachers’ teachings. Hence, the students’ evaluations of the teachers were regarded as reliable.
Discussion
This research explored the reliability of students’ evaluation of teaching at secondary
school level in South Africa using the average deviations and Intraclass Correlation Coefficient
as measures. The results showed that the average deviation of the students’ evaluations of the
teachers on each of the 27 items of the questionnaire was less than or equal to one, and that the
average deviation values were less than one for each teacher across all of the items. In addition,
the average Intraclass Correlation Coefficient value of .865 at a 95% confidence interval was
obtained. The results showed that there was consistency among the students’ evaluations of the teachers’ instructions on each item of the instrument and in general using the average deviation
index (ADI) and the Intraclass Correlation Coefficient (ICC). Overall, the results indicate that
the students’ evaluations of the teachers’ teaching were reliable. This is consistent with the
findings of Peterson, Wahlquist, and Bone (2000), who have shown that secondary school students could give reliable evaluations of their teachers’ educational practices. The finding of this study is also in agreement with the result of Irving (2004), who finds that secondary school
students’ evaluation of teachers was reliable in a study conducted in 13 states in the USA. This research showed that the students seemed to have a parallel and uniform view of what makes teaching meaningful. All of the students seemed to share the same experiences. Hence, the perceptions and appreciation of the teachers’ educational practices was evidenced by the near perfect interrater agreement (low ADI) in the students’ evaluations of the teachers
in all items of the questionnaire. For example, on item 4: “my mathematics teacher made lessons relevant and meaningful to learners”, the means of the students’ evaluations of the teachers ranged from 4.4 for Teacher 8 (T8) to 5.5 for Teacher 3 (T3), indicating a significant difference in the students’ perceptions of T8 and T3 with respect to making lessons relevant and
meaningful for learners. However, the low average deviation values (.6 for T3 and .9 for T8) indicate that the students’ perception of each teacher was consistent, and they were capable of
PROBLEMS OF EDUCATION IN THE 21st CENTURY Vol. 77, No. 1, 2019
106 for Teacher 3 (T3), indicating a significant difference in the students’ perceptions of the overall
educational practices of T4 and T3. In addition, the mean of the average deviation values across all of the items (.6 for T3 and .8 for T4) indicate that the students’ perception of each teacher
was consistent. These findings are in line with the findings of the MET Project (2010) that
secondary school students’ perceptions of a given teacher’s classroom practices are consistent
across the different groups of students that they teach.
The result of this research corroborates the results of Irving (2004), who has found that SET at secondary school level is reliable when based on (a) The teachers’ commitment to students and their learning, (b) Mathematical pedagogy, (c) Engagement with the curriculum, and (d) Relating mathematics to the real world. The results of this research further concur with those of Kyriakides et al. (2014), who have found that SET, which is based on eight
factors relating to teacher behaviour: orientation, structuring, questioning, teaching modelling,
application, management of time, teacher’s role in making the classroom a learning environment, and assessment, is reliable at primary school level.
All in all, the SET in this research can be said to be an honest reflection of the students’
perceptions of the teachers’ educational practices. This research has contributed to the body of knowledge on the reliability of SET at secondary school level, especially in the context of
South Africa. This finding brings to bear important issues relating to the professional work of
teachers. It gives an indication that the students who participated in this research seemed to have a shared view regarding the nuances of teachers’ professional practice and what is expected of a teacher. The nuances relate to the teachers’ knowledge of the subject, lesson preparation and
presentation, student assessment, and student motivation, as elicited by the SET questionnaire.
Conclusions
This research explored the reliability of the SET at secondary school level using the average deviation measure and intra-rater reliability of data collected from 194 students in eight mathematics classes. The results show that there was consistency and almost perfect agreement among the students’ evaluations of the teachers in all of the items of the instrument. Hence, the research has revealed that secondary school students are able to provide reliable evaluation of their teachers’ educational behaviour.
The result of this research lends support to the use of SET as a valuable tool to appraise
teachers’ educational practices at secondary school level. The findings suggest that, at secondary
school level, SET might be a reliable tool for the evaluation of the quality of education that
teachers provide to students. It can also be used to provide feedback to teachers on their professional practices. SET results may be used by teachers to understand their students’
expectations and perceptions of their instructional practices, and consequently to improve on their educational practices. Hence, SET results can serve as an effective formative assessment
tool for teacher professional development in order to improve student learning.
Furthermore, SET results can be used by school administrators and the government to complement the self and peer evaluations of the Integrated Quality Management System (IQMS). SET can further be used to identify teachers’ strengths and weaknesses regarding their educational practices based on which policies on teacher training, professional development and promotion criteria can be made.
As noted in the introduction, SET has not previously been used to evaluate teachers’ educational practices in South Africa and in many other countries, leading to a dearth of literature on SET at school level. This research therefore makes a contribution to the literature on the use of SET at secondary school level.
Finally, it should be noted that this research was carried out with mathematics students regarding their teachers and was based on trigonometry as a topic; thus, the results may be
Vol. 77, No. 1, 2019 107
different in other school subjects or topics and with students in different grade levels. Hence, the
result should be interpreted as such. In addition, there is a need for the research to be replicated
using other school subjects and topics, and with students in different grades.
References
Ahn, S., & Choi, J. (2004). Teachers’ subject matter knowledge as a teacher qualification: A synthesis of the quantitative literature on students’ mathematics achievement. Paper presented at the American Educational Research Association Conference San Diego, CA.
Arreola, R. A. (2007). Developing a comprehensive faculty evaluation system: A guide to designing, building, and operating large-scale faculty evaluation systems. San Francisco, CA: Anker Publishing.
Beecham, R. (2009). Teaching quality and student satisfaction: Nexus or simulacrum? London Review of Education, 7(2), 135–146.
Benton, S. L., & Li, D. (2017). IDEA student ratings of instruction and rsvp (IDEA Paper No. 66). Manhattan, KS: The IDEA Center.
Benton, S. L., & Ryalls, K. R. (2016). Challenging misconceptions about student ratings of instruction (IDEA Paper No. 58). Manhattan, KS: The IDEA Center.
Beran, T. N., & Rokosh, J. L. (2009). Instructors’ perspectives on the utility of student ratings of instruction. Instructional Science, 37(2), 171-184.
Berk, R. A. (1979). The construction of rating instruments for faculty evaluation: a review of methodological issues. Journal of Higher Education, 50(5), 650–669.
Bruton, A., Conway, J. H., & Holgate, S. T. (2000). Reliability: What is it, and how is it measured? Physiotherapy, 86(2), 94–99.
Burke, M. J. (2002). Estimating interrater agreement with the average deviation index: A user’s guide. Organizational Research Methods, 5(2), 159-172.
Burke, M. J., Finkelstein, L. M., & Dusig, M. S. (1999). On average deviation indices for estimating interrater agreement. Organizational Research Methods, 2, 49-68.
Chauke, W. (2013). A report on analysis of grade 12 students’ performance in mathematics paper II examination of 2012. Gauteng Department of Education. State policy evidence. Education Policy analysis Archives, 8(1), 1-44.
Chen, Y., & Hoshower, L. B. (2003). Student evaluation of teaching effectiveness: an assessment of student perception and motivation. Assessment & Evaluation in Higher Education, 28(1), 71-88.
Cohen, L., Manion, L., & Morrision, K. (2011). Research methods in education (7th Ed.). New York: Routledge.
Creswell, J. W. (2015). Educational research: Planning, conducting, and evaluating quantitative and qualitative research (5th Ed.). Boston, MA: Pearson.
Cronbach, L. J. (1951). Coefficient alpha and the internal structure of tests. Psychometrika, 16, 297-334. Department of Education. (2000). Norms and standards for educators. Government Gazette, 415 (20844).
Pretoria: Department of education.
Department of Education. (2003). National Curriculum Statement Grades 10-12 (General) mathematics. Pretoria: Department of education.
De Villiers, M., & Jugmohan, J. (2012). Learners’ conceptualisation of the sine function during an introductory activity using sketchpad at grade 10 level. Educação Matemática Pesquisa, 14(1), 9-30.
Denson, N., Loveday, T., & Dalton, H. (2010). Student evaluation of courses: what predicts satisfaction? Higher Education Research & Development, 29(4), 339-356.
Felder, R. M., & Brent, R. (2004). How to evaluate teaching. Chemical Engineering Education, 38(3), 200-215.
Field, A. (2005). Discovering statistics using SPSS. London: Sage.
Galesic, M., & Bosnjak, M. (2009) Effects of questionnaire length on participation and indicators of response quality in a web survey. Public Opinion Quarterly, 73(2), 349-360.
PROBLEMS OF EDUCATION IN THE 21st CENTURY Vol. 77, No. 1, 2019
108 Hattie, J. (2009). Visible Learning: A synthesis of over 800 meta-analyses relating to achievement. Abingdon: Routledge.
Herman, J. L., Klein, D. C. D., & Abedi, J. (2000). Assessing students’ opportunity to learn: Teacher and student perspectives. Educational Measurement: Issues and Practice, 19(4), 16-24.
Hobson, S. M., & Talbot, D. M. (2001). Understanding student evaluations. College Teaching, 49(1), 26–31.
Hornstein, H. A. (2017). Student evaluations of teaching are inadequate assessment tool for evaluating faculty performance. Cogent Education, 4(1), 1304016. Retrieved from: https://doi.org/10.108 0/2331186X.2017.1304016.
Irving, S. E. (2004). The development and validation of a student evaluation instrument to identify highly accomplished mathematics teachers. Unpublished PhD thesis. University of Auckland, New Zealand.
James, L. R., Demaree, R. G., & Wolf, G. (1984). Estimating within-group interrater reliability with and without response bias. Journal of Applied Psychology, 69, 85–98.
Kirkwood B. R., & Sterne J. A. C. (2003). Measurement error: Assessment and implications. Essential medical statistics (2nd Ed.). Oxford: Blackwell Publishing Ltd.
Ko, J., Sammons, P., & Bakkum, L. (2013). Effective teaching: A review of research and evidence. Berkshire: CfBT Education Trust.
Koo, T. K., & Li, M. Y. (2016). A guideline of selecting and reporting intraclass correlation coefficients for reliability research. Journal of Chiropractic Medicine, 15(2), 155-163.
Kyriakides, L. (2005). Drawing from teacher effectiveness research and research into teacher interpersonal behaviour to establish a teacher evaluation system: A study on the use of student ratings to evaluate teacher behaviour. Journal of Classroom Interaction, 40(2), 44‐66.
Kyriakides, L., Creemers, B.P.M., Panayiotou, A., Vanlaar, G., Pfeifer, M., Cankar, G., & McMahon, L. (2014). Using student ratings to measure quality of teaching in six European countries. European Journal of Teacher Education, 37(2), 125–143.
Mandouit, L. (2018). Using student feedback to improve teaching. Educational Action Research, 26(5), 755-769. doi: 10.1080/09650792.2018.1426470.
Marsh, H. W., & Hocevar, D. (1991). The multidimensionality of students’ evaluations of teaching effectiveness: The generality of factor structures across academic discipline, instructor level, and course level. Teaching & Teacher Education, 7(1), 9-18.
Maree, K., & Pietersen, J. (2016). Surveys and the use of questionnaires. In K. Maree (Ed.). First steps in research (pp. 173-190). Pretoria: Van Schaik Publishers.
MET Project. (2010). Learning about teaching: Initial findings from the measures of effective teaching project. Bill and Melinda Gates Foundation. Retrieved from: https://eric.ed.gov/?id=ED528382. Miller, J. E., & Seldin, P. (2014). Changing practices in faculty evaluation: Can better evaluation make
a difference? Bulletin of the AAUP. Retrieved from: https://www.aaup.org/article/changing-practices-faculty-evaluation#.W91-FtUzbIU
Mji, L. K. (2011). Investigating factors inhibiting the implementation of IQMS in a South African. Unpublished Master’s dissertation, Rhodes University, Grahamstown.
Mogari, D. (2004). Attitudinal scale measures in Euclidean geometry: What do they measure? South African Journal of Education, 24(1), 1-4.
Mpungose, J. E. (2014). Managing teacher performance and its appraisal: dilemmas of school Principals. Problems of Education in the 21st Century, 62, 74-85.
Penny, A. R., & Coe, R. (2004). Effectiveness of consultation on student ratings feedback: A meta-analysis. Review of Educational Research, 74(2), 215–253.
Peterson, K., Wahlquist, C., & Bone, K. (2000). Student surveys for school teacher evaluation. Journal of Personnel Evaluation in Education, 14(2), 135 – 153.
Prebble, T., Hargreaves, H., Leach, L., Naidoo, K., Suddaby, G., & Zepke, N. (2004). Impact of student support services and academic development programmes on student outcomes in undergraduate tertiary study: A synthesis of the research. New Zealand: Ministry of Education.
Quaglia, R. J., & Corso, M. J. (2014). Student voice: The instrument of change. Thousand Oaks, CA: Corwin.
Roberts, P., Priest, H., & Traynor, M. (2006). Reliability and validity in research. Nursing Standard, 20(44), 41-45.
Vol. 77, No. 1, 2019 109
Schneider, G. (2013). Student evaluations, grade inflation and pluralistic teaching: Moving from customer satisfaction to student learning and critical thinking. Forum for Social Economics, 42(1), 122– 135.
Taut, S., & Rakoczy, K. (2016). Observing instructional quality in the context of school evaluation. Learning and Instruction, 46, 45-60.
Theall, M., & Franklin, J. L. (2001). Looking for bias in all the wrong places: A search for truth or a witch hunt in student ratings of instruction? New Directions for Institutional Research, 109, 45–56. Trochim, W. M. K. (2006). The research methods knowledge base. Retrieved from: http://www.
socialresearchmethods.net/kb/scaling.php.
Vriezekolk, E. (2014). Testing reliability of raster - report of experiment with Kerckhoffs students. (CTIT Technical Report Series; No. TR-CTIT-14-05). Enschede: Centre for Telematics and Information Technology (CTIT).
Wilkerson, D. J., Manatt, R. P., Rogers, M. A., & Maughan, R. (2000). Validation of student, principal, and self-ratings in 360 feedback® for teacher evaluation. Journal of Personnel Evaluation in Education, 14(2), 179-192.
Zabaleta, F. (2007). The use and misuse of student evaluations of teaching. Teaching in Higher Education, 12(1), 55–76.
Received: December 07, 2018 Accepted: January 18, 2019
Ugorji I. Ogbonnaya PhD, Senior Lecturer, Department of Science, Mathematics and Technology Edu-cation, Faculty of EduEdu-cation, University of Pretoria, George Storrar & Leyds Street, Groenkloof, Pretoria South Africa.