The Application of Network Analysis
To Exploring Intersectoral Innovation Flows:
The Unit Value Approach
Hsin-Yu Shih
Department of International Business Studies National Chi Nan University
Taiwan
Pao-Long Chang
Department of Business Administration Feng Chia University
Taiwan
ABSTRACT
The network of intersectoral innovation flows can be proxied by the product-embodied R&D flow matrix calculated using data on input-output tables and sectoral R&D expenditure. Leoncini et al. (1996; 2000; 2001; 2005) used network analysis to compare intersectoral innovation flows among several countries based on a relative matrix approach; i.e., the normalization of intersectoral innovation flow matrix, which is conducted and assumed to remove the scale effects arising from size differences among industries and countries. This approach, however, can only provide a basis for comparison among constituent sectors within a certain column/row of the intersectoral innovation flow matrix. To overcome this limitation, the authors propose an alternative technique called the unit value approach, which eliminates the scale effects and the flaws caused by the data transformation of normalization. The evidence obtained from using various other approaches to examine the patterns of intersectoral innovation flows in Taiwan – together with a qualitative assessment – demonstrates that the proposed approach more accurately represents the reality of a technological system.
Keywords: intersectoral innovation flow, network analysis, unit value approach,
International Journal of Business and Information
1. INTRODUCTION
The systems approach to the analysis of technological change is well developed and is applied in numerous studies (e.g., Lundvall, 1992; Nelson, 1993; Patel and Pavitt, 1994; Metcalfe, 1995; Breschi and Malerba, 1997; Leoncini, 1998; Carlsson et al., 2002; Hekkert, 2007; Montresor and Marzetti, 2008; Weng et al., 2010). This approach, however, has recently undergone a tremendous transformation. The change was prompted by the need to supplement qualitative analyses of constituent institutions and sectors with rigorous quantitative measurements and evaluations of their relationships and structure. This need has led researchers to look for new and more suitable methodological tools (Montresor and Marzetti, 2009).
In this regard, the identification of intersectoral innovation flows is a major first step in understanding the structural characteristics of a technological system (Drejer, 2000). The diffusion of innovation following its realization comprises two types – disembodied innovation flows, and product-embodied R&D diffusion. Disembodied innovation flows are related to the transmission of ideas, knowledge, expertise, or technology in a way that does not involve physical intermediates. In contrast, the study of product-embodied R&D diffusion refers to inputs purchased by industries from upstream industries that embody completely new commodities or quality improvements. The latter type is less dependent on approximate assumptions because of the public databases of input-output tables and sectoral R&D expenditure.
Many studies of innovation diffusion use product-embodied R&D diffusion as a proxy for intersectoral innovation flows (e.g., Leoncini et al., 1996; Sakurai et al., 1997; Papaconstantinou et al., 1998; Park and Kim, 1999; Leoncini and Montresor, 2000; 2001; 2005; Peeters et al., 2001; Montresor and Marzetti, 2008). The network of intersectoral innovation flows can be constructed and proxied by the product-embodied R&D flow matrix, which is calculated using data from input-output tables and sectoral R&D expenditure. Combining input-output analysis with interdependence of innovation activities, and building up intersectoral innovation flow matrices, provide researchers with a valuable map by which to examine the constitutive relationships of an innovation system (Montresor and Marzetti, 2009).
help of methodologies and indicators of network analysis. Derived from graph theory, network analysis is a recently developed set of methods for the systematic study of social networks. It aims to describe the structure of interactions (displayed by edges) between given entities (displayed by nodes), and it uses quantitative techniques to produce relevant indicators for studying the characteristics of a whole network and the structural position of individuals or sub-groups (Chang and Shih, 2005).
Although developed for the study of sociology, the techniques and indicators of network analysis are highly proper for use in examining the structural features of the interactive relationships within a technomogical system (Leoncini et al., 1996; Leoncini and Montresor, 2000). Looking for alternative analytical tools more capable than traditional indicators of input-output approach in measuring systemic and structural features, Leoncini et al. (1996; 2000; 2001; 2005) adopted the network analysis approach for studying and comparing the intersectoral innovation flows of different countries. In addition, they applied the traditional network analysis technique (i.e., the normalization of matrices by column or row) to overcome scale effects. Eliminating these effects, which result from differences in industry and country size, is essential in order to compare technological systems meaningfully. This approach, however, caused some interpretative problems and consequent flaws in the relevant indicators of network analysis.
The current study proposes an alternative approach to remove the scale effects and to avoid flaws arising from the normalization processes. To verify whether our proposed approach reflects the patterns of intersectoral innovation flows better than traditional approaches do and whether our approach more accurately represents reality, we apply these other approaches to examine intersectoral innovation flows in Taiwan, and then match the quantitative outcomes with a qualitative assessment of Taiwan’s technological system.
2. MODELING NETWORK ANALYSIS
This section introduces Leoncini’s approach, discusses scale effects, and describes our alternative approach; i.e., the unit value matrix.
2.1
.
Introducing Leoncini’s ApproachInternational Journal of Business and Information
stressed that the analysis of economic interdependence is an extremely powerful tool of examination, and he used input-output analysis to build up intersectoral innovative flows matrices to measure the innovative activities of a technological system. Intersectoral innovation diffusion can be proxied by product-embodied R&D flows, which are determined by measuring the R&D expenditures of upstream industries that are embodied in the inputs of the industries that use it. Marengo and Sterlacchini (1990) proposed a methodology to measure innovation diffusion, which is expressed as follows:
x
I
A
d
r
R
ˆ
ˆ
1
1ˆ
(1)Here, rˆ ,
x
ˆ
andd
ˆ
represent the sectoral diagonal matrices of R&Dexpenditure, gross output, and final demand, respectively, and (I-A)-1 is the Leontief inverse. Each cell, Rij, of the matrix measures the direct and indirect R&D expenditure of industry i that is embodied in the final demand for the commodity produced by industry j (Chang and Shih, 2005).
Since it is interesting to compare technological systems with regard to their structural elements, it is necessary to eliminate the scale effects resulting from differences in the size of industries. In the absence of a suitable relativization, matrices of absolute innovation flows are affected by the scale of the sectoral innovative efforts of the correspondent innovation system (Montresor and Marzetti, 2009). The fact that the most intensive innovation systems turn out to be the most cohesive ones in terms of absolute innovation flows would lead to a misleading comparison of structure between two or more innovation systems.
In order to get rid of the scale effect, different procedures have been applied to determine relative innovation flows. Leoncini et al. (1996; 2000; 2001; 2005) dealt with the problem by using methods based on dividing the elements of each column/row by the relative total. A relative version of matrix R, Rrel , is obtained either by column normalization or by row normalization, defined as:
ˆ 1 R fRrel , column normalization;
R
rel
g
ˆ
1R
, row normalization (2)by column of R; and
g
ˆ
is the diagonal matrix of total innovation diffusion,which is the sum by row of R. The relative matrix of normalized intersectoral innovation flows obtained by the former technique is called “relative acquisition approach (RAA),” and that by the latter transformation is called “relative diffusion approach (RDA).”
The Rrel matrix exhibits a valued network, which denotes that the interactions of the network measure linkages with different magnitudes and therefore need to be dichotomized (Leoncini et al., 1996). Therefore, the Rdic matrix comprises 1’s and 0’s if the cell of matrix Rrel is to exceed the cut-off value v:
0
dic ij
R
ifR
ijrel
v
,R
ijdic
1
ifR
ijrel
v
(3)Therefore, the Rdic matrix can be used to produce several indicators of network analysis to describe technological systems. First, Leoncini et al. (1996) used network density as an index of the systemic connection of a technological innovation system. Network density as composed by n nodes is defined as the proportion of the number of existing linkages (l) to the maximum possible number of linkages (Scott, 1991):
1
n
n
l
D
(4)The network density corresponding to a technological system is assumed to be able to measure its strength of internal connection. Namely, the higher the density of the network, the more connected the technological system, and vice versa (Leoncini and Montresor, 2000).
Second, the indicator of centrality is used to gain the positional characteristics of an actor in a network. The indegree (Cin) and outdegree (Cout) of Freeman degree centrality (Scott, 1991) of a given sector are defined as:
ini
in
r
C
;C
outi
r
out (5)International Journal of Business and Information
sector exhibits whether this sector is a source, core, or a receiver of innovation flows (Chang and Shih, 2005).
Third, the indicator of centralization is produced by combining each actor’s centrality, and can measure the scale of structural hierarchy of technological systems at the system-wide level. The inward (Hin) and outward (Hout) degrees of centralization are defined as:
1
2
*
n
n
C
C
H
i i in i inin ;
1
2
*
n
n
C
C
H
i i out i outout (6)
Here, i*
in
C and i*
out
C
represent the indegree and outdegree centralities of themost central sector, i*. A high centralization index indicates a very hierarchic system that, corresponding to technological systems, is less conducive to interactive innovation diffusion than a low centralization system with an evenly distributed structure (Leoncini et al., 1996).
2.2. Scale Effects
To get rid of scale effects, Leoncini et al. (1996) included the matrix R for normalization into a relative matrix, Rrel, using either RAA or RDA. In a matrix of normalized intersectoral innovative acquisitions, the general element rel
ij
R
indicates the incidence of innovative acquisitions from sector i on total acquisitions for sector j. In a matrix of normalized intersectoral innovative diffusion, the element rel
ij
R
indicates the incidence of diffusion to sector j on total diffusion for sector i.Implication 1a: The indegree of centrality of sectors is “normalized” through RAA, so that the sectors with a big indegree of centrality actually may become smaller in degree while those with a small indegree of centrality actually may become bigger in degree.
Implication 1b: The outdegree of centrality of sectors is “normalized” through RDA, so that the sectors with a big outdegree of centrality actually may become smaller in degree while those with a small outdegree of centrality actually may become bigger in degree.
Implication 2a: RAA normalizes the distribution of inward centralities so that the inward degree of centralization obtained by RAA becomes smaller than in reality.
Implication 2b: RDA normalizes the distribution of outward centralities so that the outward degree of centralization obtained by RDA becomes smaller than in reality.
Implication 3a: In RAA, the quantity of the principal element compared with the other elements in a given column of R matrix is a major determinant of whether this sector is a key receiver of innovation flows.
Implication 3b: In RDA, the quantity of the principal element compared with the other elements in a given row of R matrix is a major determinant of whether this sector is a key source of innovation flows.
2.3. Unit Value Matrix: An Alternative Approach
To overcome the scale effects and avoid the flaws caused by the data transformation of normalization, we propose an alternative approach; that is, constructing a unit value matrix of product-embodied R&D flows, to substitute for the relative matrix Rrel. This alternative approach is called the “unit value approach (UVA).” The unit value matrix Runit is defined as:
ˆ
1
1ˆ
r
x
I
A
International Journal of Business and Information
This equation can generate the comparative criterion based on per dollar of each sector’s final demand. The general element unit
ij
R
of the unit value matrixrepresents direct and indirect R&D expenditure performed by industry i, embodied in one dollar of final demand for the commodity of industry j. Based on the identical criterion, the unit value matrix, Runit, is assumed to be more
effective as the data source for the network analysis of intersectoral innovation flows than the relative acquisition matrix or the relative diffusion one.
3. EMPIRICAL COMPARISON OF APPROACHES
This section uses the data of Taiwan’s input-output table and sectoral R&D expenditure to conduct an empirical comparison of RAA, RDA, and UVA in order to identify which approach better reflects the real phenomena of intersectoral innovation flows in Taiwan. The input-output table and sectoral R&D expenditure of Taiwan are sourced from the Taiwan Input-Output Table (Directorate-General of Budget, 2002), and Economic Statistics Annual of Taiwan (Ministry of Economic Affairs, 2001), respectively. In addition, we examine 21 manufacturing sectors (Table1a and 1b), which are reclassified in vertically integrated industries, as shown in the Appendix.
International Journal of Business and Information
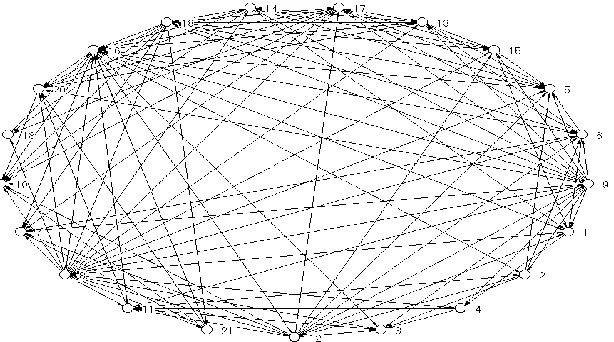
Figure 1a: Network Graph of Intersectoral Innovation Flows in Taiwan by the Relative Acquisition Approach (RAA)
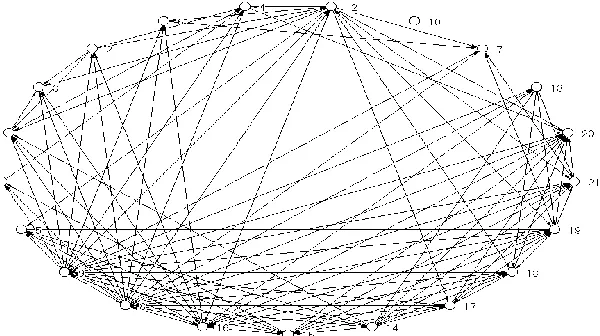
Figure 1c. Network Graph of Intersectoral Innovation Flows in Taiwan by the Unit Value Approach (UVA)
The following section uses these quantitative outcomes and a qualitative assessment of Taiwan’s intersectoral innovation flows to clarify the implications noted in the preceding section.
Evidence of Implication 1a
International Journal of Business and Information
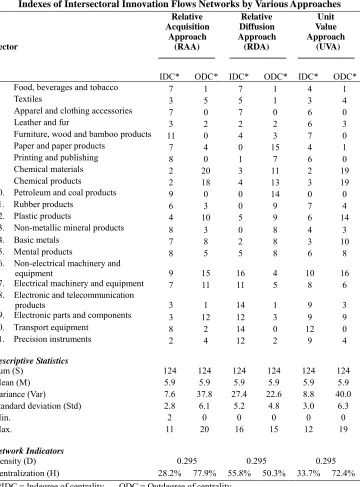
Table 2
Indexes of Intersectoral Innovation Flows Networks by Various Approaches
Sector Relative Acquisition Approach (RAA) Relative Diffusion Approach (RDA) Unit Value Approach (UVA)
IDC* ODC* IDC* ODC* IDC* ODC*
1. Food, beverages and tobacco 7 1 7 1 4 1
2. Textiles 3 5 5 1 3 4
3. Apparel and clothing accessories 7 0 7 0 6 0
4. Leather and fur 3 2 2 2 6 3
5. Furniture, wood and bamboo products 11 0 4 3 7 0
6. Paper and paper products 7 4 0 15 4 1
7. Printing and publishing 8 0 1 7 6 0
8. Chemical materials 2 20 3 11 2 19
9. Chemical products 2 18 4 13 3 19
10. Petroleum and coal products 9 0 0 14 0 0
11. Rubber products 6 3 0 9 7 4
12. Plastic products 4 10 5 9 6 14
13. Non-metallic mineral products 8 3 0 8 4 3
14. Basic metals 7 8 2 8 3 10
15. Mental products 8 5 5 8 6 8
16. Non-electrical machinery and
equipment 9 15 16 4 10 16
17. Electrical machinery and equipment 7 11 11 5 8 6
18. Electronic and telecommunication
products 3 1 14 1 9 3
19. Electronic parts and components 3 12 12 3 9 9
20. Transport equipment 8 2 14 0 12 0
21. Precision instruments 2 4 12 2 9 4
Descriptive Statistics
Sum (S) 124 124 124 124 124 124
Mean (M) 5.9 5.9 5.9 5.9 5.9 5.9
Variance (Var) 7.6 37.8 27.4 22.6 8.8 40.0
Standard deviation (Std) 2.8 6.1 5.2 4.8 3.0 6.3
Min. 2 0 0 0 0 0
Max. 11 20 16 15 12 19
Network Indicators
Density (D) 0.295 0.295 0.295
Centralization (H) 28.2% 77.9% 55.8% 50.3% 33.7% 72.4%
Evidence of Implications 1a and 1b
Sector 10 (petroleum and coal products) is supposed to be isolated within Taiwan’s technological diffusion network owing to the very weak R&D intensity of this sector (the weakest sector in this regard) and its lack of active interaction with other sectors. This phenomenon is confirmed by the centrality analysis of UVA, which shows that the indegree and outdegree of the sector are both zero, whereas RAA reveals that this sector is a key receiver of innovation flows (indegree=9), and RDA indicates that it is a key source of innovation flows (outdegree=14).
Evidence of Implication 2a
Comparing the inward degree of centralization obtained by the three approaches, RAA obtains the smallest value (Hin,RAA=28.2%;
Hin,RDA=55.8%; Hin,UVA=33.7%). The evidence demonstrates that RAA
obtains smaller values of inward centralization, resulting from the normalized distribution of inward centralities. Therefore, RAA normalizes the distribution of inward centralities so that the inward degree of centralization obtained by RAA becomes smaller than that in reality.
Evidence of Implication 2b
The outward degree of centralization obtained by RDA is the smallest among the three approaches (Hout,RAA=77.9%; Hout,RDA=50.3%;
Hout,UVA=72.4%), confirming that RDA normalizes the distribution of
outward centralities and thus reduces the real value of the outward degree of centralization. Therefore, RDA normalizes the distribution of outward centralities so that the outward degree of centralization obtained by RDA becomes smaller than that in reality.
Evidence of Implication 3a
International Journal of Business and Information
(refer to Table 1); thus, the two sectors can become key receivers of innovation flows in Taiwan through RAA.
In contrast, UVA shows that sectors 16 and 20 (transport equipment) are the key receivers of innovation flows in Taiwan. Sector 16, because of its importance as a production tool, is not only a key receiver of innovation flows in Taiwan (indegree=10), but also a major source (outdegree=16), acting as a core, demonstrated by UVA. Meanwhile, sector 20 is a kind of “final-use” product, and thus UVA demonstrates that it absorbs 12 innovative inputs but has no output. Additionally, the principal elements of sectors 16 and 20 are also extremely large compared with the other elements in their relative columns, particularly for sector 20, showing that the outcomes of UVA can avoid the effect of principal elements.
Evidence of Implication 3b
RDA reveals that the primary two sources of innovation flows in Taiwan are sectors 6 (paper and paper products; outdegree=15) and 10 (petroleum and coal products; outdegree=14). However, Taiwan lacks the raw materials for these two industries, making it impossible for sectors 6 and 10 to act as key innovation sources. The principal elements of sectors 6 and 10 are not very large compared with the other elements in their relative rows; consequently, RDA makes these two sectors key sources of innovation flows in Taiwan. UVA identifies sectors 8 (chemical materials; outdegree=19) and 9 (chemical products; outdegree=19) as key sources of innovation flows in Taiwan. The results of UVA are consistent with the leading position of the chemical industry in Taiwan, as well as the widespread use of chemical materials and products as production intermediates in many other Taiwanese industries.
The above evidences reveal the flaws of RAA and RDA, and moreover demonstrate that UVA better reflects the real phenomena of intersectoral innovation flows in Taiwan. Following RAA, the elements of each column have been divided by the relative column total. In this way, a relative matrix is obtained by column normalization, whose general element rel
ij
R
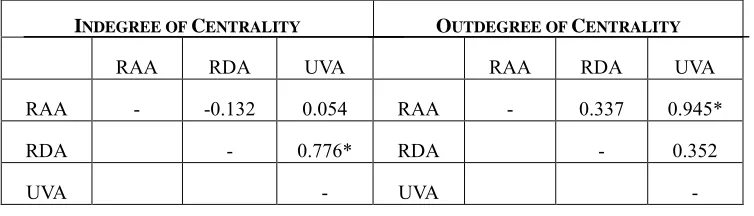
indicates forRAA produces a normalized distribution of constituent elements within a certain column of the intersectoral innovation flow matrix, and thus causes the indegree of centrality in RAA to misinterpret the original meaning of this indicator. As a result, the correlation coefficient of inward centralities between RAA and UVA is totally insignificant (r=0.054; see Table 3), while that of outward centrality between the two approaches is quite significant (r=0.945, p<0.0001). Following RDA, the elements of each row have been divided by the relative row total. In this way, a relative matrix is obtained by row normalization, whose general element rel
ij
R
indicates for sector i the incidence of its diffusion to sector j on its total diffusion.RDA is symmetrically influenced in terms of the outdegree of centrality. The correlation coefficient of outward centrality between the RDA and UVA is 0.352, whereas that of inward centrality between the two approaches is 0.776 (p<0.0001). Examination of the correlation coefficient also clarifies those flaws arising from RAA and RDA and reveals that UVA is a better approach.
Table 3
Correlation Coefficients Among the Centralities of Various Approaches
INDEGREE OF CENTRALITY OUTDEGREE OF CENTRALITY
RAA RDA UVA RAA RDA UVA
RAA - -0.132 0.054 RAA - 0.337 0.945*
RDA - 0.776* RDA - 0.352
UVA - UVA -
* p<0.0001
4.
CONCLUDING REMARKS
International Journal of Business and Information
input-output analysis and network analysis has been widely used recently to address technological diffusion flows. Studying intersectoral innovation diffusion proxied by product-embodied R&D flows is the crucial first step to exploring national technological systems based on available data and system-level examination. Consequently, the topic of intersectoral innovation flows has attracted the attention of researchers of institutional economics and innovation.
With respect to this research methodology, the most critical and first encountering issue is how to get rid of the scale effect from which matrices suffer. Leoncini et al., among others, used the data transformation of matrix normalization to deal with this issue. The methodologies they used to eliminate scale effects, however, are impaired by inappropriate data transformation owing to differences in industry and country size. As a consequence, the indicators of network analysis produce flawed results.
APPENDIX:
Manufacturing Sectors in Taiwan
Sector Description
1 Food, beverages, and tobacco
2 Textiles
3 Apparel and clothing accessories 4 Leather and fur
5 Furniture, wood and bamboo products 6 Paper and paper products
7 Printing and publishing 8 Chemical materials 9 Chemical products
10 Petroleum and coal products 11 Rubber products
12 Plastic products
13 Non-metallic mineral products 14 Basic metals
15 Mental products
16 Non-electrical machinery and equipment 17 Electrical machinery and equipment 18 Electronic and telecommunication products 19 Electronic parts and components
International Journal of Business and Information
REFERENCES
Breschi, S., and F. Malerba. 1997. Sectoral innovation systems: technological regimes, Schumpeterian dynamics, and spatial boundaries, In: C. Edquist, (ed.), Systems of Innovation: Technologies, Institutions and Organizations, London: Pinter Publishers.
Carlsson, B.; S. Jacobsson; M. Holmen; and A. Rickne. 2002. Innovation systems: analytical and methodological issues, Research Policy 31, 233-245.
Chang, P.-L.; and H.-Y. Shih. 2005. Comparing patterns of intersectoral innovation diffusion in Taiwan and China: A network analysis, Technovation 25, 155-169. DeBresson, C. 1996. Why innovative activities cluster, In C. DeBresson, (ed.), Economic
Innovative Activities. An Input-Output Analysis, 149-165. Cheltenham: Edward Elgar.
Directorate-General of Budget. 2002. Input-Output Tables, Taiwan Area, the Republic of China. Taipei: Directorate-General of Budget, Accounting and Statistics.
Drejer, I. 2000. Comparing patterns of industrial interdependence in national systems of innovation – a study of Germany, the United Kingdom, Japan and the United States, Economic Systems Research 12, 377-399.
Hekkert, M.P.; R.A.A. Suurs; S.O. Negro; S. Kuhlmann; and R.E.H.M. Smits. 2007. Functions of innovation systems: A new approach for analysing technological change, Technological Forecasting & Social Change 74(4), 413-432.
Leoncini, R. 1998. The nature of long-run technological change: Innovation, evolution and technological systems, Research Policy 27, 75-93.
Leoncini, R.; M.A. Maggioni; and S. Montresor. 1996. Intersectoral innovation flows and national technological systems: network analysis for comparing Italy and Germany, Research Policy 25, 415-430.
Leoncini, R., and S. Montresor. 2000. Network analysis of eight technological systems, International Review of Applied Economics 14 (2), 213-234.
Leoncini, R., and S. Montresor. 2001. The automobile technological systems: An empirical analysis of four European countries, Research Policy 30, 1321-1340. Leoncini, R., and S. Montresor. 2005. Accounting for core and extra-core relationships in
technological systems: A methodological proposal, Research Policy 34, 83-100. Lundvall, B.A. (ed.) 1992. National Systems of Innovation: Towards a Theory of
Innovation and Interactive Learning, London: Pinter Publishers.
Metcalfe, S. 1995. The economic foundations of technology policy: Equilibrium and evolutionary perspectives, In: P. Stoneman (ed.) Handbook of the Economics of Innovation and Technological Change, Oxford: Blackwell Publishers.
Ministry of Economic Affairs. 2001. Economic Statistics Annual, Taiwan Area, the Republic of China, Taipei: Department of Statistics, Ministry of Economic Affairs. Montresor, S., and G.V. Marzetti. 2008. Innovation clusters in technological systems: A
network analysis of 15 OECD countries for the mid-1990s, Industry and Innovation 15(3), 321-346.
Montresor, S., and G.V. Marzetti. 2009. Applying social network analysis to input-output based innovation matrices: An illustrative application to six OECD technological systems for middle 1990s, Economic Systems Research 21(2), 129-149.
Nelson, R.R. (ed.) 1993. National Innovation System: A Comparative Analysis, Oxford: Oxford University Press.
Papaconstantinou, G.; N. Sakurai; and A. Wyckoff. 1998. Domestic and international product-embodied R&D diffusion, Research Policy 27, 301-314.
Park, Y.T., and M.S. Kim. 1999. A taxonomy of industries based on knowledge flow structure, Technology Analysis & Strategic Management 11, 541-549.
Patel, P., and K. Pavitt. 1994. National innovation system: Why they are important and how they might be measured and compared, Economics of Innovation and New Technology 3, 77-95.
Peeters, L.; M. Tiri; and A. Berwert. 2001. Identification of techno-economic clusters using input-output data: application to Flanders and Switzerland, In: OECD (ed.) Innovative Clusters: Drivers of National Innovation Systems, Paris: OECD.
Porter, M.E. 1990. The Competitive Advantage of Nations. New York: Free Press. Sakurai, N.; G. Papaconstantinou; and E. Ioannidis. 1997. Impact of R&D and technology
diffusion on productivity growth: empirical evidence for 10 OECD countries, Economic Systems Research 9, 81-109.
Scott, J. 1991. Social Network Analysis: A Handbook, London: Sage Publications. Weng, C.S.; W.Y. Chen; H.Y. Hsu; and S.H. Chien. 2010. To study the technological
network by structural equivalence, Journal of High Technology Management Research 21(1), 52-63.
ABOUT THE AUTHORS
Hsin-Yu Shih is an associate professor in the Department of International Business Studies, National Chi Nan University of Taiwan. His previous articles have appeared in
the Technological Forecasting and Social Change, Technovation, Psychology and
International Journal of Business and Information Journal of e-Business, among others. His current research interests are in the areas of
technology management and science and technology policy.
Pao-Long Chang is a professor in the Department of Business Administration, Feng Chia University, Taiwan. His previous articles have appeared in the Journal of the Operational Research Society, Journal of Environmental Management, Computers and Operations Research, Industry and Innovation, International Journal of Production Economics, Technovation, International Journal of Technology Management, IEEE
Transactions on Engineering Management and IEEE Transactions on Semiconductor
Manufacturing, among others. His current research interests are in the areas of