Volume 46, 2012 131 reif, f. (2008). Applying Cognitive Science to Education. Thinking and Learning in Scientific and Other
Complex Domains. cambridge, massachusetts: mit press.
rumelhart, d., & mcclelland, J. (1986). parallel distributed processing, Vol. 1 & 2., cambridge: mit press.
schön, d. a. (1983). The reflective Practitioner – How professionals think in action. london: temple. Varela, f. J. (1990). Kognitionswissenschaft - Kognitionstechnik. Eine Skizze aktueller Perspektiven.
frankfurt am main: suhrkamp.
Vygotsky, l. s. (1978). Mind in Society. The Development of Higher Cognitive Processes. cambridge, massachusetts: harvard university press.
Wertheimer, m. (1982). Productive Thinking. chicago: university of chicago press. Zimbardo, p. G. (2004, 16. auflage). Psychologie – Eine Einführung. pearson studium.
Advised by Vincentas Lamanauskas, University of Siauliai, Lithuania, Lithuania
received: May 11, 2012 accepted: August 25, 2012
Brigitte Römmer-Nossek MSc., Center for Teaching and Learning/ CTL, University of Vienna, Dr.-Karl-Lueger-Ring 1, 1010 Vienna, Austria.
E-mail:� [email protected]
DeVelopINg SpatIal VISualIzatIoN
wIth 3D MoDelINg
Andrej Šafhalter Primary School Anice Černejeve Makole, Slovenia
e-mail: [email protected]
Srečko Glodež, Karin Bakračevič Vukman University of Maribor, Slovenia e-mail: [email protected], [email protected]
Abstract
The research was carried out in 2011 among 22 pupils from14 – 15years old. The purpose of the pilot study was to determine the influence of 3D modeling on the spatial visualization of pupils, as well as the gender difference in the spatial visualization of the tested pupils and the progress of this visualization in individual genders. In addition, it tried to determine whether the sensory style of the pupils, visual, auditory or kinesthetic, influences spatial perception and the development of spatial visualization. Pupils were divided into two groups, the test group and the control group. Pupils in the test group attended a 3D modeling extra-curricular activity for twelve teaching hours in the second evaluation period of the 2010/2011 school year. Spatial visualization was determined with a modified spatial visualization test, namely before the extra-curricular activity and afterwards. The modified test consisted of different spatial visualization tests: PSVT: R, MCT, MRT, DAT: SR, and tests of rotation within a plane. For 3D modeling exercises pupils used the open-source software Google SketchUp. None of the tested pupils have encountered the mentioned software before.
After a second testing, the test group showed greater progress in solving spatial visualization tasks in comparison with the control group, while gender differences were minimal. The results of the spatial visualization test were also compared with the sensory style of pupils, which was filled out by all the pupils included in the study.
In the 2011/2012 school year a broader study is underway, involving almost two hundred pupils of various elementary schools in Slovenia.
Key words: spatial visualization, 3D modeling, perception styles.
Introduction
during the review of the research regarding the connection between the 3d modeling and the spatial visualization we can find some authors, who have taken an interest in this topic. people, who have a god spatial visualization have a better developed space intelligence, which is after Gardner one of many intelligences.
the ability of visualization. the spacial ability should manifest the most in elementary tasks of the mental rotation, the ability of vizualisation however should come to expression in more complex tasks of the construction of three-dimensional and two-dimensional objects from
composed parts or with tasks of ascertaining the results of the rotations in space (Pogačnik,
1995).
some authors state, that there is a connection between the technical drawing and the space reception (alias, black, Gray, 2002; contero, naya, company, saorin, 2006).
it was also established, that the 3d modeling influences the development of the space reception of students (martin-dorta, saorin, contero, 2008). the researches have been carried out with students, who have used the software Google sketchup for the 3d modeling. men and women as well have been included, because they have determined also the differences between sexes. the tests which determined, that the 3d modeling had a positive influence on the space reception of students, were carried out in two periods. men achieved slightly better results.
at the other side there are researches that investigate how space reception influences the effective learning of 3d modelling (sorby, 2006).
based on some statements men have a better developed space reception, which could be based upon the view of the evolutional development, because people and other primates have lived in groups long ago and in searching for food, what was mostly done by men, the space reception had a visible role. (Gardner, 1983; Kolbl, Whishaw, 2003).
other authors have found out that the differences between sexes in the understanding of space reception are very small or even nullity. (burin, delgado, prieto, 2000).
regarding the differences in the reception people differ according to which sensual impression or sense organ (eyesight, hearing, sense of touch, …) they give priority by reception or presentation. the style of reception is named after those characteristics of an individual, how he accepts, preserves, remodels and organizes information and based on them he solves
the problems. Based it is a division on visual, auditory and kinestetic style (Marentič Požarnik,
2000)
Methodology of Research
General Research Characteristics
in the school year 2010/2011 a quantitative research was carried out between 22 students of the 9th class. the age of the students was 14 – 15 years, 10 of them were male (45%), 12 females (55%). among these students 14 represented the experimental group, 8 students however represented the control group. fourteen students of the experimental group visited 12 pedagogical lessons of interest activity 3d modeling. all students met the 3d modeling, for which a free of charge software Google sketchup was chosen, for the first time. the students were modeling based on an isometric projection, a perpendicular projection and objects from the environment. at first they were modeling simple objects, later they went over to drawing objects of more complex shapes. all 22 students were tested twice, in december 2010 and in may 2011. in both periods they solved a modified test of spatial visualization.
Instrument
of education in the 21st century Volume 46, 2012 133
rotations), mrt (mental rotation test) and dat: sr (differential aptitude test: space relations) and tests of rotations and composing figures on flat surface.
With the questionnaire: your style of learning and thinking it was established in which perception type we can classify the individual student. in this questionnaire the students assessed every one of the 32 statements from 1 (almost never) to 5 (almost always). the statements referred to their way of learning, thinking, communicating.
Data Analysis
based on the results of both tests of spatial visualisation of the experimental and the control group the influence of 3d modeling on the improvement of spatial visualization of the students was researched. at the same time the influence of the sex on the solving of the test of spatial visualization and the possible differences in development of it was established.
at the end of the questionnaire: your style of learning and thinking the marks are written in a chart, and based on them we get the results, which tell us, what perception type (visual, auditory or kinaesthetic) prevails over by a particular student. these facts help by the analysis and the ascertainment of the possible connection between the reception style and the understanding and the developing of the spatial visualization because of the 3d modeling.
Results of Research
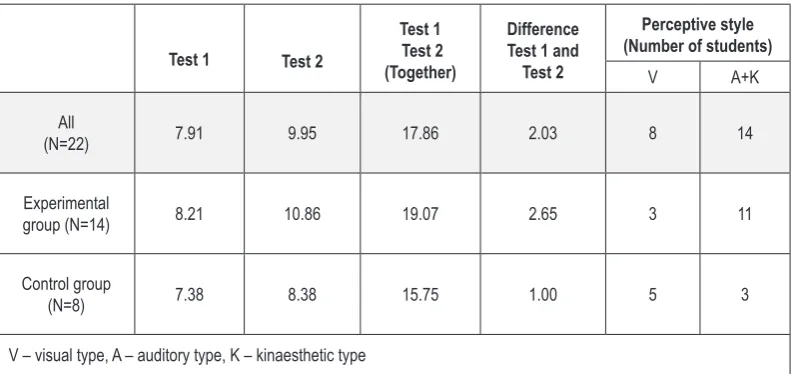
out of all acquired facts the average values of the achieved points, which are shown in the table 1 are calculated. also the average difference of the achieved points between test 1 and test 2 is calculated. there are also gathered facts about the number of students who belong to the visual perception style and also to other perceptional styles.
Table 1. Collection of results and the number of achieved points at the tests of spatial visualization and at the questionnaire about the perception styles of the student.
Test 1 Test 2
Test 1 Test 2 (Together)
Difference Test 1 and
Test 2
Perceptive style (Number of students)
V A+K
All
(N=22) 7.91 9.95 17.86 2.03 8 14
Experimental
group (N=14) 8.21 10.86 19.07 2.65 3 11
Control group
(N=8) 7.38 8.38 15.75 1.00 5 3
V – visual type, A – auditory type, K – kinaesthetic type
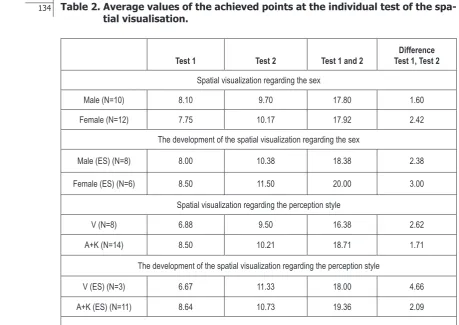
tial visualisation.
Test 1 Test 2 Test 1 and 2 Test 1, Test 2Difference
Spatial visualization regarding the sex
Male (N=10) 8.10 9.70 17.80 1.60
Female (N=12) 7.75 10.17 17.92 2.42
The development of the spatial visualization regarding the sex
Male (ES) (N=8) 8.00 10.38 18.38 2.38
Female (ES) (N=6) 8.50 11.50 20.00 3.00
Spatial visualization regarding the perception style
V (N=8) 6.88 9.50 16.38 2.62
A+K (N=14) 8.50 10.21 18.71 1.71
The development of the spatial visualization regarding the perception style
V (ES) (N=3) 6.67 11.33 18.00 4.66
A+K (ES) (N=11) 8.64 10.73 19.36 2.09
V – visual type, A – auditory type, K – kinaesthetic type, ES – experimental group
of education in the 21st century Volume 46, 2012 135
Figure 1: The development of the spatial visualization because of the 3D model -ling.
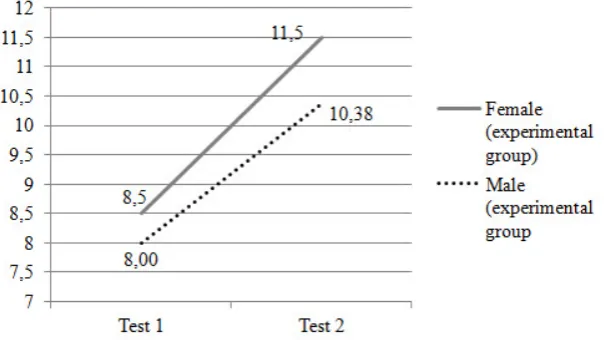
at the comparison of the progress of spatial visualisation regarding sex from the statistic view there are no essential differences. some higher average value of points was at the tests achieved by women. based on the levenov test about the equality of variance by 5% degree of characteristic it was ascertained, that at the comparison of the progress of spatial visualisation between sex the significance is 0.93>0.05. the p-value significance of the average equality the 2-tailed significance is 0.50>0.05, which means that there are no characteristic statistical differences between men and women by the progress of spatial visualisation because of the 3d modeling.
Figure 2: The development of the spatial visualization because of the 3D mod -eling regarding the sex.
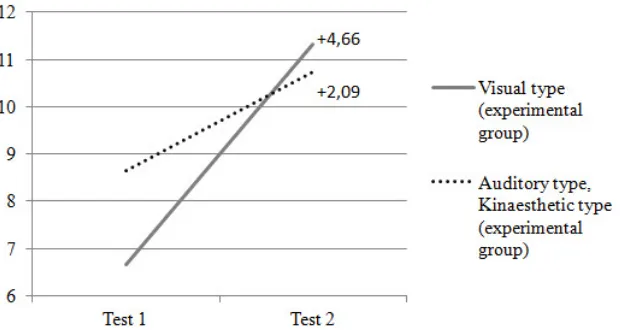
Figure 3: The development of the spatial visualization because of the 3D mod -eling regarding the perception type of the student.
Discussion
at the described research there was at the field of spatial visualisation a certain progress noticed, but there is not enough statistical evidence. the eventual limitations can before all depend on a small sample (22 students; 14 - experimental group, 8 - control group) and a relative small amount of hours (12) of 3d modeling activity. With a longer training better results could be expected or a bigger progress at the field of spatial visualisation could be achieved.
another influence at the spatial visualisation and on the development of it can be the perception style of the student and the susceptibility of solving spatial problems (the spatial intelligence). it can be concluded, that the perception style influences the solving of tasks with spatial problems, where the students with the visual perception style have better orientation. despite all this, there must be known, that the persons cannot be strictly classified into one category, because some of them show their type but with the others the types are interweaved and the differences are smaller.
there are no essential differences between sexes, which can be also seen at the researches by other authors. but some come to the conclusions, that the spatial visualisation because of some reasons mentioned at the introduction is more developed by men.
Conclusions
in the school year 2011/2012 a similar research is carried out and there are almost two hundred students from different slovene primary schools involved. so the analysis at a much greater sample will be possible and the comparison with the described pilot research.
References
alias, m., Gray, d. e., black, t. r. (2002). attitudes towards sketching and drawing and the relationship with spatial Visualisation ability in engineering students. International Education Journal, 3 (3), 165-175.
of education in the 21st century Volume 46, 2012 137 burin, d. i., delgado, a. r., prieto, G. (2000). solution strategies and gender differences in spatial
visualization tasks. Psicologica, 21 (002), 275-286.
contero, m., naya, f., company, p., saorin, J. l. (2006). learning support tools for developing spatial abilities in engineering design. International Journal of Engineering Education, 22 (3), 470-477
Čop, J. (2008). Mapa učnih dosežkov. Ljubljana: Center RS za poklicno izobraževanje.
Gardner, h. (2010). Razsežnost uma: Teorija o več inteligencah. Ljubljana: Založba Tangram.
Kolb, b., Whishaw, i. Q. (2003). Fundamentals of Human Neuropsychology, Fifth Edition. new york: Worth publishers.
labinowicz, e. (2010). Izvirni Piaget. ljubljana: dZs d.d.
Marentič Požarnik, B. (2000). Psihologija učenja in pouka. ljubljana
martin-dorta, n., luis saorin, J., contero, m. (2008). development of a fast remedial course to improve the spatial abilities of engineering students. Journal of Engineering Education, 97 (4), 505–513.
newton, p., bristoll, h. (2012). Spatial Ability, Practice Test 1. psychometric success. retrieved 10 may 2012, from http://www.psychometric-success.com/practice-papers/psychometric%20success%2 0spatial%20ability%20-%20practice%20test%201.pdf
Pogačnik, V. (1995). Pojmovanje inteligentnosti. radovljica: didakta.
sorby, s. a. (2006). do spatial abilities impact the learning of 3-d solid modeling software? American Society for Engineering Education. retrieved 03.04.2012, from http://soa.asee.org/paper/ conference/paper-view.cfm?id=2436
titze, c., heil, m., Jansen, p. (2008). Gender differences in the mental rotations test (mrt) are not due to task complexity. Journal of Individual Differences, 29 (3), 130-133.
Advised by Eleonora Melnik, Karelian State Pedagogical Academy, Republic of Karelia,Eleonora Melnik, Karelian State Pedagogical Academy, Republic of Karelia, Russia
received: May 11, 2012 accepted: August 23, 2012
Andrej Šafhalter Teacher, Primary school Anice Černejeve Makole, Makole 24, 2321 Makole, Slovenia.
E-mail:� [email protected] Website:� http:�//www.os-makole.si
Srečko Glodež PhD, Professor, University of Maribor, Faculty of Natural Sciences and
Math-ematics, Department of Technical Education , Koroška 160, 2000 Maribor, Slovenia.
E-mail:� [email protected] Website:� http:�//tehnika.fnm.uni-mb.si
Karin Bakračevič Vukman Professor, Department of Psychology, Faculty of Arts, University of Maribor, Koroska 160, 2000 Maribor, Slovenia.