INTRODUCTION
Currently, the indoor air pollution is the most significant aspect in the environmental philoso-phy. As the years progressed, man constructed buildings to shield himself from the components, intended to keep out the rain and snow, warm him-self in the winter and cool in the mid-year. People usually live, work and spend up to 90 percent of their time indoors. As opposed to holding natural risks under control, the man found himself inside in a substance having contaminants that may even hurt him (Burroughs & Hansen, 2011). Buildings do not generally provide protection to the inhab-itants against being subjected to the contamina-tion. Just the opposite, the molds, parasites, and harmful gases caught or developing within build-ings may greatly surpass those outside. By pro-tecting ourselves from the outdoor conditions, we have made an inside domain with a radically
new arrangement of issues (Burroughs & Hansen, 2011). It is perceived that the introduction to air pollutants found indoors impacts a part of hu-man health. In the developed world, a notewor-thy extent for our time will be used indoors, the place where defenseless individuals such as, for example, adolescent kids and the elderly could re-side for up to 100% of their time. The presentation focuses on fluctuations, relying upon a number of variables, including the individuals’ conduct technique. Moreover, activities, pollutant sources, and geological area were taken into consideration (Coggins, Semple, & Hurley, 2013).
Problematic overview
In Iraq, the cafes, which are not subjected to the control of health legislation on the one hand, and are characterized by the absence of engineer-ing design standards from the other side, become
Accepted: 2019.02.16 Available online: 2019.03.01 Volume 20, Issue 4, April 2019, pages 256–261
https://doi.org/10.12911/22998993/104913
Evaluation of the Dispersion of Nitrogen Dioxide and
Carbon Monoxide in the Indoor Café – Case Study
Ammar A. Al-Sultan
1*, Ghufran F. Jumaah
1, Faris H. Al-Ani
11 Civil Engineering Department, University of Technology, Baghdad, Iraq * Corresponding author’s e-mail: [email protected]
ABSTRACT
A popularity café in Baghdad city was chosen to measure the dispersion of nitrogen dioxide (NO2) and carbon monoxide (CO) as examples of the Indoor Air Pollutants (IAPs) which are considered a significant environmental problem. The aims of this research were, firstly, to measure the variation of NO2 and CO concentrations; secondly, to examine the effect of the seasonal variation of indoor temperature (°C) and relative humidity (%) on the disper -sion of both NO2 and CO and finally to compare the results with those of the global standards. The volume of café was about 360 m3 and the number of smokers was about 25-35 smoker/day. This work was divided into two parts
where the first part includes the experimental work which comprised the measurement of NO2 and CO by GIGs devices. It was lasted about five months commencing from November 2017 to March 2018 and the readings were taken during two intervals at partial time and during peak time. The second part includes the analysis of obtained results and compared the results of those of the global standards for the Indoor Air Quality suggested by WHO, EPA, and European criteria in order to achieve the goals of this work. The results from this research have highlight
-ed a clear increase in the concentrations of NO2 and CO along with the growing numbers of smokers. Furthermore,
the concentrations of NO2 and CO were close to some global standard values of short-term exposure at peak time.
widespread. It is important for researchers to study the prevalence of the indoor air pollutants (IAPs) and assess the environmental impact of the coffee shops. The list of the issue or IAPs is long, tobacco smoke alone is known to contain 4,700 synthetic mixes, including a few that ap-pear to be exceedingly lethal in creature tests, and 43 presumed cancer-causing mixes (EPA, 2017b; Nadadur & Hollingsworth, 2015). This examination by EPA who published a white pa-per with a specific spotlight on the smoke or “environmental tobacco smoke” (ETS) (EPA, 2017b). Notwithstanding setting up ETS as a po-tential cancer-causing agent and an indoor con-taminant of worry for youthful and kids, the re-port incited the proposed OSHA decision of ‘94 and the resulting tobacco case and nearby juris-dictional controls. The ruling met with negative comments and was never promulgated. Howev-er, building owners united with local authorities and reacted with self-regulation and generally banned smoking in public spaces. Similarly, as a result, ETS may be longer be such a signifi-cant indoor contaminant to raise concerns (Bur-roughs & Hansen, 2011; EPA, 2017b).
Dispersion of NO2 and CO
The two most common oxides of nitrogen are nitrogen dioxide (NO2) and nitric oxide (NO). Both are dangerous gases with NO2 being a very receptive and destructive oxidant (EPA, 2017c). According to EPA, no standards have been settled upon for NOx in the indoor air (EPA, 2017c). Moreover, ASHRAE and the US-EPA National Ambient Air Quality Standards list 0.053 ppm as the average 24-hour limit for NO2 in the outdoor air (EPA, 2017c). WHO has reported a rationale of the indoor NO2 concentration. As an air pollut-ant, NO2 has different parts, which are regularly troublesome or in some cases difficult to isolate from each other (WHO, 2005). Animal and hu-man exploratory examinations show that NO2, at the concentrations surpassing 200 µg/m3 or 0.134
ppm for 1-hour mean, is a harmful gas with huge impacts on wellbeing. The animal toxicological examinations additionally proposed that long haul introduction to NO2 at elevated the concen-trations has unfavorable impact (WHO, 2005).
One the other hand, carbon monoxide (CO) is an odorless, colorless and extremely toxic gas. Since it is difficult to see, taste or notice , CO can kill people before they realize it is present (EPA,
2017a; Nadadur & Hollingsworth, 2015). The im-pacts of CO introduction can fluctuate enormous-ly from individual to another contingent upon age, general wellbeing and the focus and length of exposure (EPA, 2017a).
There are many standards that limited the in-door CO concentration. The Occupational Safe-ty and Health Administration (OSHA) permis-sible exposure limit (PEL) for carbon monoxide to be 50 ppm parts of air (55 µg/m3) as an 8-hour
time-weighted average (TWA) concentration (EPA, 2017a).
The National Institute for Occupational Safety and Health (NIOSH) has established a recommended exposure limit (REL) for carbon monoxide of 35 ppm or 40 µg/m3 as an 8-hour
TWA and 200 ppm (229 µg/m3) as the upper
lim-it [NIOSH 1992]. The NIOSH limlim-it is based on the risk of cardiovascular effects (EPA, 2017a). [ACGIH TLV] The American Conference of Governmental Industrial Hygienists (ACGIH) has assigned carbon monoxide a threshold limit value (TLV) of 25 ppm (29 µg/m3) as a TWA for
a normal 8-hour workday and a 40-hour work-week [ACGIH 1994, p. 15].
Additionally, ACGIH limit is based on the risk of elevated carboxyhemoglobin levels [ACGIH 1991, p. 229] (EPA, 2017a). On the other hand, European Commission’s Standards Air Quality and Environment has limited the indoor CO con-centration to no more than 10 mg/m3 for maximum
daily 8-hours exposure (Commission, 2010).
Indoor air pollutants
The relative significance of any single source relies upon the amount of a given contamination it transmits and how perilous those discharges are. For instance, a poorly balanced gas stove can transmit fundamentally more carbon monoxide than one that is legitimately balanced (Nadadur & Hollingsworth, 2015). A few sources, for example, building materials, furniture and items like deodor-izers can discharge poisons persistently. Different sources, identified with exercises like smoking, cleaning, rearranging or doing totters discharge contaminations irregularly. Unvented or malfunc-tioning machines or improperly utilized items can discharge higher and in some cases hazardous lev-els of pollutants indoors (EPA, 2017b).
Indoor Air pollution can happen by the fol-lowing ways (Saha, Kamyotra, & Khare, 2014):
• High temperature and humidity levels increase the concentrations of some pollutants.
• There are numerous sources of indoor air con-tamination in any home. These incorporate ignition sources, for example, oil, gas, lamp fuel, coal, wood, and tobacco items; building materials and decorations as various as weak-ened, asbestos-containing protection, wet or moist cover, and cabinetry or furniture made of certain squeezed wood items; items for fam-ily unit cleaning and upkeep, individual care, or leisure activities; cooling frameworks and humidification gadgets; and open-air sources, for example, radon, pesticides, and outside air contamination.
• Outdoor air goes in and out by penetration, characteristic ventilation, and mechanical ven-tilation. In a procedure known as penetration, wind streams enter the house through openings, joints, and breaks in dividers, floors, and roofs, and around windows and entryways. In regu-lar ventilation, the air travels through opened windows and entryways. The air development related to infiltration and normal ventilation is caused by the air temperature differences amongst inside and outside and by the wind.
• High pollutant concentrations can stay in the indoor air for significant periods of time.
• The pollution can originate from cleaning ar-ticles and housekeeping.
Classification of indoor air pollutants
Indoor environment contaminants into classi-fied by three groups (Saha et al., 2014; Spengler, McCarthy, & Samet, 2001) which are:
• Biological presentation: Allergens or microbiological;
• Chemical presentation: Dust, pressurized canned products or vapors;
• Physical presentation: Acoustic condition, mugginess, air development, warm conditions.
Research objectives
This study was set out to achieve the follow-ing objectives:
• Measurement of NO2 and CO levels in the café under study.
• Studying the effect of seasonal variation of both temperature (°C) and relative humidity (%) on the dispersion of NO2 and CO.
• Discussing the results with those of the global standards.
EXPERIMENTAL WORK
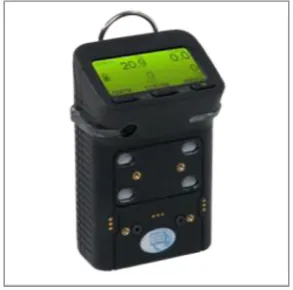
In this work, we divided the research into two parts. The first part included the experimen-tal work which consisted of measurement of NO2 and CO by using GIGs devices. It lasted about five months from November 2017 to March 2018. Firstly, calibration for the GIGs devices was done in the Division of the quality control and occupa-tional safety, Ministry of Industry and Minerals. Additionally, the experimental work has focused on the following tips:
• Selecting a popularity café situated in the Al-Gazalia sector, Baghdad city where this coffee shop was without ventilation control and no health monitoring as a worst case study.
• The café box volume was about 360 m3.
• The number of customers and smoking cus-tomers were about 35-50 per day and the num-ber of hookah users was 25-35 per day which may help to calculate the modeling of the IPAs dispersion.
• Taking the readings of the IAPs in a wide range of variation of time, temperature and % relative humidity.
the temperature (°C) and relative humidity (%) (Figure 2).
The second part includes the analysis of re-sults; hence, the study compared the results with the global standards for the Indoor Air Quality like WHO, EPA, and European Commission cri-teria in order to achieve the goals of this work.
Fig. 1. GIG, IAPs device measurement
Fig. 2. Electronic thermometer
Point of readings
Many previous works reported the locations of the reading points, where we noticed the need to take models at points far from oscillation (Hirt & Cook, 1972). We fixed the sampling point at the height of (2.0 m) in the center of the hall. This point was the best location, which can take the stable readings of GIG devices as well as the high density of the smoke.
Indoor temperature degree and relative humidity
Temperature and relative humidity are the most effective parameters that may contribute to the dispersion of the IAPs (Nadadur & Holling-sworth, 2015; Spengler et al., 2001). Therefore, we recorded a wide range of the readings. In this work, the variation of café temperature and rela-tive humidity was given in the Table 1.
RESULTS AND DISCUSSIONS
Variation of nitrogen dioxide with time, temperature, and relative humidity
Figures 3–5 show the variation of NO2 av-erage concentrations at the partial capacity and peak time capacity of the café for the first, second and third round, respectively. The periods of read-ings of the first, second, and third round were dis-played in the Table 1. From these figures, it seems that there was a marked increase in the concentra-tions of NO2 along with the growing numbers of smokers.
Figure 3 shows that the variation of NO2 aver-age concentrations for the first round at the par-tial capacity time was lesser than those of stan-dard, but the concentrations at the peak time were above the standard when the indoor temperature was about 30°C and the relative humidity was relatively high (35–37%).
Figures 4 and 5 represent the variation of NO2 average concentrations for the second and third rounds at the partial capacity time which were lesser than standard while the concentrations at the peak time were close to the standard. The av-erage indoor temperature of the second and third rounds was 25°C and the relative humidity was 25% and 22%, respectively.
These results reflect the increased NO2 con-centrations with a growing number of smokers, as well as an increase in the density of smoke in the absence of quality control through the presence of fresh air and ventilation (Daisey,
Table 1. Variation of the temperature and relative humidity during the rounds of sampling
Round Period Temp. (°C) Relative humidity (%)
1st September14-18, 2017 30 37
2nd March 1-4, 2018 25 27
Angell, & Apte, 2003). Another result regards the temperature of the café. High temperatures increased the speed of dispersion and spread of air pollutants. This finding is consistent with the results obtained by other researchers (Fang, Clausen, & Fanger, 1998; Wainman, J., Lioy, & Zhang, 2001).
Variation of carbon monoxide with time, temperature, and relative humidity
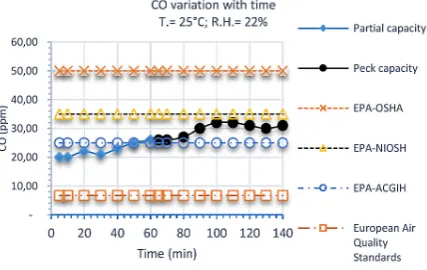
Figures from 6 to 8 show the contrast of CO average concentration with time. It is clear that the effect of increasing the number
of smokers, temperature degree, and relative humidity corresponds to the increasing CO concentration. The explanation is that the in-creasing number of smokers will lead to great-er intensity of the indoor smoke. Additionally, rising temperatures will increase the chance of dividing CO2 into CO and O. These results were supported in other studies (Fang et al., 1998; Klepeis, Ott, & Switzer, 1996). More-over, Figures 6–8 show exceeded CO concen-trations in relation to EPA and European stan-dards, and this indicates the hazard of this gas, especially for children and non-adults (Com-mission, 2010; EPA, 2017a).
Fig. 3. Variation of NO2 for the 1st round
Fig. 4. Variation of NO2 for the 2nd round
Fig. 5. Variation of NO2 for the 3rd round
Fig. 6. Variation of CO for the 1st round
Fig. 7. Variation of CO for the 2nd round
CONCLUSIONS
The following conclusions may be drawn from this work:
1. A positive relation was found between the in-crease in NO2 and CO and a growing number of smokers over time, especially at the peak time. 2. There was an increase in NO2 and CO
associ-ated with the increasing of indoor temperature, as the temperature increases the speed of dis-persion of IAPs as well as the chance of frag-mentation and molecules becoming relatively unstable are greater.
3. The results indicate a clear effect of relative hu-midity on the increase the concentrations of the majority of IAPs, where water vapor intensifies emissions, leading to increased concentrations of pollutants.
4. The most striking result emerging from the figures is that inadequate ventilation increas-es the indoor toxin levels by not providing enough fresh air and sometimes the air pollut-ants emitted as result of smoking exceed the standard limits.
REFERENCES
1. Burroughs, H.E., & Hansen, S.J. 2011. Managing Indoor Air Quality (5th ed.): Taylor & Francis Ltd.
2. Coggins, M.A., Semple, S., & Hurley, F. 2013. In
-door Air Pollution and Health, STRIVE Report In (2008-EH-MS-8-S3) (Ed.), (pp. 49). EPA depart
-ment, Wexford, Ireland
3. Commission, E. 2010. Standards Air Quality En
-vironment
4. Daisey, J.M., Angell, W.J., & Apte, M.G. 2003. In
-door air quality, ventilation and health symptoms in schools: an analysis of existing information. In
-door Air Quality, 13, 53-64.
5. Dennekamp, M., Akram, M., Abramson, M.J., Tonkin, A., Sim, M.R., Fridman, M., & Erbas, B. 2010. Out -door air pollution as a trigger for out-of-hospital
cardiac arrests. Epidemiology, 21(4), 494-500.
6. EPA. 2017a. Carbon Monoxide’s Impact on Indoor Air Quality, Indoor Air Quality (IAQ), US, EPA (pp. 6).
7. EPA. 2017b. Introduction to Indoor Air Quality In
-door Air Quality (IAQ), Primary Causes of In-door Air Problems (pp. 2). USA.
8. EPA. 2017c. Nitrogen Dioxide’s Impact on Indoor Air Quality. US, EPA.
9. Europe, W.R.O.F. 2000. Air Quality Guidelines. In C. 6.6 (Ed.), Hydrogen sulfide (Second Edition ed.). Copenhagen, Denmark
10. Fang, L., Clausen, G., & Fanger, P.O. 1998. Impact of Temperature and Humidity on the Perception of Indoor Air Quality. Indoor Air Quality, 8, 80-90. 11. Hirt, C.W., & Cook, J.L. 1972. Calculating
Three-Dimensional Flows around Structures and over Rough Terrain. Journal of Computational Physics, 10, 324-340.
12. Klepeis, N., Ott, W.R., & Switzer, P. 1996. A Multi
-ple-Smoker Model for Predicting Indoor Air Qual
-ity in Public Lounges. Environmental Sciences and Technology, 30, 2813-2820.
13. Nadadur, S.S., & Hollingsworth, J.W. 2015. Air Pol
-lution and Health Effects. Springer-Verlag London. 14. Naeher, L.P., Brauer, M., Lipsett, M., Zelikoff,
J.T., Simpson, C.D., Koenig, J.Q., & Smith, K.R. (2007). Woodsmoke health effects: a review. Inha
-lation toxicology, 19(1), 67-106.
15. Saha, D., Kamyotra, S.J., & Khare, M. 2014. In
-door Air Pollution, Monitoring Guidelines (pp. 19). INDIA Central Pollution Control Board, Min
-istry Of Environment & Forests, Govt. Of India, East Arjun Nagar, Delhi 110 032.
16. Spengler, J.D., McCarthy, J.F., & Samet, J.M. 2001. Indoor Air Quality Handbook:
McGraw-Hill, New York.
17. Wainman, T.J., W.C., Lioy, P.J., & Zhang, J. 2001. Effects of Surface Type and Relative Humidity on the Production and Concentration of Nitrous Acid in a Model Indoor Environment. Environmental Science & Technology, 35(11), 2200-2206. 18. WHO 2005. WHO Air quality guidelines for par