ISSN: 2334-2382 (Print), 2334-2390 (Online) Copyright © The Author(s). 2014. All Rights Reserved. American Research Institute for Policy Development 42 Monticello Street, New York, NY 12701, USA. Phone: 1.347.757.4901 Website: www.aripd.org/jeds
Effects of Farmer – Based- Organization on the Technical efficiency of Maize Farmers across Various Agro - Ecological Zones of Ghana
Kwabena Nyarko Addai1, Victor Owusu2, and Gideon Danso-Abbeam3
Abstract
This study uses cross-sectional data collected from 453 maize farmers across various agro ecological zones of Ghana in 2010 to evaluate the effect of farmer based organizations on maize farmer’s technical efficiency. We utilize propensity score matching to compare the average difference in the technical efficiency between farmer based organization members and similar independent farmers. The approach assumes exogenous farmer based organizations formation and similar farm technology across farmers. The result from the study shows that there is no significant impact of farmer based organization on technical efficiency of maize farmers. These results are found to be insensitive to hidden bias and contradicts the idea that farmer based organizations enhance members efficiency by easing access to productive inputs and facilitating extension linkages.
Key words: Farmer based organization, technical efficiency, agro ecological zone. exogenous
1 Institute for Development Studies, University of Cape Coast, Cape Coast, Ghana.
Phone: +233(20)8153246 E-mail: Knaddai@yahoo.com
2PhD,Department of Agricultural Economics, Agribusiness & Extension, Kwame Nkrumah University
of Science & Technology, Kumasi, Ghana.
3Department of Agriculture and Resource Economics, University for Development Studies, Nyankpala
1.0 Introduction
An expected increase in agriculture requires increase in agricultural productivity. Agricultural productivity very much depends on the efficiency of the production process.
For productivity gains to be achieved, smallholder farmers need to have better access to technology and improve their technical efficiency. Policies designed to educate people through proper agricultural extension services could have a great impact in increasing the level of efficiency and hence agricultural productivity. While the private sector is gradually emerging as a contender, the public sector remains the major provider of extension services in most of these countries (Venkatesan & Kampen, 1998). A third option for providing services to smallholder farmers is agricultural cooperatives, which serve the dual purpose of aggregating smallholder farmers and linking them to input and output markets (Davis, 2008).
Given that agricultural systems in Sub-Saharan Africa are typically fragmented into a myriads of small or micro farms over large and remote rural areas, the role of agricultural cooperatives has become increasingly important (Wanyama, Develtere & Pollet, 2009). Despite the turbulent history sometimes associated with post-independence and highly centralized governance regimes, agricultural cooperatives are nowadays omnipresent throughout the sub-continent. However, it is still empirically unclear and highly contested whether these collective organizations can deliver and live up to their promises.
Like governments, many non-governmental organizations (NGOs) encourage the establishment of FBOs to improve rural service delivery, economic growth, and poverty reduction among farmers (Stockbridge, Dorward & Kydd, 2003). Donors and NGOs often prefer to deal with farmers through farmer organizations, particularly if they feel there is institutional failure in the public or private sectors (Rondot and Collion, 2001). However, it is important to note that the support of NGOs and donors in the establishment of FBOs is sometimes funneled through government agencies (Tinsley 2004).
For many donor and NGO projects, joining an FBO is the only way to participate in and receive support from the project, with no consideration given to farmers who do not belong to such groups (Tinsley, 2004).
While the role of farmer based organizations in agricultural inputs adoption for productivity is widely recognized (Abebaw & Haile, 2013), its impact on technical efficiency among their members remain unproven. Whether farmer based organization members are technically more efficient than non-members is an open question. Farmer based organizations are mandated to supply inputs together with providing embedded support services and for facilitating farmer linkage with extension service providers; hence are expected to be technically more efficient.
This paper aims to answer this question by comparing farmer based organization members and non-members across various agro ecological zones of Ghana on their technical efficiency levels in order to reduce potential differences in technology and agro-ecology in which this procedure tempers possible diffusion effects.
2.0 Farmer based organizations in Ghana
From the farmer’s perspective, the incentives for FBO formation are accessing social and economic benefits that are greater than what may be achieved without collective action. Thus FBO is effective when it generates net improvements in the individual livelihoods of group members in social and / or economic capacities.
Although FBOs are widely perceived as an institutional response to different economic needs and social constraints of farmers, a variety of factors motivate their formation (World Bank, 2007 and Fischer & Qaim, 2011).
Private sector organizations, for example, establish FBOs to increase profitability, largely by reducing transaction costs. FBOs enable private entities to deal more effectively and efficiently with smallholder farmers (Gulati, Minot, Delgado & Bora, 2007). Through FBOs, private investors may reduce the cost of dealing with farmers, enhance the volume and quality of farm produce, and improve credit recovery from farmers (Gulati et al. 2007).
In Ghana, both public and private organizations have established a large number of FBOs. No consensus currently exists concerning the total number of FBOs in Ghana, although a database created by the Ministry of Food and Agriculture (MoFA) through voluntary registration estimates the total number at 3,328, of which over 60 percent are involved in crop production. Based on analysis of four main sources, Salifu et al. (2010) estimated about 10,000 FBOs in Ghana—including those both registered and unregistered, and those registered as cooperative societies.
3.0 Methodology
3.1 Study Area
In Table 1, we compare the three agro ecological zones in Ghana being the forest, transitional and savannah zones representing the study areas.
Table 1: A General Description of the Characteristics of the Various Study Areas
General characteristics Forest Zone Transitional Zone Savannah Zone (Bekwai Municipal) (Nkoranza South District) (Gushegu District) Location Southern part of
Ashanti Region
Middle portion of the BrongAhafo region.
North eastern corridor of Northern Region. Total land area 633sqkm 2300sqkm 5796sqkm Topology Within the forest
dissected plateau.
Low lying and rising gradually.
Fairly undulating.
Climate Semi-equatorial type. Wet semi-equatorial region Tropical continental climate.
Vegetation Semi-deciduous forest zone
Savannah woodland and a forest belt.
Guinea savannah type.
Rivers /drainage Drained by the Oda River and its tributaries.
Fairly drained by several streams and rivers.
Strewn with several streams.
Geology Underlain by three geological formations.
Characterized by soils developed over Voltaian sandstones.
Lies entirely within the Voltaian sandstone basin
Soils Clay, sand and gravel deposits
The geological feature together with vegetation influences and gives rise to two distinct soil categories.
Coarse lateritic upland soils and soft clay.
Rainfall 1600– 1800mm. 800-1200mm. 950-1300mm Temperature Fairly high and uniform
temperature ranging between 32ºC in March and 20º C in August.
Average annual
temperature is about 26°C.
Normally high above 350C
3.2 Theoretical framework
This section presents a discussion on the prediction of technical efficiencies of the farmers with the stochastic frontier model and the propensity score matching and average treatment effects.
3.2.1 Stochastic production frontier
This study employs the stochastic frontier model proposed by Aigner, Lovell & Schmidt (1977), and extended by Battese&Coelli, (1995).
( , ) exp( )
i i i i
Y f x V U i1, 2...,n(1)
Here Vi is the random error, associated with random factors not under the
control of the farmer and Ui is the inefficiency effect. The possible production Yi is
bounded by the stochastic quantity, f x( , ) exp(i Vi Ui), hence the name stochastic
frontier. The random error Vi is assumed to be independently and identically
distributed as N(0,V2) random variables independent of U si , which are assumed to
be non-negative truncations of the N(0,V2) distribution (i.e. half-normal
distribution) or have exponential distribution.
The technical inefficiency effects are expressed as:
i i i
U z w (2)
Here zi is a vector of observable explanatory variables and is a vector of
unknown parameters and wi are unobserved random variables which are assumed to
be independently distributed and obtained by truncation of normal distribution with zero mean and constant variance.
According to their two-stage procedure, the production frontier is first estimated and then the technical inefficiencies are derived. The predicted inefficiencies are subsequently regressed upon a set of firm (or farm) specific variables
(zi) in an attempt to determine reasons for differing efficiencies. The two-stage
estimation procedure suffers from a fundamental contradiction as inefficiency effects (or scores) are derived under the assumption that they are independently and identically distributed in the first stage. In the second stage the predicted inefficiency scores are assumed to be a function of several firm (or farm) specific factors, which implies that they are not identically distributed unless all the coefficients of the factors are simultaneously equal to zero (Coelli, Rao&Battese, 1998).
In addition, using Ordinary Least Square (OLS) in the second stage regression
fails to capture the fact that the dependent variable (Ui) is restricted to be
non-negative. The two-stage procedure is unlikely to provide estimates which are as efficient as those that are obtained from the one-step estimation procedure (Coelli, 1996b). For these reasons, the Battese&Coelli (1995) model is, therefore, applied in this study and allows for a simultaneous estimation of the parameters of the stochastic frontier and the inefficiency model using the single-stage, maximum likelihood (MLE)
method. The likelihood function is expressed in terms of the variance parameter 2
and , where 2 u2v2 and
2 2 2
/( )
u u v
Technical efficiency (TE) = Y Yi/ i = f x( , ) exp( Vi Ui) / f x( , ) exp( ) Vi
=exp(Ui)=exp(ziWi)(3)
Where Yi is the observed output and Yi
is the frontier output.
3.2.1.1 Empirical Model
Farm technical efficiency is the ability of a farmer to maximize output with given quantities of inputs and a certain technology (output-oriented) or the ability to minimize input use with a given objective of output (input-oriented). However, the output-oriented technical efficiency is commonly used.
3.2.1.2 Specification of Empirical Model
In a number of studies, Cobb-Douglas (CD) functional form has been used to examine farm efficiency notwithstanding its well-known limitations (Thiam, Bravo-Ureta & Rivas, 2001). Kopp & Smith (1980) indicated that functional forms have a distinct but rather small impact on estimated efficiency. Ahmad & Bravo-Ureta (1996) in their study rejected the Cobb Douglas functional form in favour of the transcendental logarithmic (translog) form, but concluded that efficiency estimates are not affected by the choice of the functional form (cited in Thiamet al., 2001). The Cobb-Douglas production function imposes a severe prior restriction on the farm’s technology by restricting the production elasticities to be constant and the elasticities of input substitution to unity (Wilson, Hadley, Ramsden & Kaltsa 1998).
The flexible functional form translog functional form however, does not entail restrictions of fixed rate of technical substitution (RTS) value and an elasticity of substitution equivalent to one in the CD form of the production function. Therefore, translog functional form is preferred over CD functional. It is noted that the CD is nested within the translog form if all the square and interaction terms in translog turn out to be equal to zero. Therefore, the translog functional form is adopted in this study. The empirical model is specified as:
2 2
0 1 2 3 4 5 6
2 2
8 9 10
11 12 13
ln ln ln ln ln ln( ) ln( )
ln( ) ln( ) ln( ) ln( ) ln( ) ln( )
ln( ) ln( ) ln( ) ln( ) ln(
i
Y LAB FSIZ SED FERT LAB FSIZ
SED FERT LAB FSIZ LAB SED
LAB FERT FSIZ SED
7 14
) ln( )
ln( ) ln( ) ( )
i i
FSIZ FERT
SED FERT V U
Here Yi denotes maize yield (kg / acre), FERTdenotes quantity of fertilizer
used (kg / acre), LAB denotes labour (man-days/acre),SED denotes quantity of
seed planted (kg / acre), FSIZ denotes maize area cultivated (acre), ks are
unknown parameters of the production functions, v si are random errors assumed to
be independent and identically distributed N(0,v2), u si are non-negative random
variables, assumed to be independently distributed, such that the technical inefficiency
effect for the producer, ui , is obtained by truncation (at zero) of the normal
distribution with zero mean ui and constant variance,
2
. Specifically the inefficiency
0 1 2 3 4 5 6 7 8 9
(-) (-) (-) (-) (-) (-) (-) ( -)
i
U GEND AGE HHSZE EDU LOWN MCRP EXT ATCOFW
(+)
(5)
Here GEND denotes dummy variable 1 if farmer is male, 0 otherwise,
AGE denotes experience in maize farming in years , ATC denotes dummy variable
1 if farmer has access to credit, 0 otherwise, EXT denotes dummy variable 1 if
farmer had access to extension services, 0 otherwise,OFW denotes dummy variable 1
if farmer engages in off-farm work, 0 otherwise, MCRP denotes dummy variable 1
if farmer practice mono cropping, 0 otherwise, EDU denotes number of years of
schooling,LOWN denotes dummy variable 1 if farmer is a land owner, 0 otherwise
,HHSZE denotes household size of farmer's are unknown parameters to be estimated.
Since the dependent variable of the inefficiency model represents the mode of inefficiency, a positive sign of an estimated parameter implies that the associated variable has a negative effect on efficiency but positive effect on inefficiency and vice versa. It is assumed that some farmers produce on the production frontier and others do not produce on the frontier. Therefore, the need arises to find out factors causing technical inefficiency. The technical inefficiency model incorporates farm and farmer specific characteristics, institutional and environmental factors.
3.2.2 The Propensity Score Matching Technique
To examine this causal effect of participating in a farmer based organization
on the productivity or technical efficiency of smallholder maize farmers, the p-score
matching approach is employed.
The propensity score p Z( ) is the conditional probability of participating in a
farmer based organization given pre- participating in a farmer based organization characteristics (Rosenbaum and Rubin, 1983). Thus,
( ) Pr{ 1| } { | }
p Z D Z E D Z (6)
Where D{0,1}the indicator of exposure to participating in a farmer based
organization and Z is vector of pre- participating in a farmer based organization
The estimated propensity scores are then used to estimate the Average Treatment Effect on the Treated (ATT) which is the parameter of interest as
1 0 1 0
{ i i | i 1} { { i | i 1, ( i)} { i | i 0, ( i)} | i 1}
E Y Y D E E Y D p Z E Y D p Z D
(7)
Where p Z( i) is the p-score, Yi1and
0
i
Y are the potential outcomes (yield
and technical efficiency) in the two counterfactual situations of receiving treatment (participating in a farmer based organization) and no treatment (non- participating in a farmer based organization).
Two important properties of the p-score matching are the balancing
property and conditional independence assumption (CIA). Testing for this property is important to ascertain if maize farmers’ behavior within each group is actually similar.
Related to the balancing of p-score is CIA, which states that participating in a farmer
based organization is random and uncorrelated with the maize yield or technical
efficiency of the farmer, once the set of observable characteristics, Z are controlled
for. A further requirement is the common support condition which requires that
persons with the same values of covariates Z have positive possibilities of being both
participant and non-participants (Heckman, Lalonde & Smith, 1999). Thus, all individuals in the common support region actually can exist in all states
(0P D( 1|Z1).
3.3 Survey Design and Sampling Method
The research employed both primary and secondary sources of data. The primary data employed was obtained through a cross-sectional survey conducted in three different agro-ecological zones in Ghana.
Farm level data were collected from 453 maize producers across the three agro-ecological zones of Ghana in the 2010 calendar year. The choice of the whole calendar year is on the premise that maize can be produced throughout the year.
In the third stage, villages or communities from operational areas of MOFA were randomly selected from each of the districts representing the agro-ecological zones.
The final stage involved random selection of maize farmers proportionately according to the sizes of the various communities. A total of 151 maize farmers were sampled in the Savannah zone (Gushiegu District), 151 maize farmers were sampled in the Transitional zone (Nkoranza South District) and 151 maize farmers were sampled in the Forest zone (Bekwai Municipality).
4.0 Results and Discussion
Table 2 presents summary statistics of the members and non-members of farmer based organization across the various agro ecological zones of Ghana. From the total maize farmers considered, 37.5 percent are members of farmer based organization (treatment group) and the remaining (62.5%) are found to be non-members. Maize farmers belonging to farmer based organization are more literate, older, have large household size, use hybrid seed, travel longer distance to the market relative to non-members. In terms of land ownership, most non-members are land owners.
Table 2: Descriptive statistics of members and non-members of farmer based organization
Variables Members Non-members Diff in
N (170) 37.5% N (283) 62.5%
Mean SD Mean SD Mean
Gender (1=male;0=female) 0.76 0.43 0.81 0.39 -0.0504
Age (years) 43.06 11.37 43.24 10.52 -0.1791
Household size (number) 9.48 6.44 9.11 6.07 0.3705
Education (years) 5.74 3.37 4.33 3.82 1.4031***
Market distance (miles) 6.88 2.85 5.79 2.89 1.0907***
Land ownership ( 1=tenant, 0=owner) 0.51 0.5 0.52 0.5 -0.0147
Mono cropping (1=Yes,0= No) 0.4 0.49 0.44 0.5 -0.0417
Hybrid seed (1=Yes,0= No) 0.54 0.5 0.4 0.49 0.1419***
Extension contact (1=Yes,0= No) 0.52 0.5 0.42 0.5 0.0995**
Access to credit (1=Yes,0= No) 0.38 0.49 0.24 0.43 0.1455***
Off-farm work (1=Yes,0= No) 0.23 0.43 0.14 0.35 0.1022***
Yield (kg/ha) 1836.18 1034.57 1651.64 1313.19 184.5439
Table 3 reports the summary statistics of the impact indicator variable and the probability of participation used for the matching. The descriptive statistics show a higher level of technical efficiency among non-members than members. The average technical efficiency of members and non-members are 0.72 and 0.73 respectively. However, mean difference between members and non-members is not statistically significant. This means that there is no real difference in the technical efficiency of members and non-members of farmer based organization. However the propensity score indicates a difference among members and non-members and is statistically significant at 1 percent
Table 3: Technical efficiency and estimated probability of participation in farmer based organization
Indicators Members Non-members Diff in
N (170) 37.5% N (283) 62.5%
Mean SD Mean SD Mean
Technical efficiency score 0.72 0.22 0.73 0.22 -0.0085
Estimated probability score 0.44 0.14 0.34 0.15 0.1003***
Source: Survey data, 2010. *** indicates significance at 1%
4.1 Determinants of Participation in Farmer Based Organization
Table 4: Determinants of participation in farmer based organization
Indicators Coefficient Standard Error Z-value
Gender -0.0403 0.1628 -0.25
Age -0.0854 0.0066 -1.30
Household size 0.0207* 0.0114 1.82
Education 0.0530*** 0.0188 2.82
Market distance 0.0752*** 0.0218 3.46
Land ownership -0.1911 0.1338 -1.43
Mono cropping 0.0577 0.1300 0.44
Hybrid seed 0.1573 0.1655 0.95
Extension contact 0.1488 0.1527 0.97
Credit access 0.2481* 0.1502 1.65
Off-farm work 0.4366*** 0.1663 2.62
Constant -1.0827*** 0.3527 -3.07
Number of Observations 453
Pseudo R2 0.080
Log likelihood -275.900
Source: Survey data, 2010. *** and * indicate that coefficients are statistically significant at 1% and 10% respectivel
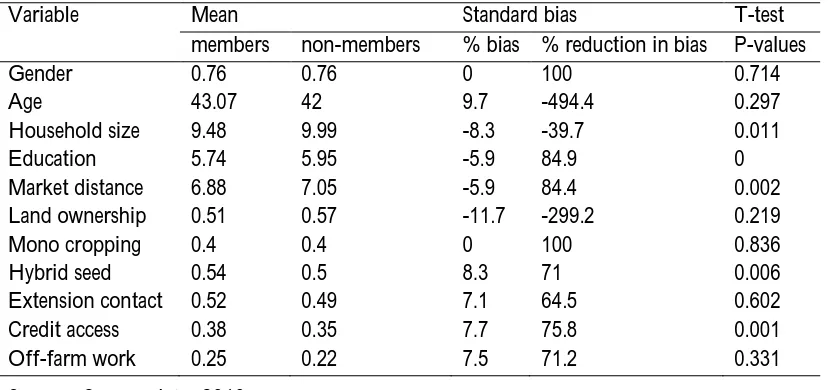
Table 5: Balancing test for all matching covariates
Variable Mean Standard bias T-test
members non-members % bias % reduction in bias P-values
Gender 0.76 0.76 0 100 0.714
Age 43.07 42 9.7 -494.4 0.297
Household size 9.48 9.99 -8.3 -39.7 0.011
Education 5.74 5.95 -5.9 84.9 0
Market distance 6.88 7.05 -5.9 84.4 0.002
Land ownership 0.51 0.57 -11.7 -299.2 0.219
Mono cropping 0.4 0.4 0 100 0.836
Hybrid seed 0.54 0.5 8.3 71 0.006
Extension contact 0.52 0.49 7.1 64.5 0.602
Credit access 0.38 0.35 7.7 75.8 0.001
Off-farm work 0.25 0.22 7.5 71.2 0.331
Source: Survey data, 2010
4.2 Measuring Technical Efficiency
Table 6: Maximum likelihood estimates of stochastic frontier production function and inefficiency model for the pooled sample.
Variable Parameter
Coefficient t-ratio Stochastic frontier
Constant
0
7.168 8.728*
lnlabour
1
-0.098 -0.445
lnfarmsize
2
-0.070 -1.312
lnseed
3
0.469 0.792
lnfertilizer
4
-0.204 -0.449***
lnlabour2
5
0.323 1.657**
lnfarmsize2
6
0.044 1.306***
lnseed2
7
0.133 0.901
lnfertilizer2
8
-0.008 -0.336
lnlabour × lnfarmsize
9
-0.051 -1.518***
lnlabour × lnseed
10
-0.083 -0.631
lnlabour × lnfertilizer
11
0.592 3.426*
lnfarmsize × lnseed
12
0.096 0.778
lnfarmsize × lnfertilizer
13
0.031 1.222
lnseed × lnfertilizer
14
-0.114 -1.882**
Inefficiency model Constant
0
0.731 1.704**
Gender
1
-0.047 -0.232
Age
2
-0.026 -2.682*
Household size
3
0.487 3.385*
Education
4
-0.021 -0.913
Land ownership
5
0.260 1.572***
Monocropping
6
-0.362 -2.247**
Extension contact
7
Access to credit
8
-0.443 -1.968
Off-farm work
9
0.522 2.457
Variance parameters
2 2 2
s v
2
s
0.691 3.961*
2 2
/ s
0.937 48.691*
Log likelihood function -261.676
LR test of one sided error 155.445
Mean efficiency 0.642
Source: Survey data, 2010. ***, **and * indicate that coefficients are statistically significant at 1%, 5% and 10% respectively
With regard to membership in farmer based organization, the results indicates that membership does not significantly affect technical efficiency of maize farmers. Concurrently, from the descriptive statistics (Table 3) the mean technical efficiency of members is not significantly different from non-members. This is also clear from figure 1 as non-members even have higher technical efficiency than members of farmer based organization even though is not significant. This might be as a result of farmers being conservative about the adoption of new improved methods and channeling of resources obtained from the farmer based organization into other sectors other than farming.
Figure 1: Frequency distribution of technical efficiency scores by farmer based organization membership
4.3 Impact of Membership of Farmer Based Organization on Technical Efficiency
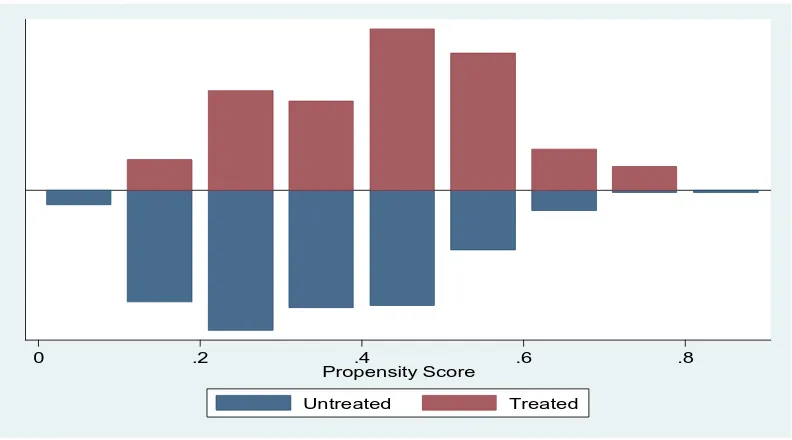
Figure 2 shows the distribution of propensity scores and the region of common support. The bottom half of the figure shows the propensity scores distribution for the untreated, while the upper-half refers to the treated individuals. The densities of the scores are on the y-axis. The figure indicates that the common support condition is satisfied as there is overlap in the distribution of the propensity scores of both treated and untreated groups.
Figure 2: Distribution of propensity scores for unmatched and matched samples
Source: Survey data, 2010
The results of the average treatment effect for the treated for participation in farmer based organization are computed using the nearest neighbor matching technique and are presented in Table 7. It was observed that this matching technique produced a consistent estimate of the treatment effects on the membership of farmer based organization. The results from this matching technique, generally indicates that the results are robust to the matching algorithm used. The matching results indicate that there is no significant impact of farmer based organization on the technical efficiency and yield of maize farmers.
0 .2 .4 .6 .8
Propensity Score
Table 7: Effect of farmer based organization membership on technical efficiency and yield of farmers
Treatment indicator
Outcome
variables ATT S. E. T-value
Number treated Farmer based
organization
Technical
efficiency 0.718 0.0212 0.92 170
Yield 1836.182 134.595 0.78 170
Source: Survey data, 2010
Table 8: Rosenbaum bounds sensitivity analysis for hidden bias
Critical Value of Hidden Bias ( ) Upper Bound Significance level
1 .155356
1.1 .317115
1.2 .505723
1.3 .679114
1.4 .811468
1.5 .898604
1.6 .94951
1.7 .976479
1.8 .989656
1.9 .995672
2 .998266
2.1 .999331
2.2 .99975
2.3 .999909
2.4 .999968
2.5 .999989
2.6 .999996
2.7 .999999
2.8 1
2.9 1
3 1
measures the degree of departure from random assignment of treatment or a study
free of bias (i.e., =1)
5.0 Conclusion
It is recommended that further studies be done in this area as there is the tendency that members of farmer based organizations may have diverted resources obtained from the farmer based organizations.
References
Abate, G.T., Francesconi, G.N. & Getnet., K.(2013). Impact of Agricultural Cooperatives on Smallholders’ Technical Efficiency: Evidence from Ethiopia. Eucrise Working Paper n. 50 (13)
Abebaw, D. & Haile, M.G. (2013). The Impact of Cooperatives on Agricultural Technology Adoption: Emprical Evidence from Ethiopia, Food Policy, 38: 82-91.
Ahmad, M. & Bravo-Ureta, B. E. (1996) Technical Efficiency Measures for Diary Using Panel Data – A Comparison Of Alternative Model Specifications. Journal of Productivity Analysis 7, 399-415.
Aigner, D.J., Lovell, C. A. & Schmidt, P. (1977), Formulation and Estimation of Stochastic Frontier Function Models. Journal of Econometrics 6 (July 1977): 21-37
Battese, G. E. & Coelli, T. J. (1995). A Model for Technical Efficiency Effects in a Stochastic Frontier Production for Panel Data. Empirical Economics 20: 325-332
Chang, H.J. ed (2012). Public Policy and Agricultural Development. New York: Routledge. Coelli, T. J. (1996b). Specification and estimation of stochastic frontier production function.
Unpublished PhD Dissertation, University of New England, Australia.
Coelli,T., Rao, D.S.P. & Battese, G.E. (1998). An Introduction to Efficiency and Productivity Analysis. Kluwer-Nijhoff, Boston.
Davis, K. (2008). Extension In Sub-Saharan Africa: Overview And Assessment Of Past And Current Models And Future Prospects, Journal of International and Extension Education, 15 (3): 15-28.
Diprete, T.& Gangl, M. (2004) Assessing Bias In The Estimation Of Causal Effects: Rosenbaum Bounds On Matching Estimators And Instrumental Variables Estimation With Imperfect Instruments. Sociological Methodology, v. 34, n. 1, pp. 271-310.
Fischer, E., & Qaim, M. (20011). Linking Smallholders to Markets: Determinant and Impacts of Farmer Collective Action in Kenya. World Development. 40(6)
Ghana, Ministry of Food & Agriculture. (2010). Medium-Term National Development Policy Framework: Ghana Shared Growth and Development Agenda (GSGDA), 2010-2013. Volume 1: Policy Framework. Accra.
Gulati, A., Minot, N., Delgado, C. & Bora, S. (2007). Growth in High Value Agriculture in Asia and Emergence of Vertical Links with Farmers. In Global Supply Chains, Standards and the Poor: How the Globalization of Food Systems and Standards Affects Rural Development and Poverty, edited by J. F. Swinen. Oxford: CAB International.
Heckman, J., Lalonde, R. & Smith, J (1999). The Economics and Econometrics Of Active Labour Market Programs. In Handbook of Labour Economics, Vol 114 Ed By O Ashenfelter, and D. Card, pp. 1865-2097.Elsevier, Amsterdam.
Hussein, K. (2001). Producer Organizations and Agricultural Technology in West Africa: Institutions. Local/ Global Encounters. 44(4): 61-66.
Kopp, R. J. and Smith, V.K. (1980). Frontier Production Estimates for Steam Electric Generation: A Comparative Analysis. Southern Economic Journal, 47:1049-1059. Nyemeck, J. B., Sylla, K et Diarra, I. (2001). Analyse des determinants de la performance
productive des producteurs de café dans une zone a faible revenue en Cote d’Ivoire, Final report, AERC, Nairobi.
Owusu-Baah, K. (2012). Ghana. In Public Policy and Agricultural Development, edited by H. J. Chang. New York: Routeledge.
Ronndot, P. & Collion, M. (2001). Agricultural Producer Organizations: Their Contribution to Rural Capacity Building and Poverty Reduction. Report of a Workshop, 28-30 June 1999. Washington, D. C.
Rosenbaum, P.R. & Rubin D. (1983). The Central Role of the Propensity Score in Observational Studies for Causal Effects. Biometrika 70:41-45.
Salifu, A., Francesconi, G & Kolavalli, S. (2010). A Review of Collective Action In Rural Ghana. IFPRI Discussion Paper 00998.
Shiferaw, B., Hellin, J. & Muricho, G. (2011). Improving Market Access and Agricultural Productivity Growth in Africa: What Role for Producer Organizations and Collective Action Institutions? Food Security: 475-489
Stockbridge, M., Dorward, A. & Kydd, J. (2003). Farmer Organizations for Market Access: A Briefing Paper. UK Department of International Development, London.
Thiam, A., Bravo-Ureta & Rivas, R.E. (2001). Technical efficiency in developing country agriculture: meta-analysis. Agricultural Economics, 25:235-243.
Tinsley, R. L. (2004). Developing Smallholder Agriculture: A Global Prospective. Singapore: AGBE Publishing.
Venkatessan, V. & Kampen, J. (1998). Evolution of Agricultural Services In Sub-Saharan Africa: Trends and Prospects, Discussion Paper 390, Washington DC: The World Bank.
Vorley, B., Fearne, A, & Ray, D. (2007). Regoverning Markets: A Place for Small-Scale Producers In Modern Agrifood Chains? Aldershot, Hants, England: Growers Publishing Limited.
Wanyama, F. O. Develtere, P. & Pollet, I. (2009). Reinventing the Wheel? African Cooperatives in A Liberalized Economic Environment, Annals of Public and Cooperative Economics, 80(3): 361-392.
Wilson, P., Hadley, D., Ramsden, S., and Kaltsa, L. (1998). Measuring and Explaining Technical Efficiciecy in UK Potato Production. Journal of Agricultural Economics, 48(3): 294-305