e-ISSN: 2278-7461, p-ISSN: 2319-6491
Volume 7, Issue 5 [May 2018] PP: 25-30
An Ultraviolet Halitosis Detection Using An Open-Path Optical
Fibre Based Sensor
K. Suzalina
1, H. Manap
21,2Faculty of Engineering Technology, University of Malaysia Pahang, Pahang, Malaysia Corresponding Author: K. Suzalina
Abstract:
This paper provides an overview of the development of the optical fibre based sensor to detect halitosis (bad breath) using an open-path technique. The unique characteristic of each compound which corresponds to their identification allows the open-path technique to be best suited method in measuring gaseous compounds. In this study, the technique is designed to analyze the absorption spectral lines of Methyl Mercaptan gas within the ultraviolet wavelength region. Then, the developed sensor was used in cross sensitivity evaluation between Methyl Mercaptan and other breathing gases such as Oxygen, Carbon Dioxide, and water vapor to confirm the reliability of the sensor. The absorption cross section spectrum of the Methyl Mercaptan which generated from the study almost match up the theory with the potential peak selection at 203.5 nm. The cross sensitivity analysis carried out shows that there are no distinctive interference effects within the wavelength region of 200 nm to 250 nm especially at 203.5 nm absorption peak. Experimental results validate the use of the open-path fibre technique in a halitosis sensor within the selected ultraviolet region.Keywords:
Fibre optics, Halitosis, Methyl Mercaptan, Sensor
--- --- Date of Submission: 05-05-2018 Date of acceptance: 21-05-2018 ---
---I INTRODUCTION
Halitosis or bad breath, which is one type of oral malodor indicate foul smells emanating from the mouth. Halitosis comes from the Latin word halitus, meaning breath or exhalation, combined with the Greek suffix, -osis, referring to the state of disease [1]. Originally, the word “halitosis” itself was created as the scientific name of malodor in 1874 by Joseph William Howe [2].
Having halitosis frequently causes embarrassment and affects interpersonal social communication [3]. The so called disease has increasingly come to the forefront of public and dental professional awareness in the early 1990s. The continuous concern of halitosis for both genders and for all age groups acquires them to seek for consultation from dental professionals. Approximately more than 50% of the general populations have halitosis with varying degrees of severity [4].
It was confirmed that 89.8 percent out of 1,687 patients of the cases were due to oral causes. The dorsum of the tongue easily accumulates food debris and dental bacterial plaque [5]. The large surface area of the tongue with its microscopic uneven and papillary structure allows it to become an excellent putrefactive habitat for gram-negative anaerobic bacteria that metabolise proteins as an energy source. The process produce Volatile Sulfur Compounds (VSCs) which are key identifiable gases in bad breath [5]–[8]. In addition, Methyl Mercaptan (CH3SH) is one of the major odorous VSCs, which are known to be involved in halitosis, periodontal diseases [5], and the predominant causative factor of noticeable oral malodor [9].
Self-diagnosis of halitosis is possible but it is not easy because of the familiarity with the smell from one‟s own breath [10]. Therefore, certain protocols of assessments and development of sensors were introduced for further detection and evaluation of the halitosis. Halimeter which used the conventional CH3SH monitoring methods was established but known as an expensive device in the dental field [11], [12]. Following that, biosensors to monitor CH3SH have been described by Minamide et al., [13], [14]. Then, CH3SH biosensor coupled with sensitive hydrogen peroxide was developed to get the most sensitive and optimal detection method of H2O2 for a CH3SH amperometric biosensor [15].
performance of certain devices. Therefore, development of this new optical breath sensor which is low in cost and more sensitive could be an interesting option to halitosis monitoring methods in the dental field.
II METHODOLOGY
Open-path technique is one of the most common methods in gas detection using the spectroscopic principles for the optical fibre sensor. This technique is widely used because it allows a significant proportion of the light sensed by the detector interacted with the test gas and it is capable to simultaneously detect different gas substances in mixture at real time. Open-path technique for this optical sensor is the open-path absorption sensor that is designed to monitor the absorption spectral lines of CH3SH and then evaluate the cross sensitivity of CH3SH with other breathing gases such as oxygen (O2), carbon dioxide (CO2) and water vapor (H2O). The technique is best suited to measure gaseous compounds because of the unique characteristic of each compound that allowed their identification.
In the development of the sensor, the optical fibre is one of the main players. Theoretically, light travels in straight lines and reflecting off headed obstacles. But, optical fibres allow light to travel in any direction and bending around corners. Optical fibres are capable of carrying more information over longer distances. A single mode optical fibre can transmit trillions of bits per second when the signals are wavelength multiplexed.
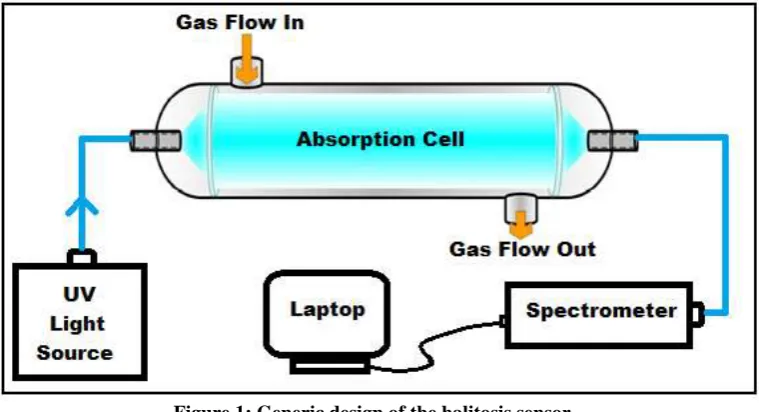
The experimental setup is shown in Fig. 1. Ultraviolet (UV) light source used was the DH-2000 from Ocean Optics which was a Deuterium-Halogen lamp. Type of fibre used to transmit the light from the light source was a 600 µm core size Optran UVNS, UV Non Solarising. Two collimating lens were placed at both ends of the gas cell which approximately 1 cm in diameter and 54 cm long. The lenses were used to focus the incident and transmitted light. Next, the transmitted light was then passed through another optical fibre at the other end of the gas cell to the light detector. Maya2000 spectrometer from Ocean Optics was used as the light detector. The spectrometer which provides resolution to 0.65 nm (FWHM) has from 190 to 1100 nm range was connected to the computer with Spectrasuite software installed. Ocean Optics developed the software for the benefit of the users to have data acquisition from the spectrometer and able to perform data processing of the initial and transmitted intensity of the analysed gas.
Figure 1: Generic design of the halitosis sensor.
Where I is the transmitted intensity, Io is the incident intensity, l (cm) is the distance that light travels through the gas, σ (cm2/Molecule) is the absorption cross section and N (Molecules/cm3) is the gas concentration. Equation (1) then derived as been reported in previous paper [19] to get equation (2) as shown below:
Following the setup, nitrogen (N2) gas was released to neutralize the absorption cell and initial intensity recorded as reference. Then, 100 ppm CH3SH gas was released and the data recorded as transmitted intensity. Using (2), we can accurately calculate the absorption cross section of CH3SH from both readings.
In this study, cross sensitivity testing method is significantly crucial in deciding the choice of absorption wavelength region for the sensor. It is to ensure that the developed halitosis sensor is sturdy and reliable for usage [20]. For that reason, the same experimental setup was used to further investigate the possibility of any interference between CH3SH and the breathing gases. N2, O2, CO2 and H2O are the main players of the air that we breathe in and out as the gas composition is shown in Fig. 2.
Figure 2: The composition of Breathing Gases [21].
Cross sensitivity with N2 is not an issue as reports [22], [23] shows that there is no absorption due to N2 in the UV region. Thus, the investigation is focus towards the cross sensitivity assessment of CH3SH with O2 and CO2. Subsequently, the two main breathing gases O2 and CO2 were chosen for the cross sensitivity testing using the developed sensor.
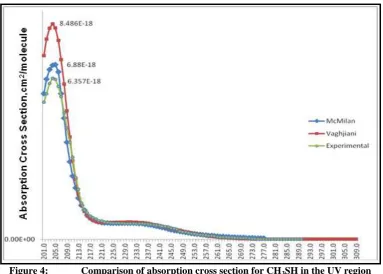
CH3SH gas absorption spectra for comparison purpose thus used them as the theoretical data. The database comprises of data sets from different sources and each of them depends on different choice of temperature and wavelength range [26]. Two data sets of CH3SH gas absorption spectra [27], [28] which have almost similar temperature and wavelength range as the experiment are taken from the database and plotted as shown in Fig. 4. McMillan‟s reported data used temperature of 298 K within wavelength region of 201 nm to 277 nm and Vaghjiani‟s work covered broader wavelength range of 192.5 nm to 309.5 nm with gas temperature of 296 K.
As observed in Figure 4, both plotted data sets from the database showed the same formation as the experimental result. There is similarity in the general shape of all three CH3SH gas absorption spectra but have different height for the peak. The peaks which located at around 203 nm to 204 nm showed three different values. The value from the experimental data is lower than both theoretical data sets from the database. This condition is acceptable and considered normal. There were quite a number of reasons for this to happen. Firstly, the slight difference of the peaks values might resulted from the difference in gas temperature [29]. It was observed that there was a significant temperature effect for the UV absorption particularly at the peaks. Another reason would be the usage of different light sources [30], [31].
Nevertheless, the result showed that the experimental CH3SH absorption spectral is uniquely in good agreement with the theoretical data sets for the selected wavelength region of 200 nm to 250 nm. Accordingly, the open-path fibre based sensor developed earlier is appropriate to be used for the test gas detection.
In this experiment where cross sensitivity is concern, the absorption spectrum of CH3SH is observed to determine whether or not the spectra wavelength is overlapping with other breathing gases. Since, in the case of any gases show the overlapping pattern with each other, these gases actually absorb lights within that certain wavelength region and the cross sensitivity occurs. Therefore, the assessment of possible cross sensitivity among the gases was carried out as plotted in Fig. 5. In order to validate the negligible cross sensitivity issue with H2O, data from one of the studies [32] were taken from the MPI Mainz UV-VIS, plotted and used for the comprehensive interference investigation.
Figure 5: Absorption spectra comparison of CH3SH with the breathing gases
These so called spectrum comparison method which intended for interference observation was regularly used in several previous studies [33]–[35]. Particularly for absorption spectra comparison purpose, logarithmic value (log10 X) has been introduced to the vertical axis of the graph. As a result, the degree of absorption for O2, CO2 and H2O can be clearly distinguished. Obviously from Fig. 5, the absorption amount for O2, CO2 and H2O is comparatively small compared to CH3SH spectrum and it can be considered as zero and negligible. It means that these breathing gases do not absorb light within the same wavelength region as CH3SH gas. In addition, this interference study also was restricted to 200 nm to 210 nm wavelength region where the excellent peak of CH3SH was located at 203.5 nm and as clearly seen, cross sensitivity was not at all an issue. Therefore, this will be a good potential band which was best selected as an absorption point for the development of the halitosis sensor.
IV CONCLUSION
The optical fibre sensor developed using the open-path technique managed to detect the existence of CH3SH within the selected UV wavelength region. Hence, it was suitable for halitosis detection and be considered as a reliable and sturdy optical breathing sensor. However, CH3SH is the only VSCs which was evaluated in this study. So, this work can be extended with the usage of other VSCs such as hydrogen sulphide and dimethyl sulphide.
REFERENCES
[1]. M. K. Hine, “halitosis,” J. Am. Dent. Assoc., vol. 55, no. 1, pp. 37–46, 1957. [2]. J. W. Howe, The breath and the diseases which give it a fetid odor. New York, 1874.
[3]. A. Bosy, “Oral malodor: philosophical and practical aspects.,” J. Can. Dent. Assoc., vol. 63, no. 3, pp. 196–201, Mar. 1997. [4]. S. Nachnani, “Oral malodour,” in Electronic Noses and Olfaction 2000, 2000, pp. 3–12.
[5]. J. Tonzetich, “Production an dorigin of oral malodor: a review of mechanisms and methods of analysis,” J. Periodentol., vol. 48, no. 1, pp. 13–20, 1977.
[6]. K. Yaegaki and K. Sanada, “Volatile sulfur compounds in mouth air from clinically healthy subjects and patients with periodontal disease,” J. Periodontal Res., vol. 27, no. 4, pp. 233–238, Jul. 1992.
[7]. I. Kleinberg and G. Westbay, “Salivary and Metabolic Factors Involved in Oral Malodor Formation,” J. Periodontol., vol. 63, no. 9,
1.000E-25 1.000E-24 1.000E-23 1.000E-22 1.000E-21 1.000E-20 1.000E-19 1.000E-18 1.000E-17
190.0 210.0 230.0 250.0 270.0 290.0
A b sor p tion Cr o ss S e ction , c m 2/ m o le cu le Wavelength, nm
Absorption Spectra Comparison
CH3SH
O2
CO2
H2O
[12]. M. Rosenberg et al., “Halitosis measurement by an industrial sulphide monitor,” J. Periodontol., vol. 62, no. 8, pp. 487–489, Aug. 1991.
[13]. T. Minamide, K. Mitsubayashi, and H. Saito, “Bioelectronic sniffer with monoamine oxidase for methyl mercaptan vapor,” Sensors Actuators, B Chem., vol. 108, no. 1–2 SPEC. ISS., pp. 639–645, 2005.
[14]. K. Mitsubayashi, T. Minamide, K. Otsuka, H. Kudo, and H. Saito, “Optical bio-sniffer for methyl mercaptan in halitosis,” Anal. Chim. Acta, vol. 573–574, pp. 75–80, Jul. 2006.
[15]. Z.-H. Li, H. Guedri, B. Viguier, S.-G. Sun, and J.-L. Marty, “Optimization of Hydrogen Peroxide Detection for a Methyl Mercaptan Biosensor,” Sensors, vol. 13, no. 4, pp. 5028–5039, Apr. 2013.
[16]. S. Morisawa and M. Muto, “A novel breathing condition sensor using plastic optical fiber,” Proc. IIEEE Sensors, vol. vol.3, p. 1277, 2004.
[17]. R. Lewicki et al., “Real Time Ammonia Detection in Exhaled Human Breath with a Quantum Cascade Laser Based Sensor,” in
Conference on Lasers and Electro-Optics/International Quantum Electronics Conference, 2009, p. CMS6.
[18]. G. K. Fedder, “Integrated MEMS in Conventional CMOS,” in Proceeding of the NSF/ASME Workshop on Tribology Issues and Opportunities in MEMS, 1997, pp. 1–15.
[19]. E. L. H. Manap, G. Dooly, S. O‟Keeffe, “Ammonia detection in the UV region using an optical fiber sensor,” in Sensors, 2009, pp. 140–145.
[20]. A. Staerz, U. Weimar, and N. Barsan, “Understanding the Potential of WO3 Based Sensors for Breath Analysis,” Sensors, vol. 16, no. 12, p. 1815, 2016.
[21]. Richard Walker, “„Muscle moves air into and out of the lung, How We Breathe,‟” Franklin Watts, p. pp18.15, 2003.
[22]. W. F. Chan, G. Cooper, R. N. S. Sodhi, and C. E. Brion, “Absolute optical oscillator strengths for discrete and continuum photoabsorption of molecular nitrogen (11–200 eV),” Chem. Phys., vol. 170, no. 1, pp. 81–97, Feb. 1993.
[23]. G. Stark, P. L. Smith, K. P. Huber, K. Yoshino, M. H. Stevens, and K. Ito, “Absorption band oscillator strengths of N 2 transitions between 95.8 and 99.4 nm,” J. Chem. Phys., vol. 97, no. 7, pp. 4809–4814, Oct. 1992.
[24]. H. Keller-Rudek, G. K. Moortgat, R. Sander, and R. Sörensen, “The MPI-Mainz UV/VIS Spectral Atlas of Gaseous Molecules of Atmospheric Interest,” Earth Syst. Sci. Data, vol. 5, no. 2, pp. 365–373, Dec. 2013.
[25]. H. Okabe, Photochemistry of Small Molecules. John Wiley & Sons Inc, 1978.
[26]. M. Aslam et al., “Highly selective ammonia gas sensor using surface-ruthenated zinc oxide,” Sensors Actuators, A Phys., 1999. [27]. G. L. Vaghjiani, “CH3SH ultraviolet absorption cross sections in the region 192. 5-309.5 nm and photodecomposition at 222 and
193 nm and 296 K,” J. Chem. Phys., vol. 99, no. 8, pp. 5936–5943, 1993.
[28]. V. McMillan, “Personal communication to J.G. Calvert, J.N. Pitts, Jr., Photochemistry,” John Wiley Sons, New York, p. 489, 1966. [29]. A. Fahr and A. Nayak, “Temperature dependant ultraviolet absorption cross sections of propylene, methylacetylene and
vinylacetylene,” Chem. Phys., vol. 203, pp. 351–358, 1996.
[30]. Y.-J. Wu, H.-C. Lu, H.-K. Chen, B.-M. Cheng, Y.-P. Lee, and L. C. Lee, “Photoabsorption cross sections of NH3, NH2D, NHD2, and ND3 in the spectral range 110–144nm,” J. Chem. Phys., vol. 127, no. 15, p. 154311, Oct. 2007.
[31]. H. Manap, “An Ultraviolet Optical Fibre Based Sensor For Ammonia Detection in the Agricultural Sector,” University of Limerick, 2011.
[32]. W. . Parkinson and K. Yoshino, “Absorption cross-section measurements of water vapor in the wavelength region 181–199 nm,”
Chem. Phys., vol. 294, no. 1, pp. 31–35, Oct. 2003.
[33]. H. Manap and E. Lewis, “The Interference Study of Green-House Gases for an Ammonia Sensor,” Appl. Mech. Mater., vol. 704, pp. 244–247, Dec. 2014.
[34]. E. Austin, A. van Brakel, M. N. Petrovich, and D. J. Richardson, “Fibre optical sensor for C2H2 gas using gas-filled photonic bandgap fibre reference cell,” Sensors Actuators B Chem., vol. 139, no. 1, pp. 30–34, May 2009.
[35]. G. Neurauter, I. Klimant, and O. S. Wolfbeis, “Microsecond lifetime-based optical carbon dioxide sensor using luminescence resonance energy transfer,” Anal. Chim. Acta, vol. 382, no. 1–2, pp. 67–75, Feb. 1999.
![Figure 2: The composition of Breathing Gases [21].](https://thumb-us.123doks.com/thumbv2/123dok_us/1366932.1646288/3.595.107.488.517.730/figure-composition-breathing-gases.webp)