e-ISSN: 2278-7461, p-ISSN: 2319-6491
Volume 7, Issue 1 [January 2018] PP: 51-65
Hemorrhages Detection in Fundus Image Based on Human Visual
Characteristics
Jun Wu
1,2Dong-Xia Zhang
1,2*Song Yang
1,2Shu-Ya Song
1,21Tianjin Polytechnic University, School of Electronics and Information Engineering, TianJin, China, 300387 2Tianjin Key Laboratory of Optoelectronic Detection Technology and System, TianJin, China, 300387
Corresponding author:Dong-Xia Zhang
Abstract:
Hemorrhage is one of the early symptoms of diabetic retinopathy. Accurate detection of hemorrhages in fundus images is an important contribution for building automatic screening system of diabetic retinopathy, thus a novel algorithm based on human visual characteristics is proposed in this paper. Firstly, brightness correction and contrast limited adaptive histogram equalization are applied to fundus images. Secondly, candidate hemorrhages are extracted by background estimation and watershed segmentation. Thirdly, 2-D Gaussian fitting and human visual characteristics are used to extract visual characteristics of each candidate hemorrhage. Finally, hemorrhages are screened by support vector machine according to visual characteristics. The proposed method is evaluated on 219 fundus images of DIARETDB database. Experimental results show that overall average sensitivity, specificity and accuracy for hemorrhage in image level are 100%, 80% and 90.87% respectively, and overall average sensitivity and positive predictive value for hemorrhage in lesion level are 98.52% and 92.30% respectively. The results show that proposed method can realize automatic detection of hemorrhages in fundus image with high accuracy.Keywords:
fundus images; hemorrhage; watershed segmentation; human visual characteristics; support vector machine---Date of Submission 08-12-2017 ---Date of acceptance: 09-01-2018 --- ---
I.
INTRODUCTION
Diabetic Retinopathy (DR) is the most common and severe micro-vascular complication of diabetes mellitus. It is main cause of blinding in adults around the world. Fundus examination can not only timely detect DR, but also monitor other complications of diabetes. At present, there are various fundus examination methods at home and abroad. The method of fundus color photography is cheap, insensitive to drug and easy to record and save, thus it is considered as the most suitable method of DR screening by ophthalmologists. However the ophthalmologist check can’t apply to large-scale DR screening, thus it is necessary to use computer technology to automatically identify the lesions in fundus image. Hemorrhages (HAs) are one of the early lesions of DR. Hemorrhages located in deep retina are usually dark red and round spots while hemorrhages located in shallow retina are usually bright red, linear, long strip or flamboyant spots. Hemorrhages usually coexist with micro-aneurysm, and the levels of DR in clinical are classified according to the presence or absence and the number of these two lesions. Therefore, accurate detection of HAs in color fundus images is of great significance for automatic screening and effective evaluation of DR.
method is only based on one or several characteristics of HA, and does not fully consider essential characteristics of each structure in fundus image, so the applicability is not high.
In summary, main reason for problems above is that characteristics of structures in fundus image are not adequately analyzed. Therefore, a method based on human visual characteristics is proposed in this paper. Firstly, brightness correction, green (G) channel extraction and contrast limited adaptive histogram equalization (CLAHE) are used to eliminate influence of uneven illumination and improve the contrast between HAs and background. Secondly, dark areas may be HAs are converted into bright areas by background estimation so that influence of background can be eliminated. Then, bright areas are divided into a plurality of candidate targets by watershed transformation, and HAs near blood vessel is separated from blood vessels to prevent missed detection of HA. Thirdly, candidate hemorrhages are estimated by 2-D Gaussian fitting for overcoming the limitations of traditional template matching, on the basis of which, characteristics of each structure such as HAs, vascular fragments, background texture mutation and noise in fundus image are analyzed and extracted by human visual characteristics. Finally, hemorrhages are screened from candidate hemorrhages by SVM according to visual characteristics.
II.
PREPROCESSING
Original colored fundus image For may appear uneven brightness, low contrast phenomenon because of the influence of light and other factors, therefore, it is necessary to preprocess image For for improving its quality. The preprocessing mainly includes the following steps:
Step 1: To eliminate the uneven brightness, brightness correction is applied to the image For, that is, brightness value V(i,j) is corrected to Bc(i,j) according to eq. (1) in the HSV space. The result of brightness correction is shown in Fig. 1, where (a) is original color fundus image For, (b) is brightness corrected result image Fbc.
2 c
( , )
1 ( ( , ) 1)
B i j
V i j
(1)(a) Original Colored Fundus Image For
Step 2: Green channel of brightness corrected result image Fbc is extracted. Fig. 2 shows different components of image Fbc consist of red channel Fr, green channel Fg and blue channel Fb. It is clearly evident from the three channels of image Fbc that green channel contains the maximum information about hemorrhage. Therefore, green channel is used for further processing.
(a) Red Channel Fr
(b) Green Channel Fg
(c) Blue Channel Fb Fig. 2. Each Channel of Image Fbc
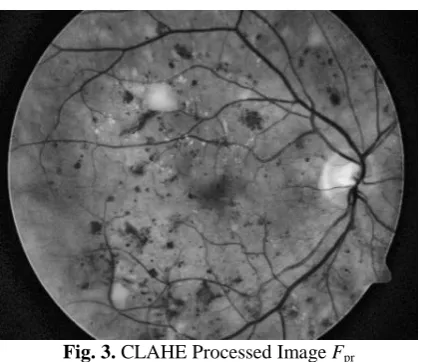
Step 3: To improve the contrast between hemorrhages and background, Contrast Limited Adaptive Histogram Equalization (CLAHE) [12] is applied to green channel Fg. Fig. 3 shows the CLAHE processed image
Fig. 3. CLAHE Processed Image Fpr
III.
CANDIDATE HEMORRHAGES EXTRACTION
In addition to HAs, there are also blood vessels, background, background texture mutation and noise in
Fpr, so it is necessary to extract regions of candidate hemorrhages. The traditional approach is threshold segmentation. However it is difficult to determine a fixed threshold for all images because of different quality of fundus image. In order to overcome above difficulties, this paper proposed a method based on background estimation and watershed segmentation to extract candidate targets. It mainly includes the following steps: Step 1: Background estimation of the pre-processed image is performed to eliminate background effects.To ensure integrity of large hemorrhage, while not missing small hemorrhage, this paper firstly uses median filter with window size of 80×80 pixels to filter the image Fpr, obtaining approximate background image Fmi according to the size of fundus image and the proportion of hemorrhage in fundus image. Secondly, Fpr is subtracted from Fmi to obtain image Fpm. Thirdly, in order to reduce degree of over-segmentation caused by subsequent watershed segmentation, image Fpm is filtered three times with median filter of 3×3 pixels window, obtaining image Fbm. Finally, image Fbm is segmented with threshold value T that is variance of Fbm, obtaining image after background estimation.
bm bm
se
( , ),
( , )
( , )
0,
otherwise
F
i j
F
i j
T
F i j
(2)The process of background estimation is shown in Fig. 4, where (a) is the preprocessed image Fpr, (b) is the approximate background image Fmi, (c) is the difference image Fpm of Fpr and Fmi, (d) is the image Fse after background estimation. As seen from Fig. 4, preprocessed image Fpr contains a large number of backgrounds and background is not uniform. After background estimation, the dark area may be hemorrhages are transformed into bright area, which not only eliminates the influence of unevenness background, but also a large number of backgrounds are removed, thereby reducing number of candidate hemorrhages.
(c) Approximate Background Image Fmi
(c) Difference Image Fpm of Fpr and Fm
i
(d) Image Fse after Background Estimation Fig. 4. Process of Background Estimation
(a) Gray-Scale Image Fw_h after Watershed Segmentation
(b) Binary Image Fw_b after Watershed Segmentation Fig. 5. Result of Candidate Hemorrhages Extraction
IV.
VISUAL FEATURES EXTRACTION
Gaussian fitting is usually used to estimate the Gaussian model parameters, then Gaussian fitting image is generated. Human visual characteristics are often used to evaluate the image quality intuitively. Therefore, this paper proposes a method based on 2-D Gaussian fitting and human visual characteristics to fit and extract visual characteristics for subsequent screening of HAs. It mainly includes two steps: 2-D Gaussian fitting and human eye visual features extraction.
Step 1: In order to improve the accuracy of fitting, this paper proposes a 2-D Gaussian model [14] with angle θ, which is expressed as follows:
'2 '2
2 2
[ ]
2 2
( , ) =
e
x yx y
f x y
A
-
- (3)
'
0 0
'
0 0
(
) cos
(
) sin
(
) sin
(
) cos
x
x
x
y
y
y
x
x
y
y
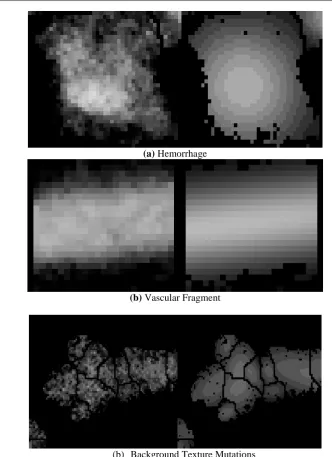
(4)(a) Hemorrhage
(b) Vascular Fragment
(b) Background Texture Mutations
(d) Noise
Fig. 6. Result of Gaussian Fitting
Step 2: Based on 2-D Gaussian fitting, this paper proposes visual features (fitting error, ratio of space distance to its maximum value, texture change and proportional characteristic) of candidate hemorrhages are extracted by Human Visual Characteristics.
Fitting error refers to mean square value of difference image between candidate hemorrhage image H after pretreatment and candidate hemorrhage image G after fitting. The larger error err is, the higher noise content of candidate hemorrhage is, so fitting error err can be an index to judge noise. Fitting error of i-th candidate target is calculated as follows:
i N j j j i j j i
N
y
x
G
y
x
H
i
err
i
1 2))
,
(
)
,
(
(
)
(
(5)(2) Ratio Δd/l of spatial distance Δd to its maximum value l
Subjective brightness is due to the fact that the light reflected by object illuminates retina of human eye and nerve is stimulated. Experiments show that there is a logarithmic relationship between subjective brightness and objective brightness, also known as Weber-Fechner’s law [15].
0
lg
I
k
k
s
(6)In this paper, the law is used to analyze degree of over-segmentation of candidate hemorrhages. The illustration is shown in Fig. 7, where (a) is curve of Weber-Fechner’s law where k=1, k0=0, ordinate represents subjective brightness s, and abscissa represents objective brightness, that is, gray level I. Assuming that x’ axis
is long axis of candidate target, curve of gray distribution is shown in (b), where the abscissa is the coordinate of spatial position x’, the ordinate is gray value I(x’) at corresponding position. The gray value at center point x0 is
A and its corresponding subjective brightness value is sA. When subjective brightness s decreases from sA to
sA-0.1, gray value decreases from A to A-ΔI, and its corresponding spatial position changes from x0 to x0+Δd, and l is he maximum value of the spatial distance Δd. The greater ratio of Δd to its maximum l, the smaller gray-scale change in long axis observed by human eye, and the more severe degree of over-segmentation of HA, which only will occur in vascular fragments. Therefore, ratio Δd/l is taken as an index for judging vascular fragments in this paper.
(a) Curve of Weber-Fickner's Law
(b) Gray Distribution Curve of x’ Axis
(3) Texture change Δxm, Δym
Texture change is an important low-level visual feature. Sensitivity of human eye to change in gray-scale texture varies with the background brightness. For example, human eye is less sensitive to the detail of the image in high brightness background and low brightness background, but sensitivity of image detail in medium brightness background is higher. Experiments show that brightness difference human eye can only distinguish is function of I, that is, human eye gray-scale resolution characteristic [16].
In this paper, human eye gray-scale resolution characteristic is used to analyze the texture change of the candidate target. Illustration of gray-scale texture change on the x’ axis is shown in Fig. 8, where (a) is curve of
the minimum gray-scale resolution g(I) of human eye with the gray level I, (b) is curve of gray scale distribution on the x’ axis of candidate hemorrhage, where abscissa is coordinate of spatial position x’, ordinate is gray value I(x’) at corresponding position. The gray value at center point x0 is A and its corresponding distinguishable brightness difference is g(A). When gray value decreases from A to A-g(A), spatial position changes from x0 to
x0+Δx1, corresponding distinguishable brightness difference of gray value A-g(A) is g(A-g(A)). When gray value decreases from A-g(A) to A-g(A)-g(A-g(A)), spatial position changes from x0+Δx1 to x0+Δx1+Δx2, and so on, a series of texture changes Δxm (m=1, 2, 3, …) on the x’ axis of candidate target can be obtained. Similarly, the minimum gray-scale resolution function is applied to y’ axis, texture changes Δym (m=1, 2, 3, …) on y’ axis of candidate target can be obtained. The smaller Δxm and Δym is, the faster gray-scale texture changes is, the higher Gaussian significance is. Therefore, texture change Δxm, Δym is taken as an index for judging Gaussian significance.
(a) Curve of the Minimum Gray-Scale Resolution
(b) Gray Distribution Curve of x’ Axis
(4) Proportionality max(Δxm, Δym)/ min(Δxm, Δym)
Proportionality refers ratio max(Δxm, Δym)/min(Δxm, Δym) of texture change between long and short axis of candidate hemorrhage. max(Δxm, Δym) is texture change on long axis of candidate target and min(Δxm, Δym) is texture change on minor axis. The greater ratio max(Δxm, Δym)/min(Δxm, Δym), the more obvious contrast of texture changes between long and short axis, the higher possibility of belonging to vascular fragment. Therefore, proportionality max(Δxm, Δym)/min(Δxm, Δym) is taken as an index for judging vascular fragments.
V.
SCREENING OF HA
To get real hemorrhages, candidate hemorrhages need to be screened according to above visual characteristics including peak A, area N, texture changes on the minor axis Δxm, the ratio Δd/l of the spatial distance Δd to its maximum value l, proportionality max(Δxm, Δym)/min(Δxm, Δym) and fitting error err. In this paper, SVM is used to screen HAs from candidate hemorrhages. 23 images in DIARETDB1 database are selected randomly as training set and other images are test set. Final detection result of hemorrhage is shown in Fig. 9, where (a) is result image of removing all false HAs, (b) is result image of removing all false HAs superimposed on Fpr, (c) is final detection result image of HAs, (d) is final detection result image of HAs superimposed on Fpr.
(a) Result Image of Removing All False Has
(b) Result Image of Removing All False HAs Superimposed on Fpr
(d) Final Detection Result Image of HAs Superimposed on Fpr Fig. 9. Final Detection Result
VI.
EXPERIMENTAL RESULTS
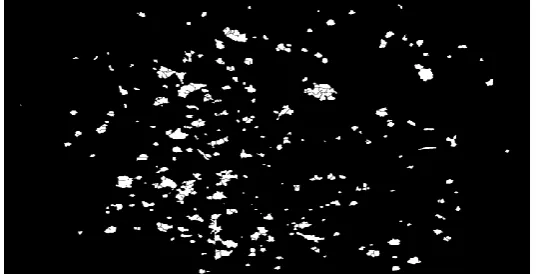
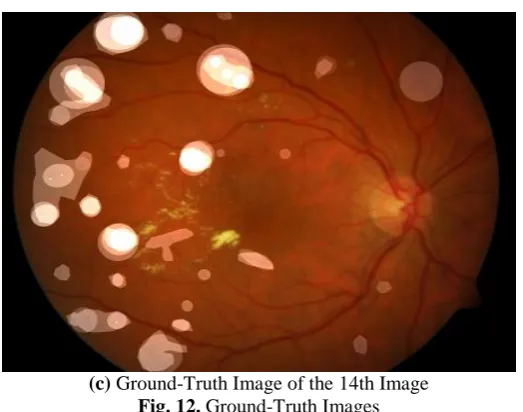
Automatic hemorrhage detection method proposed in this paper was tested over a large database containing 219 colored fundus images of 1500×1152, in which there are normal and varying lesion degrees images and corresponding ground-truth images manually marked by experts, thus it is of a certain representation. Parts of experimental results are shown in Fig. 10-12, where three original color fundus images (the 43th, 53th and 14th images of DB1 database) are shown in Fig. 10, and their detection results and ground-truth images are shown in Fig. 11 and Fig. 12, respectively. The lesion degree of three fundus images is increased according to international staging standards of DR.
(a) The 43th Image of DB1 Database
(c) The 14th Image of DB1 Database Fig. 10. Varying Degrees of Lesion Images
(a) Detection Result of the 43th Image
(c) Detection Result of the 14th Image Fig. 11. Detection Results
(a) Ground-Truth Image of the 43th Image
(c) Ground-Truth Image of the 14th Image Fig. 12. Ground-Truth Images
As revealed by Table. 1, evaluation of detection results is performed from image level and lesion level: overall average value of sensitivity (SE), specificity (SP) and accuracy (ACC) are used to evaluation of image level; Overall average of SE and positive predict value (PPV) are used to evaluation of lesion level. SE, SP,
ACC, PPV are calculated as follows:
FN
TP
TP
SE
(7)FP
TN
TN
SP
(8)FP
TN
FN
TP
TN
TP
ACC
(9)FP
TP
TP
PPV
(10)where TP is true positive, FP is false positive, TN is true negative, FN is false negative. For the image (region) marked as hemorrhage by doctor, if it is consistent with detection result, then TP, otherwise FP; For the image (region) marked as non-hemorrhage by doctor, if it is consistent with the detection result, then TN, otherwise FN.
The performance comparison between proposed method and other methods is shown in Table. 1, where literature [3] using adaptive template matching, literature [6] using machine learning, literature [8] using adaptive thresholds, are the representative methods of template matching, classifier and feature analysis, respectively. As seen from Table. 1, indicators of proposed method in image level and lesion level are mostly higher than other three methods, and missed detection rate of HAs is reduced to a large extent, improving sensitivity and accuracy of HA. The results show that proposed method has good detection performance.
Table. 1: Performance Comparison Between Proposed Method and Other Methods
Method Image Level Lesion Level
SE/% SP/% ACC/% SE/% PPV/% Method of Ref. [3] 100 80 92.40 89.01 87.30 Method of Ref. [6] 77 77 85 - - Method of Ref. [8] 87.71 94.62 - - - Proposed Method 100 80 90.87 98.52 92.30
VII.
CONCLUSION
with angle T, without considering HA’s size, shape and other factors, overcoming limitations of template matching, then on the basis of which, intuitive visual characteristics of HAs, blood vessels, background texture mutation and noise in fundus image are extracted by human visual characteristics. Finally, hemorrhages are screened by SVM classifier according to visual features, access to the real HAs. Experiments show that proposed method can not only achieve accurate hemorrhage detection for different quality and different lesion degree of image, but also can effectively reduce missed detection rate of HAs.
REFERENCES
[1]. Bae JP, Kim KG, Kang HC, et al. A study on hemorrhage detection using hybrid method in fundus images[J]. Journal of Digital
Imaging, 2011, 24(3): 394.
[2]. Gao WW, Shen JX, Wang YL, et al. Algorithm of locally adaptive region growing based on multi-template matching applied to
automated detection of hemorrhages[J]. Spectroscopy & Spectral Analysis, 2013, 33(2): 448-453.
[3]. Xiao ZT, Zhao BF, Zhang F, et al. Hemorrhages detection in fundus image based on k-means clustering and adaptive template
matching[J]. Chinese Journal of Biomedical Engineering, 2015, 34(3): 264-71.
[4]. Sirajudeen A, Ezhilarasi M. Multi-scale LBP and SVM classification to identify diabetic retinopathy in lesions[J]. Current Medical
Imaging Reviews, 2015, 11(1): 527-38.
[5]. Caramihale T, Dan P, Ichim L. Detection of regions of interest in retinal images using artificial neural networks and K-means
clustering[C]// 22nd International Conference on Applied Electromagnetics and Communications. Dubrovnik: IEEE, 2016: 1-6.
[6]. Santhakumar R, Tandur M, Rajkumar ER, et al. Machine learning algorithm for retinal image analysis[C]// IEEE Region 10
Conference. Singapore: IEEE, 2016: 1236-1240.
[7]. Ashraf MN, Habib Z, Hussain M. Texture feature analysis of digital fundus images for early detection of diabetic retinopathy[C]// 11th
International Conference on Computer Graphics, Imaging and Visualization (CGIV) - New Techniques and Trends. Singapore: IEEE, 2014: 57-62.
[8]. Ganguly S, Ganguly S, Srivastava K, et al. An adaptive threshold based algorithm for detection of red lesions of diabetic retinopathy in
a fundus image[C]// International Conference on Medical Imaging, M-Health and Emerging Communication Systems. Greater Noida: IEEE, 2015: 91-94.
[9]. Pandey A, Chandra R, Dutta MK, et al. Automatic detection of red lesions in Diabetic Retinopathy using Shape based extraction
technique in fundus image[C]// 39th International Conference on Telecommunications and Signal Processing. Vienna: IEEE, 2016: 538-542.
[10].Mane VM, Kawadiwale RB, Jadhav DV. Detection of red lesions in diabetic retinopathy affected fundus images[C]// IEEE
International Advance Computing Conference. Bangalore: IEEE, 2015: 56-60.
[11].Hashim MF, Hashim SZM. Diabetic retinopathy lesion detection using region-based approach[C]// 8th Malaysian Software
Engineering Conference. Langkawi: IEEE, 2014: 306-310.
[12].Reza A M. Realization of the contrast limited adaptive histogram equalization (CLAHE) for real-Time image enhancement[J]. Journal
of VLSI Signal Processing Systems for Signal Image & Video Technology, 2004, 38(1): 35-44.
[13].Beucher S, Mathmatique CDM. The watershed transformation applied to image segmentation[J]. Scanning Microscopy Supplement,
1992, 6: 299-314.
[14].Feng XX, Zhang LY, Ye N, et al. Fast Algorithms on Center Location of Two Dimensional Gaussian Distribution Spot[J]. Acta Optica
Sinica, 2012, 32(5): 0512002.
[15].Deco G, Scarano L, Sotofaraco S. Weber's law in decision making: integrating behavioral data in humans with a neurophysiological
model[J]. Journal of Neuroscience the Official Journal of the Society for Neuroscience, 2007, 27(42): 11192.
[16].Avidan G, Harel M, Hendler T, et al. Contrast sensitivity in human visual areas and its relationship to object recognition[J]. Journal of
Neurophysiology, 2002, 87(6): 3102.