Abstract
The present study analyses the impact of M&As on long-term operating performance pre-and post-merger of the combined entity on completion of M&A deals during 2000-2010 using the cash flow returns on operating assets at book as well as market value.The changes in operating performance attributable to merger and acquisition are measured by comparing the post and pre-merger operating cash flows scaled by the operating assets three years before and after the year of M&A. This study uses a sample of 51 pairs of acquiring and target firms involved in M&As during the period April 1, 2000 to March 31, 2010.M&As as strategy of growth is found not helping in improving corporate performance for the combined firm in the long term based on evaluation of long term operating performanceThe difference between AIACFi, POST and AIACFi, PRE is found insignificant based on both the book as well as the market value.
Keywords: mergers, acquisitions, acquirers, targets, combined entity, operating performance, cash flow returns
Introduction
Companies can grow either internally or externally. Internal growth, which is also called organic growth, is achieved over long time period through excellence in operations, efficiency improvement, acquiring assets, opening up of branches, introduction of new product or product lines and the like. The business strategy of external growth or inorganic growth through mergers and acquisitions (M&As) is considered as quickest means of achieving corporate growth to enhance their size and face the increasing face of domestic and global competition. M&As have become an important strategy for geographical expansion of businesses across the world. The increase in the M&A deals is on account of economic liberalization and integration of economies world over. There has been rapid growth in M&As activity in India too since the initiation of economic reforms in 1991 (Beena, 2004 p.11).
Theoretically, M&As create value by creating operating and financial synergies. M&As create operating synergies by achieving economies of scale and scope and financial synergies by reducing cost of capital, coinsurance effect, lowering floatation and transaction cost, solving mismanagement
* Assistant Professor and HOD of Department of Commerce, P. R. L. S. Government Post Graduate College, Alapur, Ambedkar Nagar, Uttar Pradesh. E-mail id: [email protected] or, [email protected]
The Impact of Mergers and Acquisitions (M&As) on Operating
Performance : An Empirical Study of Select Companies in India
(agency problems), increased market power and tax benefits. M&As are outcome of various driving factors such as strategic realignment, technological change, booming stock market, falling interest rates, diversification, competitive and regulatory changes. M&As are expected to have favorable long term impact on a company's operating performance if they have to be worthwhile strategies aimed at creating shareholder value. With the globalization of competition and capital markets, shareholder value is rapidly capturing the attention of the corporate entities worldwide and the concept is slowly becoming the global standard for measuring business performance.Lots of research and investigation has been conducted in the field of economics and strategic management on the kinds of benefits which are derived out of such M&As to the acquiring and target company, the customers and the society at large. Many merger theories have emerged to explain why firms continue to initiate M&A in spite of the overwhelming evidence indicating that their shareholders will effectively 'lose out'.
Several foreign studies have examined changes in operating performance of acquiring firms after M&As.The results in the findings of several foreign studies are mixed. While some studies found improvement in operating performance (e.g., Healy, Palepu & Ruback, 1992; Cornett & Tahranian, 1992; Manson et al., 1993, Chatterjee & Meeks, 1996; Switzer, 1996; Manson et al., 2000; Ghosh, 2001; Ramaswamy & Waegelein, 2003; Rahman &Limmack, 2004; Feroz et al., 2005; and Lau et al., 2008), many other studies found no improvement or negative effect on operating performance based on accounting data (e.g., Singh, 1971; Utton, 1974; Meeks, 1977; Mueller, 1980; Ravenscraft & Scherer, 1989; Agarwal, Jaffe, & Mandelker, 1992; Clark & Ofek, 1994; Barber &Lyon, 1996; Yook, 2004; Majumdar et al., 2007; and Ismail et al., 2010).
Studies on M&As in India are very few and that too are limited to comparing pre- and post-merger performance using a case by case approach (Kaveri, 1986) or a general description of post-mergers and takeovers and their accounting framework (Kumar & Parachure, 1990). Some studies have analyzed post-merger operating performance of the acquirers including the comparative pre- and post- operating performance. The results of these studies are found mixed and no clarity appears regarding the impact of M&As on operating performance post-merger.
Review of Literature
Ravenscraft & Scherer (1989) in their study of merging firms profitability during 1975-77 using cash flow returns on sales did not find any support for improved post-merger operating performance. They rather found a significant negative impact of 13.34 per cent on the post-merger profitability.
Cornett & Tehranian (1992) investigated the post-acquisition performance of 30 large acquirer banks in the U.S. between 1982 and 1987. The pre- and post-merger performance was computed for three years before and three years after the merger respectively. They found the evidence of significant improvement in post-merger performance as compared to pre-merger period.
Switzer (1996) analyzed the post-merger changes in operating performance of 324 acquisitions during 1967 and 1987 in the U.S. She used the cash flow based measure for assessing operating performance. She found evidence of improved synergistic gains and better performance in the long-run.
Manson et al. (2000) investigated a sample of 44 takeovers in the U.K. between January 1, 1985 and December 31, 1987. They used Cash flow measure and found that takeovers had led operating gains ranging from 2 per cent to 14 per cent per year in the post-merger period.
Ghosh (2001) investigated to show whether operating performance had actually improved post-acquisition. The study used a large sample of acquisitions from 1981 to 1995. He made a comparison between pre- and post-merger operating cash flow performance relative to the merged firms and found no evidence of improved performance in operating cash flow following acquisition. The study revealed that cash flows of merging firms increased significantly by 2.4% every year. The median increase in post-merger cash flow by 0.26% per year was statistically insignificant.
Ramaswamy & Waegelein (2003) tested post-merger financial performance of a sample of 162 companies involved in mergers during 1975 and 1990 in Hong Kong. The study used operating cash flow returns on market value of assets as a measure of performance. The study covered a period of five years pre- and merger and found that there was a positive significant improvement in post-merger performance and a significant association between post-post-merger performance and differences in relative size of the combined firms.
Rahman & Limmack (2004) carried out analysis on pre- and post-merger financial performance based on operating Cash flow measure. They used ratio of operating cash flow to book value of operating assets of the merged companies pertaining to two years before and five years after the merger and found improvements in operating cash flow returns of 3.75 per cent per year after the merger.
Ramakrishna (2008) examined a sample of 87 pairs of merging firms in India between January, 1996 and March, 2002 for assessing the impact on long-term post-merger performance of firms. He used pre-tax operating cash flows deflated by book value of operating assets to measure firm performance. He adjusted raw firm operating performance measure for industry and economic effects. The study used aggregate industry-adjusted cash flow return three years before and after the year of merger to measure changes in post-merger performance and found the evidence of improved long-term performance attributable to higher efficiency in utilization of assets.
3 years after the year of merger excluding the year of merger. The study found no significant improvement in financial performance after merger.
The results in Indian studies are found mixed and no clarity appears in these studies. Some of the studies have shown that the operating performance of acquirers improved significantly after acquisitions (e.g., Joshi, 1991; Bhanu, 2005; Reddy & Padma, 2005; Selvam, Vanitha, & Babu, 2005; Gangadhar & Reddy, 2007; Vanitha & Selvam, 2007; Kumar & Rajib, 2007 a; Mann & Kohli, 2008; Ramakrishna, 2008), while some other studies have reported either no improvement or significant negative effect on operating performance (e.g., Beena, 2000; Pawaskar, 2001; Kaur, 2002; Kumar, 2004; Beena, 2004; Dash, 2005; Bagchi & Banerjee, 2005; Agarwal & Bhattacharjea, 2006; Gourlay, Ravishankar, & Weyman-Jones, 2006; Mallikarjunappa, 2007, Tambi, 2007; Kumar & Rajib, 2007 b; Mantavadi & Reddy, 2008; Kumar, 2009; Leepsa and Mishra, 2012).
Objectives of the Study
The objective of this study to investigate into the long term impact on operating performance of the merging (acquiring and target combined) companies involved in M&As by comparing their aggregated post-merger performance with the aggregated pre-merger performance.
Data Source and Sample Selection
The study is intended to identify select M&As during the period from April 1, 2000 to March 31, 2010 and assess their impact on long term operating performance of merging firms. Data for the study are mainly secondary in nature. The required data were obtained from CMIE-PROWESS database.
Sample Selection Procedure
The criteria for the selection of a company to be included in the sample
are:-• The companies are cross-listed in both BSE and NSE.
• Both the acquirer and target companies should be listed on the stock exchanges at the date of announcement.
• The transaction has to be announced between April 1, 2000 and March 31, 2010.
• All the deals should be completed.
• Acquirers' and targets' nation is India.
• Duplicate deals were not considered.
• Financial services firms are excluded as the motive for an acquisition of a financial service firm might be very different and also financial service firms are highly regulated.
• Only majority acquisitions have been considered. The majority acquisitions are defined as the percentage of shares owned before the acquisition is less than 50 % and after the acquisitions are more than 50 %.
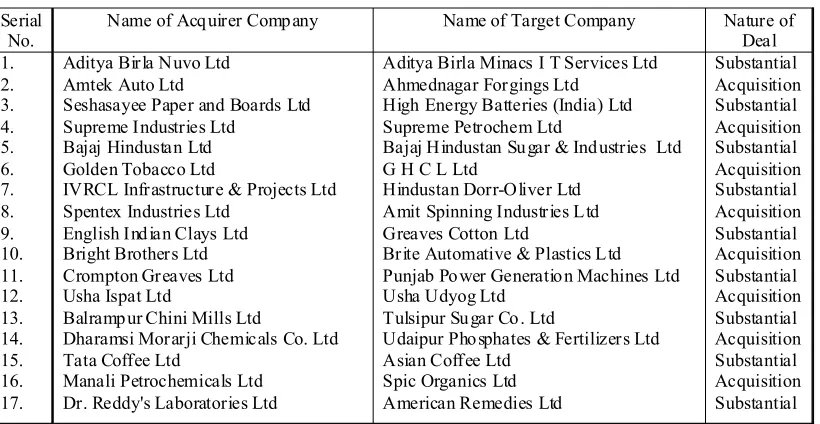
The final sample comprises of 51 pairs of acquiring and target companies from across various industries involved in M&A during the aforementioned period shown in table 1. There are 42 pairs of acquiring and target firms involved in mergers while remaining 9 pairs are substantial acquisition deals.
Research Methodology
This study uses cash flow measure of accounting performance technique for evaluating the real impact of M&As on long term shareholders' value creation. The study has been conducted on 51 pairs of selected merging acquiring and target firms occurring during the period from April 1, 2000 to March 31, 2010. This period helps ensure that three years of financial data for companies both before and after the mergers and acquisitions are available for the purpose of the analysis.
Traditional accounting measures suffer from their own limitations. Therefore this study uses cash flow measures since it is considered to be an accurate indicator of productivity/efficiency effects which result from a combination (Switzer, 1996).
The pre- and post-merger operating performance of merging firms relative to industry is compared based on two models. In the first model, cash flow was deflated by book value of assets. In the second model, cash flow was deflated by market value of assets.
Table 1: Companies Selected for Accounting Performance (Cash Flow Return) Study
Serial No.
Name of Acq uirer Comp any Name of Target Company Nature of Deal 1. 2. 3. 4. 5. 6. 7. 8. 9. 10. 11. 12. 13. 14. 15. 16. 17.
Aditya Birla Nuvo Ltd Amtek Auto Ltd
Seshasayee Paper and Boards Ltd Supreme Industries Ltd
Bajaj Hindustan Ltd Golden Tobacco Ltd
IVRCL Infrastructure & Projects Ltd Spentex Industries Ltd
English Ind ian Clays Ltd Bright Brothers Ltd Crompton Greaves Ltd Usha Ispat Ltd
Balramp ur Chini Mills Ltd
Dharamsi Morarji Chemicals Co. Ltd Tata Coffee Ltd
Manali Petrochemicals Ltd Dr. Reddy's Laboratories Ltd
Aditya Birla Minacs I T Services Ltd Ahmednagar Forgings Ltd
High Energy Batteries (India) Ltd Supreme Petrochem Ltd
Bajaj Hindustan Su gar & Ind ustries Ltd G H C L Ltd
Hindustan Dorr-Oliver Ltd Amit Spinning Industries L td Greaves Cotton Ltd
Brite Automative & Plastics L td Punjab Po wer Generatio n Machines Ltd Usha Udyog Ltd
Tulsipur Su gar Co . Ltd
Udaipur Pho sphates & Fertilizers Ltd Asian Coffee Ltd
Spic Organics Ltd American Remedies Ltd
Serial No.
Name of Acquirer Comp any Name of Target Company Nature of Deal 18. 19. 20. 21. 22. 23. 24. 25. 26. 27. 28. 29. 30. 31. 32. 33. 34. 35. 36. 37. 38. 39. 40. 41. 42. 43. 44. 45. 46. 47. 48. 49. 50. 51.
EID Parry (India) Ltd
Eveready Industries (India) Ltd Aurobindo Pharma Ltd Tata Power Co. Ltd Atlas Copco (India) Ltd Sun Pharmaceuticals Inds. Ltd Polar Industries Ltd
Kochi Refineries Ltd Hindustan Lever Ltd Pix Transmissions Ltd Supreme Industries Ltd Andhra Pradesh Paper Mills Ltd Glaxosmithkline Pharmaceuticals Ltd Aban Loyd Chiles Offsho re Ltd ITC Ltd
Reliance Industries Ltd Nicholas Piramal India Ltd Trident Ltd
J K Tyre & Inds. Ltd Mylan Laboratories Ltd Cosmo Films Ltd
Vijay Shanthi Builders Ltd Deepak Nitrite Ltd Nesco Ltd RSWM Ltd United Spirits Ltd. HIL Ltd
Gujarat Narmada Valley Fertilizers & Chemicals Ltd
Reliance Industries Ltd Indian Oil Corporation Ltd Coromandel International Ltd Gulshan Polyols Ltd
Grauer & Weil (India) Ltd Keerthi Industries Ltd
Pettavaittalai Sugars & Chemicals Ltd Bishnauth Tea Co. Ltd
Sri Chakra Remed ies Ltd
T ata Hydro Electric Power Supp ly Co.Ltd Chicago Pneumatic India Ltd
Pradeep Drugs Co. Ltd Polar Fan Industries Ltd
Cochin Refineries Balmer Lawrie Ltd International Bestfoo ds Ltd
Pix Autos Ltd
Supreme Oriented Films Ltd Coastal Papers Ltd
Smithkline Beecham Pharmaceuticals (India) Ltd
Hitech Drilling Services India Ltd ITC Bhadrachalam Paperboards Ltd Reliance Petroleum Ltd (1993) Rhone-Po ulenc (Ind ia) Ltd Varinder Agro Chemicals Ltd Vikrant Tyres Ltd
Medicorp Technologies India Ltd Gujarat Propack Ltd
Akash Housing Ltd Aryan Pesticides Ltd Indabrator Ltd Jaipur Polyspin Ltd Herb ertsons L td
Malabar Building s Products Ltd Narmada Chematur Petrochemicals Ltd Indian Petrochemicals Corp n. Ltd IBP Co. Ltd
Godavari Fertilizers & Chemicals Ltd Gulshan Sugars & Chemicals Ltd Bombay Paints Ltd
Hyderabad Flextech Ltd
Acquisition Merger Merger Merger Merger Merger Merger Merger Merger Merger Merger Merger Merger Merger Merger Merger Merger Merger Merger Merger Merger Merger Merger Merger Merger Merger Merger Merger Merger Merger Merger Merger Merger Merger Merger Merger
The financial data for the year in which merger occurred is omitted in order to control for accounting differences and any one time merger cost incurred during the merger which would otherwise make it difficult to compare them with the results for other years.
year. The weights are the relative size of their operating assets at the beginning of the year. This gives an idea about the performance of the acquiring and acquired firms if they had not merged and has continued as separate entities.
The raw operating performance obtained using the procedure outlined above are adjusted for industry and economic effects by the median industry operating performance. The pre-merger industry-adjusted cash flow return (IACFi,t,PRE) of the acquiring-target firm pair in any year t is the difference between total raw cash flow returns and the total industry returns from the equation as under:
IACFi,t,PRE = CFi,t,PRE - CFInd,i,t,PRE
After determination of pre-merger performance, we find out the post-merger performance. The post- merger performance is calculated based on financial data of the combined firm (i.e., in case of merger, on the basis of data of newly formed merged entity and in case of acquisition, based on aggregated data of acquiring and acquired firm). The post-merger industry-adjusted cash flow return (IACFi,t,post) for each year t for each of the merged entities is the difference between their raw cash flow return and the industry returns for the combined (merged) firm for that year.
The study uses both parametric and non-parametric tests to check statistical significance of results obtained. The parametric tests used include one-sample t-test and paired t-test. The non-parametric Wilcoxon Sum of Rank test has also been conducted to verify the results obtained using parametric paired sample t-test despite the fact that sample size is large (> 30). This has been done due the fact the data on the difference between AIACFPRE and AIACFPOST is not found to be normal.
Hypothesis
The impact of M&As on shareholders' value in long term is analyzed by assessing improvement in the operating performance in terms of comparing industry-adjusted cash-flow return in 3 years before and after the year of M&A.
Ho: The mean aggregate industry-adjusted operating cash flow (AIACFi, PRE) returns in pre-M&A period is equal to mean aggregate industry-adjusted operating cash flow (AIACFi, POST) in post-M&A period.
Against alternative hypothesis:
H1: The mean aggregate industry-adjusted operating cash flow (AIACFi, POST) returns in post-M&A period is higher than the mean aggregate industry-adjusted operating cash flow (AIACFi, PRE) returns in pre-M&A period.
Results and Discussion
This difference is found insignificant at the 5 per cent level in both paired sample t-test as well as Wilcoxon Z-test using one-tailed test. The null hypothesis is thus accepted which states that there are no significant differences between mean aggregate industry-adjusted operating cash flow return before and after M&A.
Table 2: Change in Post-Merger Performance based on Book Value
Test Used Test Statistic Paired t-test for equality of the means of the aggregate industry-adjusted t = -1.01 Operating cash flow returns post- (10.84%) and pre-merger (7.13%)
Wilcoxon test for paired samples Asymp. Si g. (One-tailed) = 0.48
Note: Tabulated value of t, 5 per cent significance level, using one-tailed test = 1.645
Similarly, difference between AIACFi, POST and AIACFi, PRE based on market value of assets is analyzed separately. Table 3 presents the results of paired sample t-test and Wilcoxon Z-test. It is found to be insignificant at -1.87 per cent using one-tailed test under both paired sample t-test as well as Wilcoxon Z-test at 5 per cent significance level. The null hypothesis is thus accepted which states that there is no significant difference between mean aggregate industry-adjusted operating cash flow return before and after the year of M&A.
Table 3: Change in Post-Merger Performance based on Market Value
Test Used Test Statistic Paired t-t est for equality of the means of the aggregate industry-adjustedt = 1.024
Operating cash flow returns post (2.42%) and pre-merger (4.29%)
Wilcoxon test for paired samples Asymp. Sig. (One-t ailed) = 0.12
Note: Tabulated value of t at 5 per cent significance level, using one-tailed test = 1.645
In addition to assessing post-M&A performance above, this study has also attempted to verify whether the yearly mean aggregate industry-adjusted operating cash flow return in each year before and each year after the year of M&A is not significantly different from zero.
The results of one-sample t-test and Wilcoxon Z-test on yearly returns based on book value are presented in table 4. It shows that yearly mean return AIACF is significantly positive for each of 3 years before M&A at 8.757 per cent in M-3, 5.081 per cent in M-2 and 7.549 per cent in M-1 year respectively.
Table 4: Mean Industry-Adjusted Cash Flow (IACF) Return based on Book Value Three Years Before and After Merger and Acquisition
Year relative to M&A
Mean
Abnormal
Return
t-Test
Wilcoxon Test
(Asymp. Sig.-two
tailed
)
Before merger and acquisition
M-3
M-2
M-1
8.757
5.081
7.549
t = 3.465
t = 2.489
t = 2.761
0
0.008
0.008
After merger and acquisition
M+1
M+2
M+3
56.389
31.009
-54.878
t = 1.205
t =1.368
t = -0.937
0.035
0.009
0.105
Note: Tabulated value of t, 5 per cent significance level, using two-tailed test = 1.960
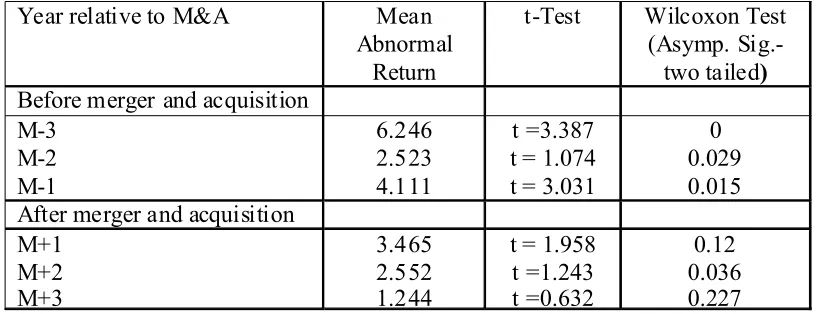
The results of one-sample t-test and Wilcoxon Z-test on yearly AIACF return based on market value is separately calculated and are presented in table 5. It is found that yearly AIACF is significantly positive in each of three years before the year of M&A at 6.246 per cent in 3, 2.523 per cent in M-2 and 4.111 per cent in M-1 year respectively using Wilcoxon Z-test.
It is further found that yearly AIACF is positive but insignificant in M+1 year but significant in M+2 year. However, it is found to be positive but insignificant in M+3 year.
Table 5: Mean Industry-Adjusted Cash Flow (IACF) Return based on Market Value Three Years Before and After Merger and Acquisition
Year relative to M&A
Mean
Abnormal
Return
t-Test
Wilcoxon Test
(Asymp.
Sig.-two tailed
)
Before merger and acquisition
M-3
M-2
M-1
6.246
2.523
4.111
t =3.387
t = 1.074
t = 3.031
0
0.029
0.015
After merger and acquisition
M+1
M+2
M+3
3.465
2.552
1.244
t = 1.958
t =1.243
t =0.632
0.12
0.036
0.227
Note: Tabulated value of t, 5 per cent significance level, using two-tailed test = 1.960
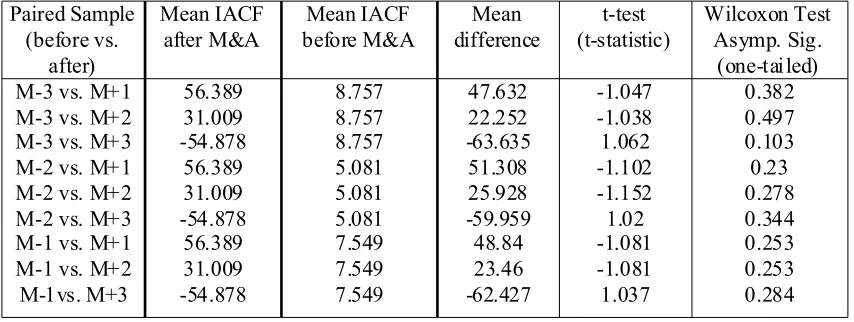
each year after the M&A year. The paired samples mean difference have been tested for significance using both t-test as well as Wilcoxon Z-test on data based on book value and the results are shown in table 6.It is found that mean differences are positive but insignificant for 6 out of 9 time-point comparisons viz., in M-3 vs. M+1; M-3 vs. M+2; M-2 vs. M+1; M-2 vs. M+2; M-1 vs. M+1; and M-1 vs. M+2. But the mean differences are found negative but insignificant in 3 out of 9 time-point comparisons viz., in M-3 vs. M+3; M-2 vs. M+3; and M+1 vs. M+3. It is found that none of the differences are significant in any of these 9 comparisons. Therefore, it re-establishes the findings made while comparing the pre-M&A AIACF with post-M&A AIACF overall.
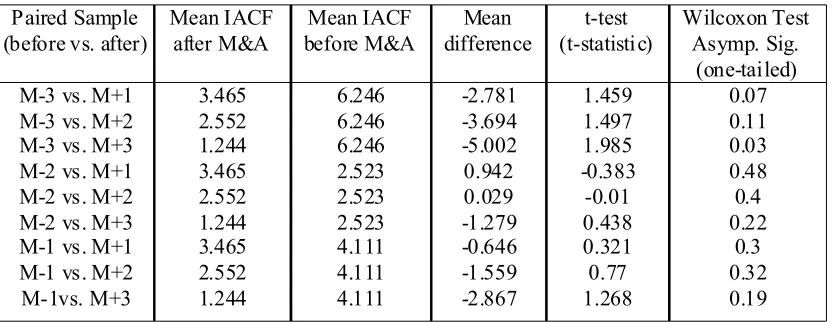
The paired samples mean difference have been tested for significance using both t-test as well as Wilcoxon Z-test on data based on market value separately and the results are shown table 7. It is found that mean differences are negative and significant in 1 out of 9 time-point comparisons viz., in M-3 vs. M+3 while insignificant in other 6 comparisons viz., in M-3 vs. M+1; M-3 vs. M+2; M-2 vs. M+3; M-1 vs. M+1; M-1 vs. M+2 and M-1 vs. M+3. But the mean differences are found positive but insignificant in 2 out of 9 time-point comparisons viz., in M-2 vs. M+1 and M-2 vs. M+2.
Table 6: Comparison of Operating Performance on Year-on-Year basis based on Book Value Before and After Merger and Acquisition
Paired Sample (before vs.
after)
Mean IACF after M&A
Mean IACF before M&A
Mean difference
t-test (t-statistic)
Wilcoxon Test Asymp. Sig.
(one-tai led) M-3 vs. M+1
M-3 vs. M+2 M-3 vs. M+3 M-2 vs. M+1 M-2 vs. M+2 M-2 vs. M+3 M-1 vs. M+1 M-1 vs. M+2 M-1vs. M+3
56.389 31.009 -54.878 56.389 31.009 -54.878 56.389 31.009 -54.878
8.757 8.757 8.757 5.081 5.081 5.081 7.549 7.549 7.549
47.632 22.252 -63.635 51.308 25.928 -59.959
48.84 23.46 -62.427
-1.047 -1.038 1.062 -1.102 -1.152 1.02 -1.081 -1.081 1.037
0.382 0.497 0.103 0.23 0.278 0.344 0.253 0.253 0.284
Table 7: Comparison of Operating Performance on Year-on-Year basis based on Market Value Before and After Merger and Acquisition
Paired Sample (before vs. after)
Mean IACF after M&A Mean IACF before M&A Mean difference t-test (t-statisti c) Wilcoxon Test Asymp. Sig. (one-tailed) M-3 vs. M+1
M-3 vs. M+2 M-3 vs. M+3 M-2 vs. M+1 M-2 vs. M+2 M-2 vs. M+3 M-1 vs. M+1 M-1 vs. M+2 M-1vs. M+3 3.465 2.552 1.244 3.465 2.552 1.244 3.465 2.552 1.244 6.246 6.246 6.246 2.523 2.523 2.523 4.111 4.111 4.111 -2.781 -3.694 -5.002 0.942 0.029 -1.279 -0.646 -1.559 -2.867 1.459 1.497 1.985 -0.383 -0.01 0.438 0.321 0.77 1.268 0.07 0.11 0.03 0.48 0.4 0.22 0.3 0.32 0.19
In conclusion, it may be stated that the overall position of the selected companies included in the sample have not significantly improved in the post-M&A period. Thus, the study establishes the fact that M&A as strategy of growth for companies is not able to create shareholder value in the long-term.
Summary and Conclusions
M&As as strategy of growth is found not helping in improving corporate performance for the combined firm in the long term based on evaluation of long term operating performance. It is found that there is no improvement in the post-M&A performance. The difference between AIACFi, POST and AIACFi, PRE is found insignificant based on both the book as well as the market value.
It is found that firms involved in M&As have realized significant abnormal returns in each of three years before the year of completion of M&A deal. However, they realize significant abnormal return in M+1 and M+2 year after the year of M&A using book value and in M+2 year only using market value. It is further found that the rate of abnormal return after the year of M&A is significantly higher in +1 and +2 year based on book value compared to the each of three years before indicating that operating performance improved up to 2 years after the year of M&A but it is neutralized by substantive losses in the 3rd year.
But, the situation is different when analysis is done based of market value. It is found that rate of abnormal return in post-M&A years is lower and insignificant compared to pre-M&A period except in M+2 year.
The results obtained in time-point comparison based on book value reveal that there is no significant difference between means in any of these 9 time-point comparison using book value.
performance of firms involved in M&As has significantly deteriorated in the third year after the year of M&A when compared to 3 year before.
Implications for Policy Makers
Despite the fact that M&As are not found helping in improving corporate performance for combined firm, what motivates CEOs of companies to engage in merger and acquisitions (M&As). They need to re-orient their motivations before engaging in M&As in line with corporate objective of creating shareholders' value for long term well-being of the company as well as themselves.
References
1. Agarwal, A., Jaffe, J.& Mandelkar, G. (1992).The post-merger performance of acquiring firms: a re-examination of an anomaly. Journal of Finance, 47(4), 1605-1621.
2. Agarwal, M., & Bhattacharjea, A. (2006). Mergers in India: A response to regulatory shocks. Emerging Markets Finance and Trade,42(3), 46-65.
3. Bagchi, A. K., & Banerjee, S. (2005). How strong are the arguments for bank merger?. Economic and Political Weekly, 40(12), 1181-1189.
4. Barber, B.M., &Lyon, J.D. (1997). Detecting long run abnormal stock returns: The Empirical Power and Specification of test statistics. Journal of Financial Economics, 43(3), 341-372.
5. Beena, P. L. (2000). An Analysis of Mergers in the Private Corporate Sector in India. Centre for Development Studies, Trivandrum,Working Paper, 301, 3-56.
6. Beena, P.L. (2004). Towards understanding the merger wave in the Indian corporate sector - a comparative perspective. Centre for Development Studies, Trivandrum, Working Paper, 355, 1-34.
7. Bhanu, V. (2005). Merged companies: Their profitability performance. Indian Journal of Accounting, 35(2), 11-19.
8. Chatterjee, R., & Meeks, G. (1996). The financial effects of takeover: Accounting rates of return and accounting regulation. Journal of Business Finance and Accounting, 23(5-6), 851-868.
9. Clark, K. & Ofek, E. (1994). Mergers as a means of restructuring distressed firms: an empirical investigation. Journal of Financial and Quantitative Analysis, 29, 541-565.
10. Cornett, M. M. & Tehranian, H. (1992). Change in Corporate Performance Associated with Bank Acquisitions. Journal of Financial Economics, 31(2), 211-234.
11. Dash, A. (2005). The post-merger performance puzzle: An evaluation of long-term profitability of Indian firms. The ICFAI Journal of Accounting Research, 4(1), 6-23.
12. Feroz, E., Kim, S. & Raab, R. (2005). Performance Measurement in Corporate Governance: Do Mergers Improve Managerial Performance in the Post-Merger Period?. Review ofAccounting and Finance, 4, 86-101.
13. Gangadhar, V., & Reddy, G. N. (2007). Mergers and acquisitions in the banking sector: an empirical analysis. ICFAI Reader, 7(3), 43-50.
Journal of Corporate Finance, 7(2), 151-178.
15. Gourlay, A., Ravishankar, G., & Weyman-Jones, T. (2006). Non-parametric analysis of efficiency gains from bank mergers in India. Department of Economics, Loughborough University, UK, Discussion Paper Series, WP 2006-17.
16. Healy, P.M., Palepu, K.G. & Ruback, R. (1992). Does corporate performance improve after mergers success?. Journal of Financial Economics, 31(2), 135-175.
17. Ismail, T. H., Abdou, A. A. & Annis, R. M. (2010). Exploring Improvements of Post-Merger Corporate Performance- the Case of Egypt. the ICFAI University Journal of Business Strategy (forthcoming). 18. Joshi, K. K. (1991). Take-over bid and stock market discipline. Indian Journal of Finance and
Research,1(1), 69-72.
19. Kaur, G. (2005). Corporate Mergers and Acquisitions. Deep and Deep Publication Pvt. Ltd., New Delhi. 20. Kaur, S. (2002). A Study of Corporate takeover in India. PhD Thesis Abstract, Submitted to University
of Delhi, 1-11.
21. Kaveri, V S (1986). Financial Analysis of Company Mergers in India. Himalaya Publishing House, New Delhi.
22. Kumar, A. N. & Parchure, R. (1990). Mergers and Takeovers in India. Times ResearchFoundation, Pune.
23. Kumar, B. R., & Rajib, P. (2007a). Characteristics of merging firms in India: An empirical examination. Vikalpa,32(1), 27-44.
24. Kumar, B. R., & Rajib, P. (2007b). Mergers and corporate performance in India: An empirical study. Decision, 34(1), 121-147.
25. Kumar, R. (2004). Effect of RPL-RIL merger on shareholder's wealth and corporate performance. The ICFAI Journal of Applied Finance, 10(9), 13-35.
26. Kumar, R. (2009). Post-merger Corporate Performance: an Indian Perspective. Management Research News, 32(2), 145-157.
27. Lau, B., Proimos, A. & Wright, S. (2008). Accounting Measures of Operating Performance Outcomes for Australian Mergers. Journal of Applied Accounting, 9(3), 168-180.
28. Leepsa, N. M. & Mishra, C. S. (2012). Post-Merger Financial Performance: A study with Reference to Select Manufacturing Companies in India. International Research Journal of Finance and Economics, 83.
29. Majumdar, S., Moussawi, R. & Yaylacicegi, U. (2007). Quest for Efficiency: Assessing the impact of Mergers on Performance in the U.S. Telecommunication Industry.Working Paper series, available at: www.ssrn.com (Accessed on March, 15, 2008).
30. Mallikarjunappa, T. (2007). Have the mergers and acquisitions benefited the companies in India?. In D. Bhagaban, & A. K. Pramanik (Eds.). Mergers and Acquisitions: Indian Scenario. Kanishka Publishers, Distributors, New Delhi, 193-222.
32. Manson, S., Powell, R., Stark, A. & Thomas, H. (2000). Identifying the Sources of Gains from Takeovers. Accounting Forum, 24 (4), 1-25.
33. Mantravadi, P. &Reddy. A.V., (2008). Type of merger and impact on operatingPerformance: the Indian experience. Economic and Political Weekly, 43, 66-74.
34. Meeks, G. (1977). Disappointing Marriage: A Study of Gains from Merger. University of Cambridge, Occasional Paper 51, Cambridge University Press, Cambridge, U.K..
35. Mueller, D. (1980). The Determinants and Effects of Mergers: an International Comparison. Oelgeschlager, Gunn & Hain, Cambridge, MA.
36. Rahman, R. A. & Limmack, R. J.(2004). Corporate Acquisitions and Operating Performance of Malayasian Companies. Journal of Business Finance & Accounting, 31(3-4), 359-400.
37. Ramakrishnan, K., (2008). Long Term Post Merger Performance of firms in India. Vikalpa, 33(2), 47-63. 38. Ramaswamy K. P., & Waegelein J.F. (2003). Firm Financial Performance following Mergers. Review of
Quantitative Finance and Accounting, 20(2), 115-127.
39. Ravenscrafet, D. J. & Scherer, F. M. (1989). The Profitability of Mergers. International Journal of Industrial Organization, 7(1), 101-116.
40. Reddy, R., & Padma, S. (2005). Pre- and post-merger financial performance of selected companies. Indian Journal of Accounting,35(2), 29-38.
41. Vanitha, S. & Selvam, M., (2007). Financial Performance of Indian Manufacturing Companies during Pre- and Post-Merger. International Research Journal of Finance and Economics, 12, 7-35.
42. Selvam, M., Vanitha, S., & Babu, M. (2005). Mergers and acquisitions in the banking industry: An evaluation. The Management Journal, 40(10), 771-777.
43. Singh, A. (1971). Takeovers, Their Relevance to Stock Market and Theory of the Firm. Cambridge University Press, Cambridge.
44. Switzer, J. A. (1996). Evidence on Real Gains in Corporate Acquisitions. Journal of Economics and Business,48(5), 443-460.
45. Utton, M. (1974). On Measuring the Effect of Industry Mergers. Scottish Journal of Political Economy, 21(1), 13-28.