Abstract—There is a huge urge currently for the new, clean and renewable energy as well as the protection of environmental resources for the sustainable livelihood of human. In recent decades, microalgae received lots of attention for its carbon dioxide capturing potential and as a valuable feedstock for bioenergy. This study aimed to analyze the effect of geographical coordinates on carbon dioxide sequestration by microalgae using mathematical models. Ten sites at three different latitudes were chosen for the study based on geographical location of the places in the Equator, Tropic of Cancer and Tropic of Capricorn. The key model input parameters such as solar radiation and other climatic conditions for the identified potential sites were retrieved from NASA, USA databases and used as basis for estimating annual microalgal biomass production and carbon sequestration potential. The variation in microalgal productivities and carbon dioxide sequestering potential were very minimal at countries present in the Equator while the Tropic of Capricorn has relatively higher productivities than the countries present in the Tropic of Cancer. This study provides a baseline data for theoretical estimates and effect of photoinhibition on microalgal photobioreactor production systems in the selected study locations.
Index Terms—Carbon dioxide sequestration, geographical coordinates, mathematical modeling, microalgae, photoinhibition, photosynthesis.
I. INTRODUCTION
The current interdisciplinary scientific researchers are striving hard to address the key challenges of climate change that occurred as the result of environmental degradation. Several natural and anthropogenic actions are responsible for the deterioration of the environmental quality, and the critical issues are the pollution in all the environmental mediums such as water, air, and soil [1]. The rapid increase in the carbon dioxide (CO2) concentration in the atmosphere is one of the
principal cause of air pollution and the main contributor to global warming [2], [3]. This critical situation warrants the development of new technologies to control the CO2 emission
and concentration in the atmosphere as the use of the new and renewable energy, carbon capture and storage in the underground or the deep ocean. However, the sustainability of the process was not yet accomplished due to recurrence of high cost either for sequestration or for the conversion procedures to derive value-added products.
The mass cultivation of microalgae has been recognized as the cost effective, sustainable technologies for fixing up the
Manuscript received on March 27, 2016; revised August 22, 2016. The authors are with the Department of Biotechnology and Medical Engineering of National Institute of Technology, Rourkela, India (e-mail: [email protected], [email protected]).
carbon dioxide into microalgal biomass. The microalgae are preferred over higher plants due to their fast growth, survival on non-arable land and higher photosynthetic efficiency. Due to the higher yield of biomass and oil, the microalgal based biofuel has been emerging as the third generation of biofuel. Further, the microalgal biomass could act as valuable resources for food, feed and fuel [4], [5]. However, the site selected for microalgae cultivation at large scale should meet the following criteria: availability of sunlight throughout the year; favorable climatic conditions, precipitation and evaporation, humidity, temperature, land topography and finally access to nutrients, carbon sources and water [6].
Though microalgae offers several opportunities and benefits in various domains of human life, still few challenges has to overcome for the sustainable production of desired products. For instance, with reference to the current situation the product costs derived from microalgae was not yet enough to challenge the lowest price of the conventional fossil fuels. Hence, the scalability and economics are the two most key challenges for sustainable production after the successful demonstration at laboratory scale. To minimize the risks associated with scalability and to influence the policy makers, the comprehensive knowledge of microalgal growth rate and carbon dioxide (CO2) captured from the atmosphere is highly
essential.
Several researchers attempted to investigate the impact of various influencing factors of microalgal growth. However, very limited studies are available on mathematical studies to find out the effect of latitude and photoinhibition on carbon dioxide sequestration by microalgal production at large scale. The theoretical maximum of microalgal oil production with prime focus on the effect of latitude were studied by considering six various places in the world such as Kuala Lumpur of Malaysia (3°N); Honolulu of Hawaii (21°N); Tel Aviv of Israel (32°N); Phoenix of Arizona (33°N); Malaga of Spain (37°N) and Denver of Colorado (40°N) [7]. Likewise, Sudhakar and Premalatha, (2012) studied the theoretical estimation of microalgae in the six different countries of each continent such as Texas, Uruguay, Ethiopia, Madrid, Chennai, and Queensland [8]. Further, similar procedures were utilized to estimate the microalgal production in the five different places of Ethiopia such as Addis Ababa (8.9° N, 38.8° E); Awasa (7.1° N, 38.5° E); Bahir Dar (8.6° N, 39.3° E); Mekele (13.5° N, 39.5° E) and Nazret (8.6° N, 39.3° E) [9].
Zemke et al., (2010) evaluated the maximal theoretical microalgal production for the estimation of triacylglycerides using biochemical and molecular approach of photon requirements of microalgae [10]. Wigmosta et al., (2011) investigated the theoretical predictions of microalgal production by incorporating the effect of water temperature
Effect of Geographical Coordinates on Carbon Dioxide
Sequestration Potential by Microalgae
on the production rates [11]. However, this study employed a software named MASS2 to find out the water temperature and the losses of water due to heat based on the hydrodynamics on the site locations. This present work focuses on the mathematical approach to analyze the effect of latitude on the theoretical estimation of microalgal biomass production and carbon dioxide sequestration in the ten different sites located on the Equator, Tropic of Cancer and Tropic of Capricorn.
II. METHODOLOGY
A. Site Selection and Its Geographical Coordinates
The effect of geographical coordinates for establishing microalgal culturing facility has to be understood as it requires sufficient amount of light to grow. Ten sites at three different latitudes were chosen for the study based on the geographical location of places in the Equator, Tropic of Capricorn and Tropic of Cancer. Four places on the latitude of exactly 23°26’ N and three places with 23°26’ S were considered on the Tropic of Cancer and Tropic of Capricorn. Likewise, three other locations at the latitude of 0°00’N were considered in the study as a reference to know the exact patterns of microalgal production in the center of earth. This selection of the study locations (Fig. 1) could assist in better interpretation of the effect of geographical coordinates on microalgal production rates. The list of the geographical coordinates for the selected places was presented in Table I.
TABLEI:GEOGRAPHICAL COORDINATES OF THE STUDY LOCATIONS Study locations Latitude Longitude
Mexico (Durango) 23°26’N 105°00’W
Lybia (Al Jawf) 23°26’N 25°00’E
India (Indore) 23°26’N 75°00’E
China (Zengcheng) 23°26’N 114°00’E Brazil (Pico da Neblina) 00°00’N 67°07’W DRCa (Kisangani) 00°00’N 25°00’E Indonesia (Kalimantan) 00°00’N 114°00’E Argentina (Jujuy) 23°26’S 67°07’W Botswana (Khutse) 23°26’S 25°00’E Australia (Coral Bay) 23°26’S 114°00’E
a
Democratic Republic of Congo
B. Retrieval of Solar Insolation Data for the Study
Locations
Since solar radiation is the main source of energy for the microalgal growth, the site-specific solar insolation data and other metrological parameters were collected from National Aeronautical and Space Administration (NASA), USA databases. The information for model inputs such as daily solar insolation in the horizontal of the site locations, and the air temperature at 10 m above the earth surface for all the study locations was obtained on daily basis from January 1985 to December 2005 [12]. The average of these 21 years of air temperature and solar radiation data were analyzed as the baseline information.
C. Model for the Estimation of Microalgal Production
Rates and Carbon Dioxide Sequestration Potential
The spatial variation in the solar insolation data due to the presence of cloud cover, micro pollutants and air particulates
in the macro environment were already incorporated while collecting the solar insolation data through geostationary meteorological satellites. Hence, the concentration of photon energy reaching the earth surface at the horizontal level was available directly from the retrieved solar insolation data. However, all the incoming solar insolation could not be utilized for microalgal growth, and only a meager amount of light energy might exploited for algal growth. For instance, the microalgae could utilize the only light energy available in Photosynthetically Active Radiation (PAR) of 400 to 700 nm wavelength for its growth, and a portion of the energy in this range is called Photosynthetically Photon Flux Density (PPFD).
Fig. 1. Locations of the selected site for the present study.
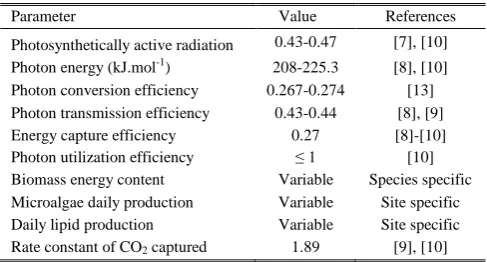
Since the light energy unutilized by microalgae could raise the water temperature of the pond and impacts the overall microalgal growth, the knowledge of heat and light energy balance of the system is highly warranted. In general, most of the incoming solar irradiance would be wasted or transformed into heat that hinders the microalgal growth rate severely. Therefore, the effect of geometry of culturing systems, the loss of energy due to reflection from the pond water should also be included in the energy balance model to predict the water temperature. In the case of heat energy balance, irradiance, radiation, evaporation, and conduction were considered along with the heat released by microalgae during its growth. The complete parameters used in the model for theoretical estimation and effect of photoinhibition were listed in Table II.
TABLEII:LIST OF PARAMETERS AND OPTIMAL VALUES UTILIZED IN THE CURRENT STUDY
Parameter Value References
Photosynthetically active radiation 0.43-0.47 [7], [10] Photon energy (kJ.mol-1) 208-225.3 [8], [10] Photon conversion efficiency 0.267-0.274 [13] Photon transmission efficiency 0.43-0.44 [8], [9] Energy capture efficiency 0.27 [8]-[10] Photon utilization efficiency ≤ 1 [10] Biomass energy content Variable Species specific Microalgae daily production Variable Site specific Daily lipid production Variable Site specific Rate constant of CO2 captured 1.89 [9], [10]
This model aimed to predict the realistic limit of microalgal production rates by accounting the plausible light energy distribution, land use efficiency, photon transmission and utilization efficiency, photosynthetic efficiencies, and microalgal oil content based on the literature data. The mean daily meteorological data, sunlight, ambient temperature and
rainfall information for the identified potential site is combined to estimate the daily biomass production, lipid production, and carbon dioxide mitigation potential.
D. Assumption and Limitation of the Model
Since sunlight is the key prime energy requirement of microalgal growth for its photosynthetic reaction through simultaneous assimilation of CO2 with subsequent conversion
to carbohydrates, utmost care has been given in retrieval of solar insolation data. The losses of solar energy due to site-specific atmospheric conditions such as cloud cover, presence of pollutants and particulate matters in air, duration of day time, and altitude of study sites were also represented in solar insolation data. All the calculations were done based on quantum of photons for the comprehensive understanding of biochemical effect of light.
Further, the model accounts the losses of energy due to the pond geometry also through energy balance by considering the photon capturing, transmission and utilization effects as well. Two different scenarios were taken into account for the study namely prediction of theoretical maximum microalgal production rates as well as with considering the impacts of photoinhibition too. The consequences of the photoinhibition while solar energy is higher than the normal required for microalgal growth is also incorporated in the model by varying the photon utilization efficiency related to available photons. Nutrients other than CO2 are unlimitedly available in
the water and presumed to be nil influence on the microalgal growth. The net change in water temperature is also negligible due to the diurnal variation on the open pond systems. Thus, the developed mathematical model has taken the account of several most influencing parameters for autotrophic microalgae to grow in open pond systems. The capability of biomass to absorb CO2 and the biochemical composition of
microalgae are also assumed based on the literature survey.
III. RESULTS AND DISCUSSION
A. Site Selection and Climatic Conditions
In this study, ten different places at three latitudes were chosen on Tropic of Cancer, Equator and the Tropic of Capricorn as shown in Fig. 1. Solar insolation data based on the availability of sunlight is the key prime necessity for estimating microalgal growth rate in the site specified conditions. In addition to solar availability throughout the year, other minimum requirements such as nominal ambient temperature on the sites, relative humidity, and precipitation, the presence of suitable land and water quality, availability of beneficial nutrients should be also satisfied for establishing the ideal microalgal culturing facility [6]. Precisely, eight moles of photons are required to convert one mole of carbon dioxide to carbohydrate by microalgae. The average yearly requirement of solar insolation for the survival and efficient growth of the microalgae is around 1500 kWh.m-2.year-1 as equivalent to 4.1 kWh.m-2.day-1.
The main factors such as monthly average solar radiation, air temperature at 10 m above the earth surface were obtained from NASA databases and analyzed as shown in Fig. 2. Out of the selected study locations, based on the baseline
information of 21 years average solar insolation data, except Zengcheng provinces of China, all other places have exhibited solar insolation of more than 4.1 kWh.m-2.day-1. Since all the study sites were in tropical region of the world, all have sufficient amount of sunlight for microalgal growth.
0 5 10 15 20 25 30
0 1 2 3 4 5 6 7 8
A
ir
te
m
p
e
ra
tu
re
(
°C)
So
la
r
ra
d
ia
ti
o
n
(
kW
h
/m
2/d
ay
)
A
lti
tu
d
e
(
km
)
Altitude Solar radiation Air temperature
Fig. 2. Variation of solar radiation, air temperature and altitude at the selected locations.
The highest of the solar radiation at 6.87 kWh.m-2.day-1 and the lowest of the air temperature at 3.78°C is present in Jujuy, Argentina. However, there is no direct correlation between the irradiance and the temperature because the hottest places are present in Brazil at 26.35°C, but the solar radiation is still normal. The other eight locations have the temperature ranged between 16.89°C in Mexico to 25.25°C in Democratic Republic of Congo (DRC). The solar insolation of China with 3.76 kWh.m-2.day-1 is the least than the prescribed average annual requirement of four kWh.m-2.day-1. However, air temperature is almost inversely proportional to the altitude of the site as Jujuy of Argentina is present at 3954 m above the sea level. The hottest in Brazil is in the coastal areas with altitude less than 200 m. Out of the selected locations, Brazil, China and Australia were present near the coastal zone at low altitudes and the other remaining places were located between 400 to 1800 m above the mean sea level. The second highest elevation after Argentina is in Mexico at 1796 m. The altitudes of the site is also one of the significant factors in choosing the best locations for establishing microalgal culturing facility as it influences the site temperature and overall microalgal growth rate severely.
Fig. 3.a represents the variation of monthly solar radiation for the selected locations in Tropic of Cancer. It is noteworthy to mention that the monthly variation of solar radiation at all these sites shows a specific pattern based on the latitude. For instance, four countries out of the selected ten study places in the Tropic of Cancer exhibited the variation of monthly solar insolation pattern in the form of inverted U. It represents that the first and last quarter of the year have lower solar insolation while the second and third quarter have relatively higher solar insolation. Since these countries are located in Northern hemisphere of the Earth, the solar insolation progressively increases after January month and reached highest solar insolation around June month. It could be easily correlated well with the summer season on second quarter of the year.
and exhibited nominal profile round the year.
2 3 4 5 6 7 8 9
Mexico Lybia India China
So
la
r
ra
d
ia
ti
o
n
(
kW
h
/m
2/d
ay
)
Jan Feb Mar Apr May Jun Jul Aug Sep Oct Nov Dec
(a)
2 3 4 5 6 7 8 9
Brazil DRC Indonesia
So
la
r
ra
d
ia
ti
o
n
(
kW
h
/m
2/d
ay
)
Jan Feb Mar Apr May Jun Jul Aug Sep Oct Nov Dec
(b)
2 3 4 5 6 7 8 9
Argentina Botswana Australia
So
la
r
ra
d
ia
ti
o
n
(
kW
h
/m
2/d
ay
)
Jan Feb Mar Apr May Jun Jul Aug Sep Oct Nov Dec
(c)
Fig. 3. Variation of monthly solar radiation on a) tropic of cancer b) equator and c) tropic of Capricorn.
Fig. 3.c signifies the change of monthly solar insolation in the countries present on the Tropic of Capricorn. These sites exhibited solar irradiation pattern in the form of U. It represents that the first and last quarter of the year have higher solar insolation while the second and third quarter have relatively lower solar insolation. Since these countries are located in the Southern hemisphere of the earth, the solar insolation progressively increases after July month.
B. Theoretical Microalgae Production Rate and Carbon
Dioxide Sequestration Potential
Most of the earlier studies predict the theoretical microalgal production rate based on solar insolation data only. However, the choice of suitable places for establishing microalgal culturing facility not solely depend on solar insolation, rather the photoinhibition effect due to highlight incidence levels and/or sub-optimal temperature range in the site-specific locations also has to be considered.
The highest biomass productivity is in Jujuy province of Argentina at 101.73 gm.m-2.day-1 and almost half (55.73 gm.m-2.day-1) were observed for the Zengcheng province of China. It could be well correlated with the solar insolation
available on the site-specific conditions. Likewise, the carbon dioxide capturing potential exhibited similar pattern as they directly depend on the microalgal growth rate. Carbon dioxide fixed by microalgae through photosynthesis is converted to carbohydrates, lipids, and proteins. The carbon content varies with microalgae strains, media and cultivation conditions. The extreme carbon dioxide sequestration efficiency among the selected study locations are ranged between 15.85 to 28.94 gm.m-2.day-1 at the China and Argentina respectively. The remaining eight places have the carbon dioxide sequestration around 20 to 26 gm.m-2.day-1 and the microalgal biomass production potential from 70 to 90 gm.m-2.day-1 as shown in Fig. 4. It could be observed that the change in the geographical coordinates is very crucial for the efficiency of microalgal growth.
0 20 40 60 80 100 120
M
ic
ro
a
lg
ae
a
n
d
C
O2
(g
m
/m
2/d
ay
)
Carbon dioxide sequestration Microalgal concentration
Fig. 4. Theoretical microalgal biomass production and carbon dioxide sequestration potential of selected study locations
The prediction of theoretical maximum microalgae production rate without taking into account of photoinhibition effect were considered as the first scenario in the present study. That means the photon transmission efficiency accounted for losses in light distribution, absorption characteristics, land use pattern and PAR of sunlight has been fully considered based on the site specific locations while the photon utilization efficiency was assumed to be 100 %. Though in reality, it could not be possible, this presumption could able to estimate the maximal theoretical microalgal production rate in the specified locations. However, the rest of assumptions such as water losses due to evaporation as well as the heat losses were also negligible in case of photobioreactors.
C. Effect of Photoinhibition on Microalgal Productivity
and Carbon Dioxide Sequestration Potential
The effect of photoinhibition has to be accounted to minimize the deviation of real time microalgal production rate from the theoretical predictions. Because the microalgal cell under optimal conditions could absorb all incident photons and utilized for microalgal growth. However, based upon the suboptimal conditions, a part of the absorbed photons could reemit as heat or damage the cells under high light incidence levels and/or at sub-optimal temperature range.
Fig. 5 depicts the effect of photoinhibition on microalgal biomass production rates and corresponding carbon dioxide fixing potential for the selected locations. As in the case of theoretical prediction, the Jujuy provinces of Argentina showed the maximal microalgal biomass production of 63.93 gm.m-2.day-1 while the minimal production was with the
Zengcheng of China at 47.17 gm.m-2.day-1. Due to the inclusion of photoinhibition effect, the average net change in microalgal production rates has diminished to 1.36 fold rather than that of two-fold in case of theoretical predictions. In event of Argentina and China with solar radiation of 6.87 and 3.76 kWh.m-2.day-1 at the altitude of 3954 and 192 m, the microalgal production rates have been diminished by 1.59 and 1.18 fold due to the photoinhibition effect. However, the change in microalgal production rates is not pertained to the solar radiation alone. For instance, in case of countries present on the Equator among the selected study locations such as Brazil, DRC, and Indonesia has a very minimal effect due to photoinhibition. It could be well correlated with the altitude of study locations as all were in the altitude of less than 500 m. Since the earth is an ellipse and turn around the sun in the same direction with an autorotation every day, all the places on same latitude might receive the similar solar radiation. Hence, with the same latitude of study locations, the altitude of the selected site could also play a significant role in microalgal growth rate.
0 20 40 60 80 100 120
M
ic
ro
a
lg
ae
a
n
d
C
O2
(g
m
/m
2/d
ay
)
Carbon dioxide sequestration Microalgal concentration
Fig. 5. Effect of photoinhibition on microalgal production and carbon dioxide sequestration potential on selected study locations.
The photon utilization, in general, is equivalent to 100% as per Bush equation demonstrates that the solar incidence energy is lesser than the saturated light. However, achieving the maximum photon utilization efficiency could never be possible in reality even in case of low incident light. Only very few researchers addressed these issues in the literature survey. For instance, Chain and Amon (1977) postulated that the maximum photon utilization efficiency could never be achieved in reality and it is always better to multiply with the constant factor of 0.85 in Bush equation for mimicking the real time scenarios [14]. However, higher insolation could severely influence the photon utilization efficiency of microalgae and thus hindered the overall microalgal growth rate. It is due to the fact that the term photon utilization efficiency accounts for attenuation in photon absorption due to suboptimal conditions of the algal culture. Under low light intensity conditions, the utilization capacity of microalgae in general range from 50-90% and could able to achieve 10-30% only when exposed to very high light on the outdoor conditions [15].
The optimal temperature for the effective microalgal growth is ranged between 20 to 25°C. However, the microalgae could be able to survive between 10 to 35°C and beyond this lethal temperature, most of the microalgal cultures could not survive [8]. These critical situations led to
the inhibition of microalgal growth rate by severely influencing the photosystem II of the photosynthetic reactions. Therefore, the effect of temperature on the microalgal growth has also to be accounted in the model.
D. Annual Microalgal Production Yields and Carbon
Dioxide Sequestration Potential
The estimate of microalgal production at large scale for a year should account the losses due to shut down of the facility for maintenance. With an optimistic view, the number of the working days was assumed to 300 per year allowing a break in the production for around two months. However, the maximal microalgal biomass production remains with Jujuy province of Argentina in case of without and with photoinhibition at 336.43 and 211.52 ton.ha-1.yr-1, respectively. Likewise, the best carbon dioxide sequestration potential in Argentina are at 95.77 and 60.21 ton.ha-1.yr-1 as presented in Table III and Table IV.
Asmare et al., (2013) reported that the annual biomass productivities are in the range of 300 ton.ha-1.yr-1 for Ethiopian conditions. Sudhakar and Premalatha (2012) predicted the annual average biomass yield under most likely conditions of 6 % photosynthetic efficiency ranged around 250 ton.ha-1.yr-1 for Texas of USA. However, the effect of inhibition of microalgal growth due to the energy photon is the key important parameter to find out the deviations from the theoretical predictions of microalgal production rates. Around 30 % reduction in the microalgal production rates were noticed on the study locations as shown in Table IV.
TABLEIII:THEORETICAL ANNUAL MICROALGAL BIOMASS PRODUCTION AND CARBON DIOXIDE SEQUESTRATION
Study locations
Microalgal production (ton.ha-1.yr-1)
CO2
sequestration (ton.ha-1.yr-1)
Mexico (Durango) 283.43 ± 7.51 80.68 ± 2.14 Lybia (Al Jawf) 311.30 ± 7.07 88.62 ± 2.01 India (Indore) 252.01 ± 6.81 71.74 ± 1.94 China (Zengcheng) 184.30 ± 8.07 52.46 ± 2.30 Argentina (Jujuy) 336.43 ± 9.36 95.77 ± 2.66 Botswana (Khutse) 282.66 ± 6.01 80.47 ± 1.71 Australia (Coral Bay) 282.12 ± 6.45 80.31 ± 1.84 Brazil (Pico da Neblina) 223.02 ± 5.77 63.49 ± 1.64 DRC (Kisangani) 234.14 ± 4.96 66.65 ± 1.41 Indonesia (Kalimantan) 234.21 ± 5.35 66.67 ± 1.52
TABLEIV:EFFECT OF PHOTOINHIBITION ON ANNUAL MICROALGAL PRODUCTION AND CARBON DIOXIDE SEQUESTRATION POTENTIAL
Study locations
Microalgal production (ton.ha-1.yr-1)
CO2
sequestration (ton.ha-1.yr-1)
International Journal of Environmental Science and Development, Vol. 8, No. 2, February 2017
As shown in Fig. 4. and Fig. 5, the effect of latitude has a much significant impact rather than the effect of photoinhibition. The ranking of countries according to their microalgal productivities from the highest to lowest were Argentina, Lybia, Mexico, Botswana, Australia, India, Indonesia, DRC, Brazil and China. Excluding China, the least three and best three average biomass productivities and carbon dioxide sequestration potential were in the countries present in the equator and in the Tropic of Capricorn. The results of the present work were compared with literature for the validation of developed mathematical model as shown in Table V.
TABLEV:VALIDATION OF THE MODEL BY COMPARING WITH VALUES REPORTED IN THE LITERATURE
Localization Microalgal
productivity (ton.ha-1.yr-1)
CO2 captured
(ton.ha-1.yr-1)
References
Addis Ababa, Ethiopia 297.56 84.35 [9]
Awassa, Ethiopia 347.61 95.56 [9]
Bahir Dar, Ethiopia 357.24 97.23 [9]
Mekele, Ethiopia 363.19 102.95 [9]
Nazret, Ethiopia 360.82 86.19 [9]
Karattha, Australia 398.86 75.39 [16]
Rayong, Thailand 307.79 58.14 [16]
Rourkela, India 217.79 62.00 [17]
IV. CONCLUSION
An attempt is made to analyze the effect of geographical coordinates while setting up an algal farm for carbon dioxide sequestration. Though an ideal location to establish a microalgae farm would be tropical climates where the temperature is constantly above 15C, all other parameters such as solar incidence and the effect of photoinhibition has to be considered for realistic prediction of microalgal growth rates. Out of the selected study locations, Argentina showed maximal biomass production and China exhibited the lowest production. The variation in microalgal productivities and carbon dioxide sequestering potential were very minimal at countries present in the Equator. The Tropic of Cancer has relatively lower microalgal productivities than the countries present in Tropic of Capricorn.
ACKNOWLEDGMENT
The authors would like to thank the Government of India for the sponsorship of first author’s post graduation studies in India through the Indian Council for Cultural Relations (ICCR). The authors greatly acknowledge the support extended by National Institute of Technology Rourkela, India.
REFERENCES
[1] A. Bytnerowicz, K. Omasa, and E. Paoletti, “Integrated effects of air pollution and climate change on forests: A northern hemisphere perspective,” Environmental Pollution, vol. 147, no. 3, pp. 438-445, 2007.
[2] J. A. Patz, D. Campbell-Lendrum, T. Holloway, and J.A. Foley, “Impact of regional climate change on human health,” Nature, vol. 438, no. 17, pp. 310-317, 2005.
[3] T. R. Karl and K. E. Trenberth, “Modern global climate change,”
Science AAAS, vol. 302, pp. 1716-1723, 2003.
[4] T. M. Mata, A. A. Martins, and N. S. Caetano, “Microalgae for biodiesel production and other applications: A review,” Renewable
and Sustainable Energy Reviews, vol. 14, no. 1, pp. 217–232, 2010.
[5] P. Spolaore, C. Joannis-Cassan, E. Duran, and A. Isambert, “Commercial applications of microalgae,” Journal of Bioscience and
Bioengineering, vol. 101, no. 2, pp. 87–96, 2006.
[6] E. L. Maxwell, A. G. Folger, and S.E. Hogg, “Resource evaluation and site selection for microalgae production systems,” Washington, D. C.:
Rep. SERI/TR‐ 215‐ 2484, Solar Energy Res. Inst., 1985.
[7] K. M. Weyer, D. R. Bush, and A. Darzins, “Theoretical maximum algal oil production,” Bioenergy Research, vol. 3, no. 2, pp. 204–213, 2010. [8] K. Sudhakar and M. Premalatha, “Theoretical assessment of algal
biomass potential for carbon mitigation and biofuel production,”
Iranica Journal of Energy and Environment, vol. 3, no. 3, pp. 232-240,
2012.
[9] A. M. Asmare, B. A. Demessie, and G. S. Murthy, “Theoretical estimation the potential of algal biomass for biofuel production and carbon sequestration in Ethiopia,” International Journal of Renewable
Energy Research, vol. 3, no. 3, pp. 560-570, 2013.
[10] P. E. Zemke, B. D. Wood, and D. J. Dye, “Considerations for the maximum production rates of triacylglycerol from microalgae,”
Biomass and Bioenergy, vol. 354, pp. 145-151, 2010.
[11] M. S. Wigmosta, A. M. Coleman, R. J. Skaggs, and M. H. Huesemann, “National microalgae biofuel production potential and resource demand,” Water Resources Research, vol. 47, no. 3, pp. 1-13, 2011. [12] P. W. Stackhouse and J. M. Kusterer, “Surface meteorology and solar
energy,” NASA, 2005.
[13] C. Jacovides, F. Timvios, G. Papaioannou, D. Asimakopoulos, and C. Theofilou, “Ratio of PAR to broadband solar radiation measured in cyprus,” Agricultural and Forest Meteorology, vol. 121, no. 3, pp. 135–140, 2004.
[14] R. K. Chain and D. I. Arnon, “Quantum efficiency of photosynthetic energy use,” in Proc. the National Academy of Science, vol. 74, no. 8, pp. 3377-3381, 1977.
[15] G. Stanhill, “The distribution of global solar radiation over the land surfaces of earth,” Solar Energy, vol. 31, no. 1, pp. 95-104, 1983. [16] K. Das and P. A. Salam, “A generic methodology for geographical
assessment of microalgae potential,” School of Environment, Resources and Development, Asian Institute of Technology, Thailand, May, 2013.
[17] N. Aly and P. Balasubramanian, “Effect of photoinhibition on microalgal growth in open ponds of NIT Rourkela, India,” Journal of
Biochemical Technology, vol. 6, no. 3, pp.1034-1039, 2015.
Nazimdhine Aly received his bachelors in biotechnology from Institut Superieur Polytechnique de Madagascar.Currently he is a postgraduate scholar in the Department of Biotechnology and Medical Engineering of National Institute of Technology Rourkela, India through the Indian government sponsorship of Indian Council for Cultural Relations. He is presently involved in developing mathematical models for investigating the role of several influencing factors on microalgal growth for his master’s thesis. His research interests are in the field of bioenergy and environmental biotechnology.