EMBEDDED LINUX BASED DATA ACQUISITION SYSTEM FOR
ION MOBILITY SPECTROMETER
Ashutosh Kumar Singh1, K Lakshmi Latha2
1. INTRODUCTION
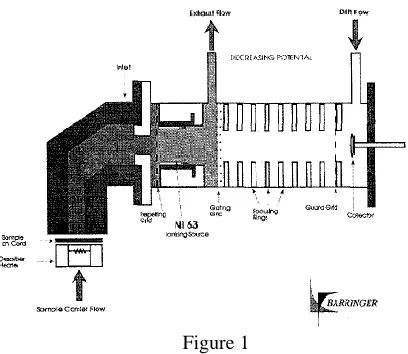
IMS or Ion Mobility Spectrometry is a detection technique that was developed in the late 1960’s to early 1970’s. The fundamental principle of operation is to separate ions according to mobility as they travel through a gas phase/ambient air in an electric field at atmospheric pressure. These ions will move at varying velocities as they travel down through the ambient air. The total time of travel is a function of the detector length, electric field strength, drift gas (i.e., air or pure nitrogen), temperature, and atmospheric pressure. The ionization source (reaction region) is designed for the continuous introduction of sample vapor [1].
Figure 1
Ion mobility spectrometry's greatest strength is the speed at which separations occur—typically in the order of tens of milliseconds. This feature combined with its ease of use and relatively high sensitivity, have allowed IMS as a commercial product across diverse areas in physical and biological sciences. When fast detection of explosives, chemical warfare agents and drugs is required, the ion mobility spectrometer may be the only suitable option. Ion Mobility Spectrometry is ideally suited as the technology used in trace detection equipment, as it is extremely sensitive, selective and fast. In IMS a vaporized sample is ionized by a weak nickel source. The resulting ions are gated into a drift tube, where under the influence of an electric field, they drift towards a collector electrode, resulting in an electric signal [2] (see Figure 1).
The drift time for each type of ion is unique, based on the source chemical from which it is derived. Using proper calibration, the drift times are measured and used to identify the parent chemical. Drift time are usually in the order of milliseconds [2] [3], allowing many separate analyses within a few seconds. In IMS technique sampling is done by either vapor method or
1 Instruments & Systems Division, Electronics Corporation of India Ltd., Hyderabad, India. 2 Instruments & Systems Division, Electronics Corporation of India Ltd, Hyderabad, India
DOI: http://dx.doi.org/10.21172/1.104.11
e-ISSN:2278-621X
Abstract—A design method of ARM, Embedded Linux based multi-channel data acquisition, control and analysis system for Ion Mobility Spectrometer with user friendly GUI is presented in this work. Hardware is designed using ARM SBC, ADC & Ion Mobility Spectrometer. To fulfill the software requirements, embedded software platform is built based on Linux kernel 2.6.32 to improve reliability, memory protection, cost effectiveness, real-time and multi-task processing capability. Device drivers for ADC, Keypad, LCD and other peripherals are developed. Embedded processor is transplanted with cross compiled Linux operating system as well as Qt GUI program to capture IMS data from the respective device, process, store & display data on touch screen LCD. The article gives detailed description of the above design, including transplantation of Linux kernel, Qt, Qwt, touch screen sources and device drivers and the compilation process.
particle method. In contrast to bulk detection, trace detection technologies focus on the minute quantities (picograms) of explosive compounds emanating from inside and/or residues found on the outside of an object [1] [4].
2. SYSTEM DESIGN
The advantages of ARM’s computing power, storage capacity, compact size and lower power consumption are considered for the design. As Linux is a popular operating system and the availability of open source code with higher real-time and stable performance offers a very attractive option for embedded operating system. So, system design aims at the processor with the MMU to facilitate transplantation of embedded Linux according to our needs to adapt to the system. Qt toolkit along with Qwt is selected to develop rich and powerful human machine interface with real-time analysis capability, dynamic graphics effects and performance using hardware accelerated graphics and QWS. As the Linux operating system supports the TCP/IP and USB protocol, system can transmit data directly to any Host as well as to printer.
The ARM-based portable data acquisition system based on IMS includes: swapper, drift-tube, HV power supplies, heaters, ARM SBC, multichannel ADC, touch screen LCD interface & Alarm. The design of the Data Acquisition System for Ion Mobility Spectrometer based on the ARM, embedded Linux, ADC and IMS is shown in Figure 2.
Figure 2
2.1 System Hardware Design
Hardware is designed in a way to keep the entire system in a single cabinet which can be carried by single person. System is designed using three boards to keep it modular: High Voltage interface board, Processor board (ARM Board) & ADC interface board.
High Voltage Interface Board: Controls high voltage power supplies. It also provides isolation between high voltage power supplies and other part of the circuitry.
ADC interface Board: The output of Drift Tube, HVPS (High Voltage Power Supply), HVPPS (High Voltage Pulsed Power Supply) is given as input to this board. It converts the analog signals into digital signals which is read by the Processor. Processor Board: It is the central control board which configures, controls and monitors the ADC and High Voltage power supplies. Apart from this, the Operating System & application reside in this board. It has a 7” TFT LCD with resistive touch screen, used in taking the input from user as well as output display.
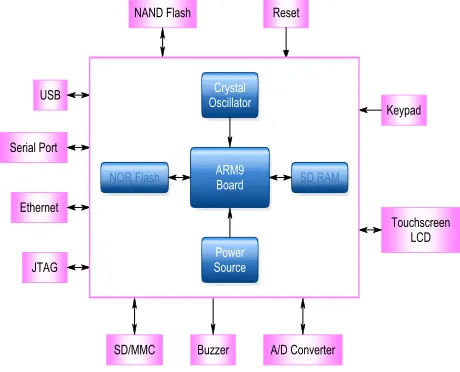
Peripherals of Processor Board are SD Card, NAND Flash, Ethernet Port, USB Port, DDR2 RAM, Application UART, Debug UART(useful in debugging the kernel as well as application of the target board), JTAG (see Figure 3).
2.2 System Software Design
Software design is described in three sections: Device Driver Development
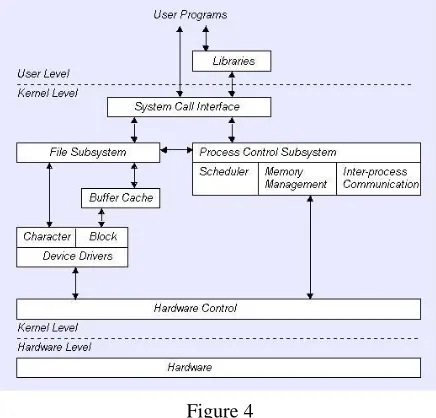
There are three types of Devices in Linux system, Character Devices, Block Devices and Network Devices. Character devices read and write data sequentially, and provide byte-stream operation to the user applications. They can provide additional interfaces not present in block drivers, such as I/O control (ioctl) commands, memory mapping, and device polling. Devices that support a file system are known as Block devices. Block devices can read and write data randomly. User-space applications need standardized interface open, close, read, write and lseek. Network devices are accessed via the BSD socket interface and the networking subsystems.
Figure 4
In Linux environment, programmers can build device drivers either as part of the kernel or separately as loadable modules. The advantage of loadable device drivers is that they can be loaded only when necessary and then can be unloaded, thus saving kernel memory. In Linux .ko modules contain loadable device drivers. Kernel modules have lot of advantages over writing code directly in the kernel. There is no need to recompile the whole kernel to add a new feature, it makes debug easier and allows preventing a specific piece of code to be executed. Writing a device driver requires an in-depth understanding of how the hardware and the software of a given platform functions. Drivers operate in a highly privileged environment and can cause disaster if they get things wrong.
Drivers in Linux can be developed in two ways: a) device driver is developed and exported to the kernel space as a module, and then equipment is mapped to a special device file in /dev folder. This device is treated as a file in Linux so that the application programs can use system calls such as read and write to operate it as an ordinary file. b) Device driver is developed and exported to the kernel space as a module, then equipment is mapped to an input event. The examples of this kind of device are keyboard, mouse, touch screen devices etc. The layered structure of the Linux kernel, device drivers, libraries and user programs is shown in Figure 4.
For this system, we have developed Character device drivers for multi channel ADC, waveform generator, keypad, LEDs and buzzer. While developing the device drivers, care has been taken for proper allocation and de-allocation of memory. Semaphores & ISR handling has been done properly to avoid any deadlock situation.
Kernel Configuration, Tailoring and transplantation
Embedded Linux is a small UNIX like operating system. Usage of embedded Linux is of great significance in the embedded development. Linux transplantation is to rewrite Linux operating system source code aimed at specific target platform, then install it to the target platform and make it run. With open source code availability, Linux kernel core can be cut and modified with necessary rewrite to the source code, to enhance the real-time performance of the system suitable to the system interface requirements as well as to reduce the size of the kernel, to make it portable to the specific ARM target. Adding required peripheral drivers to the kernel after customizing the kernel core, transplantation of the core to the target requires cross compilation. For the transplantation of kernel, the cross-compiler environment has been established on the host machine to compile and generate object code which runs on the target machine environment.
Kernel source code has been cut and modified for the target board using “make menuconfig” command and cross compiled using cross compiler tool chain.
Download the Linux source code and the ARM platform patch from the ARM website; The Linux kernel for ARM-based SoC is distributed as a GIT tree hosted on GitHub. To get the source code, we have to clone the repository
Apply the ARM's system architecture patch to the Linux source code Linux configuration and tailoring
We have to configure the Linux kernel according to our hardware. The default configuration for a particular SoC is a good starting point to adapt to our needs afterwards. Default configuration is written to .config file
$ make ARCH=arm <name of the SoC_defconfig>
At this step, we can modify default configuration using the menuconfig $ make ARCH=arm menuconfig
We can directly modify the configuration, by selecting the appropriate configuration options displayed. Y, N & M are the three options that represent the following meaning:
Y the function compiled into the kernel; N not compile the function into the kernel; M the function can be compiled into a module dynamically inserted into the kernel when needed
Build the Linux kernel image
$ make ARCH=arm CROSS_COMPILE=<cross-compiler-prefix-> zImage $ make ARCH=arm CROSS_COMPILE=<cross-compiler-prefix-> uImage
If the building process is successful, the final images can be found under arch/arm/boot/ directory Finally, Port the Image to the target board
Once bootloader startup parameters are configured properly, with the transplanted Linux, System can run stable with good performance.
Generally, development of the required drivers is done using the Host machine. The host machine is either desktop PC or server which is loaded with Linux & required GCC compiler suitable to the ARM architecture.
The host and target machines can use the serial port or tftp or NFS server communication. The drivers or executable files obtained after compilation and linking on the host machine can be downloaded to the target machine using serial port or network interface communication. For this purpose in Linux, we have used “minicom” terminal.
Application Software design
Before developing the application, development environment for the target has to be established on the host machine. We have developed the application software for Data acquisition System using Qt4.8.5 & Qwt5.2.0. The steps that are followed to carry out this activity are:
Qt4.8.5 sources compilation Qwt5.2.0 project compilation TSlib sources compilation
Copy library of Qt4.8.5, Qwt5.2.0 and TSlib to the target board Configure the environment in the target board
Cross compile the IMS application program Port the IMS application to the target board
Download the Qt sources from the link https://download.qt-project.org/official-releases/qt/4.8/4.8.5/qt-everywhere-opensource-src-4.8.5.tar.gz (now https://download.qt.io/archive/qt/4.8/4.8.5/qt-everywhere-https://download.qt-project.org/official-releases/qt/4.8/4.8.5/qt-everywhere-opensource-src-4.8.5.tar.gz), copy it into /usr/local folder. Extract the Qt sources, export the toolchain binaries to the PATH, modify the g++.conf, linux.conf & qws.conf files available in /usr/local/Qt4.8.5/mkspecs/common folder based on the arm architecture version as well as specify the touch screen library include path, so that Qt application responds to the touch screen events. Save the .conf files & create Qt directory in /usr/local folder and configure the Qt, make & make install to compile the Qt sources.
Figure 5
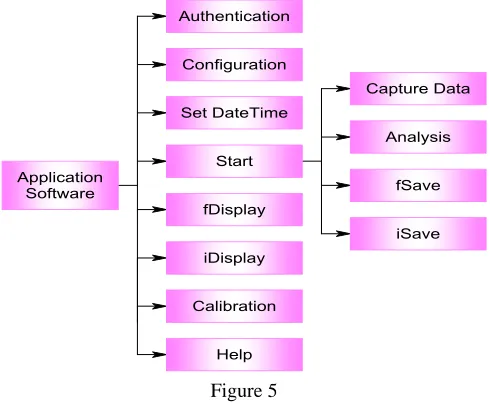
Capture: captures output voltage of IMS detector(drift tube) using ADC.
Analysis: constructs & plots the waveform of the captured data. Waveform is displayed in a graph, where X scale represents “time” in milliseconds and Y scale represents “voltage” in volts. Based on the peak value, drift time is computed. Moving average algorithm is used for noise filtering and multiple peak detection algorithm is implemented in order to detect more than one material (if present in the sample) at a time. Drift time(s) taken by the sample is compared with the available library data. If the drift time taken by the sample matches with more than one/any of the drift time value(s) specified in the library following actions are performed: 1.Alarm is generated 2.Red led glows to indicate “No Go” 3.Material(s) detected is displayed just below the captured ADC data waveform, with name of the material(s) along with the drift time(s) and peak value(s).
Figure 6
3. EXPERIMENT AND RESULT
The system was presented with samples of TNT, RDX & NITRO through surface wipe. The said sample after ionization passes through the IMS Detector. Samples were collected from the drift tube for 30 milliseconds. Based on the peak value of the collected ADC sample data, drift time is computed. Drift time taken by the sample is compared with the available library data and the graph is plotted on touch screen LCD with peak value(s) and material(s) detected. Total time taken by the system to identify the material after the sample was placed is less than a second. Figure 6 shows the spectra of 30 nanograms of TNT. The plotted graph is cross verified with the MSO (Mixed Signal Oscillator) by giving the same signal as input to the device i.e. output of the IMS Detector is connected to the MSO and it was found that both the graphs are identical.
4. CONCLUSION
since ample open source Linux customization tools are available. Qt application adds up to the performance of the system since programming language it uses is C++.
5. FUTURE WORK
In order to give a better look to the GUI of the system Android OS can be used by customizing it for the device hardware and security. To make the system more secure the biometric login can be implemented. In terms of hardware up-gradation the system can be upgraded to ARM11. Power consumption and size of the device are the factors that must be considered before upgrading the hardware as mobility of the devices give lot of flexibility. Temperature controllers can be used, to control & manipulate the temperature of different heaters. Monitoring the temperature of different heaters can be incorporated in the IMS application software
6. ACKNOWLEDGEMENT
This work is supported by Instruments & Systems Division of Electronics Corporation of India Limited (Govt. of India (Dept. of Atomic Energy) Enterprise), BARC (Bhabha Atomic Research Center) and IGCAR (Indira Gandhi Center for Atomic Research). The authors would like to thank Sri V V Satyanarayana (Head, ISD) for his support & guidance and IMS team members for their generous contributions.
7. REFERENCES
[1] Lawrence V. Haley and Julian M. Romeskie, “Development of an explosive detection system using fast GC-IMS technology”, IEEE 1998. [2] David Martinak, Andreas Rudolph, “Explosive Detection Using An Ion Mobility Spectrometer for Airport Security, IEEE 1997.
[3] Zhihong Wang, Zenbao Ling, Suyi Li, Jie Liu, Haiyang Liu, Ruifang Liu, Zhiwei Liu, “Development of arm-based measure & control analysis system of portable near-infrared spectrometer” International Conference on Computer, Mechatronics, Control and Electronic Engineering (CMCE) 2010. [4] L. Danylewych-May, C. Cumming, “Explosives and taggant detection with IONSCAN”, Proceedings of the 4th International Symposium on Analysis
of Explosives, Jerusalem, September 1992.
[5] L. Veiga, M. A. Mayosky, N. Martinez “A hardware/software environment for real time data acquisition and control”, IEEE transactions on nuclear science, vol 47, no 2, April 2000.
[6] ZhangWei, Li Rui, Wang ZhiHong, Liu Haiyang “The embedded data acquisition storage systems based on S3C2410”, ICIEA 2009.
[7] Rui Li, “Design of acquisition and control module of near-infrared spectrometer based onembedded systems”, Changchun:vJilin University, 2008, pp. 14-60.