Darren Couillard
Julie Garnett
Angel Hutchins
Rochester Public Schools, Minnesota
Mary L. Fawcett
Winona State University, Minnesota and
George Maycock
Appalachian State UniversityStudent Risk Factors Identified by School
Counselors and Student Achievement
The increasing emphasis in the United States on high-stakes testing for students and schools generates a great deal of quantitative data, but these data are less frequently linked to other data that are more difficult to obtain such as data on risk factors that may affect how students do on these tests. To make such comparisons, a group of counselors and counselor educators targeted a small urban school district to conduct a quantitative study of the relationship between grades, standard achievement test scores, and risk factors for K-12 students. Students in grades 4, 6, 8, and 9 were randomly selected and data were gathered from school counselors on relevant descriptive information and student risk factors. More than 50% of the students in this sample were affected by at least one risk factor. Students experiencing higher numbers of risk factors tended to have lower achievement test scores and lower grade point averages (GPAs) and were also likely to be male, Hispanic, or Black; to be receiving special education services; to have high rates of absent or tardy days; to have many suspensions or discipline reports; to have single, deceased, or stepparents; and/or to have free or reduced-price lunch status. This article discusses the research process, findings, and implications for educators, particularly in the light of other findings that the effects of some risk factors may be mitigated by the actions of school counselors.
Aux États-Unis, l’importance croissante que l’on accorde aux évaluations à enjeu élevé pour les élèves et les écoles produit beaucoup de données quantitatives. Cependant, ces données ne sont pas souvent mises en rapport avec d’autres données plus difficiles à obtenir telles que celles sur les facteurs de risque pouvant affecter la performance des élèves à ces
Darren Couillard is a licensed school counselor who has worked for the past five years at the high school, middle school, and elementary school levels.
Julie Garnett is a licensed school counselor who has worked as a secondary school counselor for nine years and is currently completing a doctoral program in educational leadership and change. Angel Hutchins is a licensed school counselor who has worked at the elementary school level for the past seven years. She has taken a leading role in creating the Rochester elementary school counseling program and in tracking and presenting data about elementary school counseling. Mary Fawcett is an associate professor of counselor education. She conducts research in the school setting to advocate for guidance services to all K-12 students.
examens. Dans le but effectuer de telles comparaisons, un groupe de conseillers et d’enseignants-conseillers ont entrepris une étude quantitative dans un district scolaire urbain. Ils se sont penchés sur le rapport entre les notes, les résultats aux tests de rendement et les facteurs de risque pour les élèves de la maternelle à la 12e année. On a sélectionné au hasard des élèves des 4e, 6e, 8e et 9e années et recueilli, auprès des conseillers, des données descriptives et de l’information sur les facteurs de risque pour les élèves. Plus de 50% des élèves de l’échantillon étaient affectés par au moins un des facteurs de risque. De façon générale, les élèves qui étaient touchés par le plus grand nombre de facteurs de risque avaient des résultats aux tests de rendement et une moyenne pondérée cumulative inférieurs; étaient mâles, hispaniques ou noirs; recevaient des services d’éducation spécialisée; affichaient un taux d’absentéisme ou de retard élevé; avaient souvent été renvoyés temporairement de l’école ou fait l’objet de rapports disciplinaires; provenaient d’une famille monoparentale ou reconstituée; et recevaient le repas du dîner gratuitement ou à un prix réduit. Cet article présente le processus de recherche ainsi que les résultats et leurs conséquences vis-à-vis des enseignants, surtout par rapport à d’autres recherches indiquant que les conseillers scolaires peuvent atténuer les effets de certains facteurs de risque.
Two recent movements in the United States, the Elementary and Secondary Education Act (ESEA), which outlines the No Child Left Behind legislation of 2001, and the Transforming School Counseling (TSC) initiative of 1996 focus on improving academic achievement for all students. Both these initiatives stress the importance of boosting achievement scores for low-income and minority students (Anderson & Hatfield, 2002; Education Trust, 2003). Gysbers (2003) states that school counselors contribute to national and state goals of improv-ing academic achievement by helpimprov-ing students reduce the effect of barriers to learning. These barriers include personal problems, inability to do homework, and lack of skills to succeed in school. School counselors can be particularly attuned to closing the achievement gap for minority students who are most vulnerable to the effects of these barriers (environmental and personal) that affect student performance (Anderson et al., 2001). One way counselors can contribute to closing this gap is by identifying the students who are at-risk in one or more ways and then determining whether a particular student risk factor has an effect on academic achievement. Then attempts can be made to intervene and hopefully mitigate the effects of a particular student risk factor. Below, several studies investigating the effects of risk factors on academic performance are considered.
Hixson and Tinzmann (1990) report that at-risk students are more likely to experience situations that interfere with their ability to focus on academic work. These factors can be seen as barriers to learning when they interfere with students’ academic success. The two factors Hixson and Tinzmann found to be most related to academic failure were truancy and dropping out. The direction of the effect is, however, unclear, and it is likely that academic failure and truancy form a mutually reinforcing positive feedback system that eventually results in students dropping out to pursue nonacademic activities in which they experience greater success.
Those students who drop out appear to form a sizable population of school drop-outs in the US. Natriello, McDill, and Pallas (1990) report that over 30% of youth currently registered in school programs will drop out before their graduation date. Natriello et al. further state that 35-40% of the current student population is labeled as disadvantaged in at least one of the following categories,
with a greater likelihood of dropping out: minority group, poverty, single-par-ent families, poorly educated mothers, and/or limited English proficiency.
Druian and Butler (1987) suggest that students who live in high-growth states with unstable school districts have low academic skills and low self-es-teem. These conditions are probably related to a student being at risk and that there are strong indicators by grade 3 that a student may be prone to dropping out of school. When students reach high school age, often interventions are too late. Druian and Butler found that the most influential determinants of drop-ping out were a disciplinary record, narrow outlook, and low grades.
Dimmitt (2003) identified multiple factors contributing to student failure including large class size, school environment, family issues, and cultural factors. Students are apt to be more academically successful when they are in manageable classrooms, feel physically and emotionally safe in school, devel-op friendships, and experience few family stressors. Family stressors included divorce, poverty and homelessness, illness, abuse, addiction, violence, and death of a family member. The family issues that Dimmit found helpful for students’ academic success included parent or guardian involvement with school, expectations of student success, family cohesion and structure, dis-cipline practices, parental education, and parenting skills.
Over the years, although having counseling programs in the schools has been shown to have a positive influence on the academic success of students (Lapan, Gysbers, & Petroski, 2001; Lapan, Gysbers, & Sun, 1997; Nelson & Gardner, 1998), direct evidence for counselors mitigating the effects of student risk factors is less readily available. One older study provides some evidence along these lines. Gerler, Kinney, and Anderson’s (1985) educational research indicated six factors that influenced student achievement: behaviors, affective factors, sensory factors, imagery factors, interpersonal factors, and physical factors. In their study, a North Carolina elementary school found that under-achieving “students who received counseling improved significantly on the Self-Rating Scale of Classroom Behavior and in their mathematics and lan-guage arts grades. Control students did not improve significantly on any of these measures” (p. 160).
Although little published research directly illustrates the relationship be-tween academic achievement and comprehensive school counseling programs, Sink and Stroph (2003) suggest:
school counseling programs [need to] (a) align their student targets with the goals of school reform, (b) use evidence-based best practices, and (c) report outcome-based data as a way of ensuring accountability of their work with students and their caregivers. (p. 350).
Sink and Stroph found that students who were enrolled in a school with a strong comprehensive guidance and counseling program scored better on various academic measures when compared with students in a school without a comprehensive school counseling program.
an ideal position to help students and parents by locating resources that may be of assistance. Prout and Prout also suggest that direct mental health and con-sultative services should be increased in the school setting.
In this study, school counselors working in a small urban district were able to identify risk factors that were experienced by the students they served. These risk factors could then be considered in relationship to the measures of student achievement used by this school district. These measures are the same or similar to those used in other school districts and programs nationally and internationally: student grades and tests developed by outside agencies for use in the district’s schools. This was considered a first step toward developing more effective counseling intervention programs. It was also hoped that by publicizing the research done here, we might encourage similar research by other educators in similar circumstances.
Method Hypothesis
The hypothesis of the current study was that a statistically significant correla-tion would exist between counseling risk factors (for a complete list of risk factors defined for the current study, see Appendix) and assessment measure-ments (state test scores, GPA, number of failures, and other related student success factors).
Participants
Data were obtained from the district research center where 30 students from every school in the district in grades 4, 6, 8, and 9 were randomly selected by computer. Schools were selected to provide information on potential differen-ces in the district; thus a differential in the number of students selected by levels existed because in this district there were 16 elementary schools, four middle schools, and three high schools (n=430 grade 4 students; n=64 grade 6 students; n=108 grade 8 students; and n=90 grade 9 students).
Demographics of the study included the following breakdown (also see Table 1): 49% female and 51% male; 4% American Indian; 10% Asian or Pacific Islander; 3% Hispanic; 8% Black; 77% Caucasian. The sample is representative of the small urban district of 16,360 students (K-12) consisting of 22% minority and 78% White students.
Measures
A mental health profile (listing counseling issues often presented by students) was developed by all the school counselors in the district to be used to
deter-Table 1 Demographics
Sex Male 51%
Female 49%
Race American Indian 4% Asian or Pacific Islander 10% Black 8%
mine the needs of students in daily practice. This was based on Roberts’ (1993) recommendation that school counselors design their own record-keeping methods to track mental health issues of students. A survey was designed using this mental health profile that offered counselors a consistent mode of collecting data for the current research. Studies have shown that students experiencing two or more life stressors (or counseling risk factors) are more likely to require psychiatric treatment than students dealing with fewer life stressors. The survey used in the current study included counseling risk factors found in the current district (see Appendix), test scores, grades, and related achievement factors.
Additional data included students’ math and reading scores on the Iowa Test of Basic Skills (ITBS), the Iowa Test of Educational Development (ITED), and the Minnesota Basic Skills Test (MNBST). The ITBS and ITED are used
Figure 1. Number of counseling risk factors.
Percentage of students having zero or more risk factors. More than 50% of the students in the study had one or more risk factors.
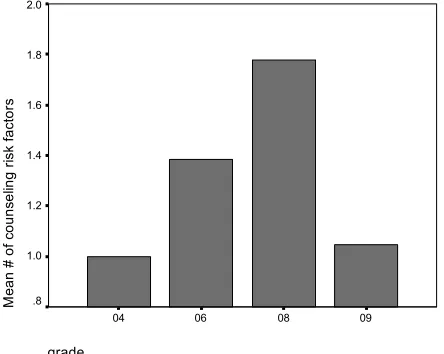
Figure 2. Mean number of risk factors by grade level.
Mean number of counseling risk factors per student in the sample at each grade level.
15 11 10 9 8 7 6 5 4 3 2 1 0
P
er
cent
50
40
30
20
10
0
grade
09 08
06 04
M
e
an #
of
c
ouns
el
ing ri
sk
f
ac
tor
s
2.0
1.8
1.6
1.4
1.2
1.0
nationally in the US as measures of academic progress, but the MNBST may be less familiar to educators outside the state of Minnesota (Minnesota Depart-ment of Children, Families and Learning and NCS Pearson, 2002).
The MNBST is a test mandated by the state legislature on which students in Minnesota are required to obtain a passing score in order to graduate from high school (Minnesota Department of Children, Families and Learning and NCS Pearson, 2002). The test includes both reading and math components taken on
Figure 3. Mean number of risk factors for free (F), reduced (R), or full price ( ). Mean number of counseling risk factors per student combined for all grade levels given according to whether students receive free lunches (F), reduced-cost lunches (R), or pay full price ( ). Lunch status itself is determined by income eligibility rules. Note that being eligible for a free or reduced lunch would itself count as a risk factor.
Figure 4. Mean number of risk factors for ethnicity.
Mean number of counseling risk factors per student by ethnicity for all grade levels. The category 00 represents ethnic groups other than those represented by the remaining categories. and G. Maycock
social econ status
R F
M
e
a
n
#
o
f
co
u
n
se
lin
g
r
isk
fa
cto
rs
2.5
2.0
1.5
1.0
.5
ethnic code
White Black Hispanic Asian or Pacific Isl American Indian or A 00
M
ean
# of c
ou
ns
el
in
g r
is
k
fac
tors
3.0
2.5
2.0
1.5
1.0
separate days during a single week. Students take the test for the first time in grade 8 and have 11 opportunities to obtain a passing score between then and the end of their grade 12 year. Only scores for grade 8 students were considered for this study, as that is the only grade in which all enrolled students must take the test. If they pass in grade 8, students do not need to retake the test in later grades. Scores are given as a percentage of questions answered correctly, with 75% correct being required to obtain a passing score, which is also a scale score of 600.
Procedure
Twenty-five counselors volunteered to collect information from student files randomly selected by district research staff. They also used information in their personal files or otherwise known by school staff. The counselors then trans-ferred the data without information that could be used to identify particular students to one graduate assistant who entered it into statistical files.
Results
More than 50% of the current sample had at least one counseling risk factor (among the highest factors reported are: academic, behavior, family, and medi-cal problems, see Figure 1). Students who were likely to have more than one risk factor were also likely to be male, Hispanic, or Black and to have one or more of the following traits: special education status, high rates of absent or tardy days, several suspensions or discipline reports, single, deceased, or step-parent, and/or have free or reduced lunch status (Figure 2).
Several statistically significant intercorrelations arose among measured variables. The more counseling risk factors students had, the lower were their ITBS reading and math scores (r=–.23, –.20); the lower their BST reading and math scores (r=–.43, –.36), as well as the lower their GPA (r=–.60). Also, coun-seling risk factors were positively correlated with a greater number of suspen-sions (r=.39), discipline reports (r=.45), number of failures (r=.47), number of
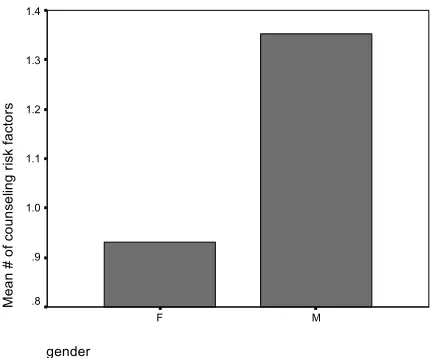
Figure 5. Mean number of risk factors for gender.
Mean number of counseling risk factors per student for all grade levels broken down by gender.
gender
M F
M
e
a
n
#
o
f co
u
n
se
lin
g
r
isk f
a
ct
o
rs
1.4
1.3
1.2
1.1
1.0
.9
days absent (r=.12), and tardy (r=.22). All these correlations were statistically significant at less than the .01 level of significance.
The MANOVA univariate tests showed some statistically significant dif-ferences (Table 2). Students with lower scores on the ITBS tended to have the following risk factors present: single parents, family problems, abuse, social problems, anger management problems, and medical problems. The ITBS
Table 2
Statistically Significant Differences Between Students With and Without Risk Factors Present
M SD t p
Single parent
ITBS reading yes 199.19 31.88 –3.59 0
no 216.27 39.49
ITBS math yes 202.31 36.3 –3.38 0.001
no 221.71 45.19
Family problems
ITBS reading yes 198.12 32.61 –4.93 0
no 218.16 39.29
ITBS math yes 201 36.02 –4.64 0
no 222.55 45.23
Abuse
ITBS reading yes 190.46 32.91 –2.17 0.031
no 231.97 38.7
ITBS math yes 195.85 42.2 –1.79 .075 NS
no 217.96 44.07
Social problems
ITBS reading yes 198.47 30.1 –2.15 0.032
no 214.19 39.2
ITBS math yes 199.7 32.19 –2.25 0.025
no 219.51 44.86
Anger management
ITBS reading yes 592.5 42.24 –2.08 0.042
no 649.64 53.86
ITBS math yes 475.75 23.4 –1.97 0.05
no 634.03 58.64
Medical problems
ITBS reading yes 204.67 32.16 –2.68 0.008
no 216.97 41.49
ITBS math yes 206.78 35.54 –2.8 0.005
no 221.56 47.95
Conflict problems
BST reading yes 592.9 42.24 –2.08 0.042
no 649.64 53.86
BST math yes 575.75 23.4 –1.97 0.05
no 634.03 58.63
Academic problems
BST reading yes 614.13 52.12 –4 0
no 680.29 35.51
BST math yes 599.44 45.8 –4.1 0
reading and math scores for students with these problems ranged from 190 to 202, whereas scores ranged from 214 to 222 for those who did not report these problems. Students experiencing conflict and/or having academic problems scored significantly lower on the BST tests. Their BST scale scores ranged from 576 to 614, whereas those who did not report these problems had scores from 634 to 680.
No significant differences were found between socioeconomic status groups on the tests. All these statistically significant differences were at the .01 or less level of significance except for abuse and anger problems, which were at the .05 or less level of significance.
Discussion
This study found that the number of counseling risk factors a student reports is correlated with achievement level. In this case, achievement level is based on grade point average and state test scores. A significant number of students in the current study (more than half) experienced at least one counseling risk factor (or barrier to learning). The more counseling risk factors a student had, the lower the ITBS reading and math scores, the lower the BST reading and math scores, and a lower GPA, than those of students who had fewer counsel-ing risk factors.
Others have found the same phenomena relating student stressors (linked with at-risk status) with achievement (Butler, 1987; Dimmit, 2003; Druian & Butler, 1987; Hixson & Tinzmann, 1990). Gysbers (2003) defines these barriers to learning to include personal problems, inability to do homework, and lack of skills to succeed in school.
Our study suggests that when counselors can link risk factors, or barriers to learning, to academic achievement, they can help students learn how to deal effectively with those risk factors so that these factors have less effect on their grades and test scores. Prout and Prout (1998) found that a student’s ability to function academically is related to mental health status. Kaufman, Bradby, and Teitelbaum (2002) report that when students have talked to counselors and staff about academic plans they do better in school; and Lapan et al. (2001) discovered that as guidance programs were more fully implemented in Mis-souri, grade 7 students earned higher grades, found school more relevant, had more positive relationships with their teachers, were more satisfied with their education, and felt safer in school.
Brown (1999) suggests that school counselors will be expected to play a significant role in the current school reform movements. Counselors often become a student’s anchor person who can offer stable contact and confiden-tial, supportive conversations. Among the services that counselors implement, Brown suggests that successful interventions are behavioral contracts, educa-tional and personal goal-setting, study skills groups, achievement motivation groups, and parent consultations.
Implications for Intervention
higher education. However, it is vital that school counselors begin to find ways to quantify their role and demonstrate the connection between specific coun-seling interventions and students’ achievement in ways that administrators and community members can appreciate.
Simple methods of frequency counts through the use of mental health profiles and school counselors’ activities logs can show the number of counsel-ing risk factors in any given school. More involved analysis is necessary for school counselors to identify the important link between counseling interven-tions and academic achievement. However, gathering information on students similar to that used in the present study can assist school staff in targeting interventions at students who may need them most. Indeed, this was one of the most direct applications of this kind of student data by school counselors in this district, as they sought to ensure that all students at risk of failure were targeted for one or more interventions, including assessment for special educa-tion services, tutoring, and individual or group counseling.
Limitations of the Study
The small urban setting of the current study with a large number of recent immigrants and mixed SES levels limit generalization to larger urban or rural settings. Also, the location of the study in one particular city with a possibly idiosyncratic population may limit generalization to other states and countries. In addition, the research design here was correlational, so the direction of influence of the various variables under consideration is unclear. Although it was shown that students experiencing one or more risk factors tended to show lower test scores and academic achievement than their peers, it may be that lack of success in school increases the likelihood of some risk factors such as conflict with peers and absenteeism. It is always difficult to make definitive conclusions with this kind of research, but some tentative general conclusions are discussed below in order to provide directions for future research.
Conclusions
Today’s society increasingly demands emphasis on academic measurement through legislation such as ESEA and through initiatives like TSC. School counselors can no longer work in their programs simply knowing that what they do works. They must become more resourceful in quantifying the effec-tiveness of their programs on academic achievement and publish their find-ings.
When school officials and parents look at factors that contribute to academic failure, method of instruction and related factors are the focus of investigation, and often what is going on in a student’s personal life is over-looked. A broader and more effective view may take into account the effect of nonacademic life factors that school counselors deal with on an everyday basis and how these factors affect academic success.
Several studies have attempted to measure relationships between academic achievement and specific risk factors such as low IQ, behavior, learning dis-abilities, mental health (anxiety and depression), self-esteem, and motivation. This study showed a clear relationship between counseling risk factors and student achievement. In particular, student risk factors were shown to have an
effect on both students’ achievement on their coursework and on both low- and high-stakes tests used to measure students’ (and school) progress. Schools, school districts, and states wishing to improve their test scores and graduation rates may find it useful to invest in programs meant to reduce or mitigate student risk factors. Such programs may include school counseling, social work, truancy prevention, and community health staffing in the schools. Al-though this study cannot by itself show that any of these programs would be effective, it does show that the problems they are meant to address are related to lower levels of student achievement.
As schools across the nation focus increasingly on quantitative measures, especially standardized test scores, school counselors and other educational professionals have a duty to demonstrate the link between the difficulties many students experience in their lives and lower academic achievement. Counselors in particular may be the only people in many schools to be in a position both to remind their communities and school leadership that this link exists and to develop interventions to assist students in overcoming the obstacles they face to succeed in school.
Acknowledgments
The authors thank J. Paul Gustafson, Coordinator of Research and Assessment, Rochester School District; and Nicole Springer, graduate assistant, Counselor Education Department, Winona State University, for their assistance.
References
Anderson, B., Garnett, J., Saner, R.A., Saner, D., Steinbauer, M., Hatfield, T., & Ruiz, N. (2001, April). Transforming school counseling. Paper presented at the Minnesota School Counseling Association annual conference, Brainerd.
Anderson, B., & Hatfield, T. (2002, May). Transforming school counseling: Lessons learned in Rochester’s initial transformational steps. Paper presented at the Minnesota School Counseling Association annual conference, Brainerd.
Brown, D (1999). Improving academic achievement: What school counselors can do. EDO-CG-995. Retrieved March 6, 2003, from: http://ericcass.uncg.edu/digest/brown.html
Dimmit, C. (2003). Transforming school counseling practice through collaboration and the use of data: A study of academic failure in high school. ASCA, Professional School Counselor, 6(5), 340-349.
Druian, G., & Butler, J. (1987). Topical synthesis #1. Effective schooling practices and at-risk youth: What the research shows. SIRS, NW Regional Educational Laboratory. Available:
http://www.nwrel.org/scpd/sirs/1/topsynl.html
Education Trust. (2003). ESEA: Myths versus realities. [Brochure]. Washington, DC: Author. Gerler, E.R., Kinney, J., & Anderson, R.F. (1985). The effects of counseling on classroom
performance. Humanistic Education and Development, June, 155-165.
Gysbers, N.C. (2003). Role of counselors in improving academic achievement. Paper presented at the Professional Development Speaker Series virtual conference. Retrieved December 11, 2003, from: http://www.nccte.org//webcasts/description.asp?wc=15
Hixson, J., & Tinzmann, M.B. (1990). Who are the at-risk students of the 1990’s? North Central Regional Educational Laboratory, Oak Brook. Available:
http://www.ncrel.org/sdrs/areas/rpl_esys/equity.htm.
Kaufman, P.L, Bradby, D.L, & Teitelbaum, P. (2002). High schools that work and whole school reform: Raising academic achievement of vocational completers through the reform of school practice. Berkely, CA: National Center for Research in Vocational Education.
Lapan, R.T., Gysbers, N.C., & Petroski, G.F. (2001). Helping seventh graders be safe and successful: A statewide study of the impact of comprehensive guidance and counseling programs. Journal of Counseling and Development, 79, 320-330.
Lapan, R.T., Gysbers, N.C., & Sun, Y. (1997). The impact of more fully implemented guidance programs on the school experiences of high school students: A statewide evaluation study.
Minnesota Department of Children, Families and Learning and NCS Pearson. (2002). Minnesota basic skills test technical manual: For the school year 2001-2002. St. Paul, MN: Author.
Natriello, G., McDill, E.L., & Pallas, A.M. (1990). Schooling disadvantaged children: Racing against catastrophe. New York: Teachers College Press.
Nelson, D.E., & Gardner, J.L. (1998). An evaluation of the comprehensive guidance program in the Utah public schools. Salt Lake City, UT: Utah State Office of Education.
Prout, S.M., & Prout, H.T. (1998). A meta-analysis of school-based studies of psychotherapy.
Journal of School Psychology, 24, 285-292.
Roberts, Jr., W.B. (1993). Creating a mental health profile of your school. School Counselor, 41, 134-136.
Sink, C.A., & Stroph, H.R. (2003). Raising achievement test scores of early elementary school students through comprehensive school counseling programs. Professional School Counseling, 6(5), 350-364.
Whiston, S.C., & Sexton, T.L. (1998) A review of school counseling outcome research: Implications for practice. Journal of Counseling and Development, 76, 412-427.
Appendix
The following list of counseling risk factors was created and used in the current study.
socioeconomic status (defined by free/reduced-lunch status reports) special education status
number of failures in last semester of school year grade point average
days absent/tardy parents’ marital status deceased parents guardian/foster care number of siblings
number of moves in last academic year (within district and from outside district) number of accelerated classes
number of suspensions medical issues with student discipline report
family counseling issues
number of counseling issues presented to counselor (academic, behavior, social, family, abuse, chemical, conflict, death, harassment, high-risk student, stress, mental health, career/vocational, pregnancy, sexual, suicidal, anger management, school avoidance, tests for EBD, medical issues, special education status, ESOL)