R E S E A R C H
Open Access
Use of rasch methodology to develop a short
version of the Health Related Quality of life for
Eating Disorders questionnaire: a prospective
study
Carlota Las Hayas
1*, Jose M Quintana
1, Jesús A Padierna
2, Amaia Bilbao
3, Pedro Muñoz
4Abstract
Background:To confirm the internal structure of the Health Related Quality of Life for Eating Disorders version 2 questionnaire (HeRQoLEDv2) and create and validate a shortened version (HeRQoLED-S).
Methods:324 patients with eating disorders were assessed at baseline and one year later (75.6% of whom responded). We performed a confirmatory factor analysis of the HeRQoLEDv2 using baseline data, and then a Rasch analysis to shorten the questionnaire. Data obtained at year one was used to confirm the structure of the HeRQoLED short form and evaluate its validity and reliability.
Results:Two latent second-order factors–social maladjustment and mental health and functionality–fit the data for the HeRQoLEDv2. Rasch analysis was computed separately for the two latent second-order factors and
shortened the HeRQoLEDv2 to 20 items. Infit and outfit indices were acceptable, with the confirmatory factor analysis of the HeRQoLED short form giving a root mean square error of approximation of 0.07, a non-normed fit index and a comparative fit index exceeding 0.90. The validity was also supported by the correlation with the convergent measures: the social maladjustment factor correlated 0.82 with the dieting concern factor of the Eating Attitudes Test-26 and the mental health and functionality factor correlated -0.69 with the mental summary
component of the Short Form-12. Cronbach alphas exceeded 0.89.
Conclusions:Two main factors, social maladjustment and mental health and functionality, explain the majority of HeRQoLEDv2 scores. The shortened version maintains good psychometric properties, though it must be validated in independent samples.
Background
Eating disorders (ED) affect millions of people world-wide. Since the earliest publications focusing on quality of life among individuals with an ED [1-8] it has been shown that they have a high degree of impairment in various areas of health-related quality of life (HRQoL). Most of these early studies used generic tools to assess the impact of an ED on physical, mental, and social fac-tors [9]. However, these generic tools did not include specific questions probing how the ED affected these
factors which, in most cases, limited the interpretation of the results [10].
The first HRQoL instruments specific to individuals with an ED were published almost simultaneously in 2006 and 2007 [10-14]. We developed one of these, the Health Related Quality of Life for Eating Disorders ver-sion 2 (HeRQoLEDv2) questionnaire [13,14], a tool with good validity and reliability. One limitation of this 55-question instrument is that it requires a considerable amount of time to complete. We subsequently decided to develop a shorter version. Some techniques for shrinking the size of questionnaires arise from item response theory (IRT) [15-17], with Rasch analysis being a useful approach. The rationale that makes Rasch
* Correspondence: [email protected]
1CIBER Epidemiology and Public Health, Research Unit 9th floor, Hospital Galdakao - Usansolo, B° Labeaga s/n, Bizkaia 48960, Spain
models useful as a method to shorten the size of a ques-tionnaire is that they can be employed to assess the uni-dimensionality of questionnaires, and remove items that disrupt this unidimensionality, identify degrees of trait severity and remove those items that overlap in severity level [18]. In addition, it does not require large samples sizes for adequate parameter estimation [19].
The objectives of the current study were to confirm a hypothesized internal structure of the HeRQoLEDv2, create a shortened version of this questionnaire (HeR-QoLED-Short form), and then confirm the structure of the shortened version and examine its validity and relia-bility. We hypothesized that the first-order factors of the HeRQoLEDv2 could represent two second-order latent traits: “social maladjustment” and “mental health and functionality.”We tested this hypothesis in the present study.
Methods
Participants
Our detailed selection criteria have been described else-where [13,14]. Briefly, the population consisted of ED patients being treated by four collaborating psychiatrists, experts in ED, working in three different mental health services in the province of Bizkaia, Spain. Diagnosis of an ED was performed by psychiatrists attending the patient if the patient met the diagnostic criteria for an ED established by the Diagnostic and Statistical Manual of Mental Disorders-IV [20].
Patients were excluded from the study if they had any serious multiorganic or psychotic disorder that could prevent adequate completion of the materials. To be included in the study, a patient had to participate in the investigation in an informed and voluntary way. The tenets of the Declaration of Helsinki were followed, and the study gained approval from the hospital’s ethics committee.
Three questionnaires–the HeRQoLEDv2, the 12-item
Short Form Health Survey (SF-12), and the Spanish
ver-sion of the Eating Attitudes Test-26 (EAT-26)– were
mailed to each patient’s home address soon after
recruitment, which we define as time 1 (T1). Those who did not respond in a timely fashion were sent reminders after 15 days and 30 days. The same questionnaires were mailed to patients one year later, which we define as time 2 (T2). As before, those who did not respond in a timely fashion were sent reminders after 15 days and 30 days.
Data from the T1 sample were used to perform con-firmatory factor analysis (CFA) of the HeRQoLEDv2 fol-lowed by Rasch analysis. The T2 data were used to perform the CFA, validity, and reliability analyses of the shortened version.
Materials
Sociodemographic data were collected from each partici-pant. In addition, each participant completed three self-administered instruments related to HRQoL and ED:
The HeRQoLEDv2 [13,14] is comprised of 55 items and covering nine domains: symptoms, restrictive beha-viors, body image, mental health, emotional role, physi-cal role, personality traits, social relations, and binges. The scores in each domain are converted into a range from 0 to 100, with higher scores indicating a worse perception of HRQoL.
The SF-12 [21,22] is a short generic survey of health status that can be summarized in two subscales: the physical component summary and the mental compo-nent summary. Values range from 0 to 100, with higher values indicating better health perception.
The Spanish version of the EAT-26 [23] was used as a measure of general eating disorder pathology. This test is composed of three factors–dieting concern, bulimia and food preoccupation, and oral control–and a total score. Its overall values range from 0 to 78, with higher scores indicating greater ED symptomatology.
Statistical analysis
Confirmatory factor analysis of the HeRQoLEDv2
study showed that families of individuals with ED per-ceived serious difficulties in their interpersonal relation-ship with the affected one [25].
We also hypothesized that the mental health and functionality of individuals with an ED would affect their scores in the first-order domains of“physical role”,
“emotional role”, “mental health”, and “personality traits”. The mental health and functionality of ED indivi-duals tend to be represented by a combination of high perfectionist traits, low self-efficacy feelings, stress due to feeling overweight and depressive symptoms [26-28]. All of these traits and feelings are part of the content of the selected first order domains.
We further hypothesized that “social maladjustment” and“mental health and functionality” factors would be correlated given that an individual’s mental state is likely to affect his or her social adjustment and vice versa.
Several different fit indices are applicable to these ana-lyses [29,30]. We used the chi-square test divided by degrees of freedom, the results of which had to be less than 2.0 to be acceptable [29]; the root mean square error of approximation, where values of 0.08 or less are acceptable [30]; and the non-normed fit index and com-parative fit index, both of which had to be equal to or greater than 0.90 to be satisfactory [29].
Only items that showed factor loadings ≥0.40 in the
corresponding factor were accepted [29]. The Lagrange multiplier test, which identifies paths or covariances that should possibly be added to the model to improve the fit, was used when the model needed modification.
CFAs were performed with the CALIS procedure of the SAS program (version 8.0) [31].
Rasch analysis
The Rasch method was applied to the original version of the HeRQoLED as a means to develop the Health Related Quality of life for Eating Disorders - Short Form (HeRQoLED-S). The Rasch model presumes that a sin-gle trait drives item responses [32], so that a person’s response to an item that measures a single trait is accounted for by his/her level (amount) on that trait, and not by other factors [33]. The Rasch model assumes that the probability of a given patient responding affir-matively an item is a logistic function of the relative dis-tance between the item location parameter (the difficulty of the item) and the respondent (the ability of the patient), and only a function of that difference [34]. Items along the logit scale are ordered according to its difficulty level; the most difficult ones are at the top and the easiest ones, at the bottom [35]. In our study, items which reflect the highest impact on HRQoL are placed at the top of the continuum and those which reflect the lowest impact are placed at the bottom. We used the polytomous Rasch rating scale model because our response scales are ordinal with six response options.
A joint maximum-likelihood estimation process was used to estimate the parameters [36].
Prior to all further analyses, the functioning of rating scale categories was examined for each of the two domains of the HeRQoLED short form. The rating scale categorizations presented to respondents are intended to elicit from those respondents unambiguous, ordinal indi-cations of the loindi-cations of those respondents along the latent trait of interest [37]. Therefore the probability of selecting an item response category indicative of better health status should increase as the underlying level of health of the respondent increases [33]. Linacre [37] sug-gests the following criteria to assess adequate functioning of rating scale categories: (1) More than 10 observations per category (or the findings may be unstable, i.e., non-replicable); (2) A smooth distribution of category fre-quencies. The frequency distribution is not jagged; (3) Clearly advancing average measures; (4) Average mea-sures near their expected values; (5) Observational fit of the observations with their categories: Outfit mean-squares near 1.0. Values much above 1.0 are much more problematic than values much below 1.0.
Because the condition of unidimensionality is a requirement for using Rasch analysis, we applied the Rasch analysis separately to both social maladjustment and mental health and functionality factors. Unidimen-sionality was assessed through a principal components analysis (PCA) of the residuals extracted from the Rasch model [18]. A violation of unidimensionality was consid-ered if in addition to the first factor there were other fac-tors with eigenvalues greater than 3 [37]. Apart of the PCA, unidimensionality was assessed through examina-tion of fit statistics. We used two indices of fit, namely the mean square information-weighted statistic (infit) and the outlier-sensitive statistic (outfit). Values between 0.7 and 1.3 for both indices indicate a good fit [38].
We evaluated how well the HeRQoLED - short ver-sion differentiates individuals in the measured domains on the basis of the person separation statistic [39] and how well it differentiates items based on the item separation index, which indicates the ability to define a distinct hierarchy of items along the measured variable. A value ≥2.0 for this statistic is comparable to a relia-bility of 0.80 and is acceptable. Correlation of items with the total scale score served to evaluate whether the items correlated in a similar way with the construct being measured [40].
otherwise specified) may exert influence on item calibra-tions in subsamples. DIF analyses were performed inde-pendently for the“Social maladjustment scale”and for
the “Mental health and functionality scale”. Welch
t gives the DIF significance as a Welch’s (Student’s) t-statistic. The t-test is a two-sided test for the differ-ence between two means (i.e., the estimates) based on the standard error of the means (i.e., the standard error of the estimates). The null hypothesis is that the two estimates are the same except for measurement error. To establish a noticeable DIF between subsamples, the difference in difficulty of the item between the two groups (DIF contrast) should be at least 0.5 logits. In addition, the Welchtshould be statistically significant, P < .05 [37].
Residual correlations between items within a scale were examined for local dependency. Correlations > 0.5 between item residuals can indicate that responses to one item may be determined by those to another [41].
Rasch analyses were repeated until we obtained a ver-sion that met the criteria, which was named the Health Related Quality of Life for Eating Disorders-Short Form (HeRQoLED-S). Item content was examined for the misfitting items before removal from the scale. Two of the authors of the present study (JAP and CLH) are experts in the field of eating disorders. They jointly decided whether to retain or delete an item based on the clinical importance of the content. Winsteps version 3.37 was used for the Rasch analysis [42].
Confirmatory factor analysis of the HeRQoLED-S
A CFA was applied to the shortened version. The hypothesized structural and measurement models were the same as those of the long version. The only differ-ence was that fewer items were assigned to each first-order factor. The same fit indices were also used to assess the goodness of fit.
Validity and reliability of the HeRQoLED-S
Based on content similarity between subscales of differ-ent questionnaires, we hypothesised the following corre-lations for the analysis of concurrent validity: The social maladjustment factor would correlate positively and moderately, by means of the Pearson correlation coeffi-cient, with the dieting concern factor of the EAT-26. The mental health and functionality factor, in turn, was hypothesized to correlate negatively and moderately with the mental component summary of the SF-12. The Cronbach alpha index of reliability was calculated for each factor; values above 0.70 were acceptable [43].
Results
Participants
A total of 394 ED patients were approached for the study. Of them, 324 ED patients completed the first set of questionnaires (T1). All patients were receiving
treatment for their ED at T1 but they differed in ED subtype, severity and time in treatment. We did not fil-ter patients in these regards; therefore we expect that these patients represent the entire spectrum of ED severity. All were asked to complete the same tests again after one year. Of these, 245 patients (75.6%) responded. Most participants were women (96.3% at T1 and 95.1% at T2), with a mean age of 27 years, SD (8.76) at T1. From the baseline sample, 21% patients had been diagnosed with anorexia nervosa, 15% with bulimia nervosa, and 64% with eating disorders not otherwise specified.
Confirmatory Factor Analysis of the HeRQoLEDv2
For the CFA, only data from the 262 participants who completed the HeRQoLEDv2 at T1 with no answers missing were used. The hypothesized model described in the Introduction provided satisfactory fit indices after few adjustments. Following the Lagrange multiplier test, two pairs of errors, one belonging to the body image domain and the other to the social relations domain, were allowed to covary. Additionally, the Lagrange multiplier test suggested setting a new causal relationship between the personality traits item“Have you had lack of confi-dence in your own capabilities?”and the mental health domain item“Have you felt yourself worthless?”. This new relation is meaningful given that lack of confidence in one’s capabilities may lead an individual with an ED to feelings of worthlessness when facing problems. After these adjustments, the goodness of fit indices for the
model were satisfactory (c2 (df = 729) = 1464.67,
P< .0001;c2/df= 2.01; RMSEA = 0.06; NNFI = 0.90 and CFI = 0.90).
Figure 1 shows the path diagram of the model with the estimated parameter values included.
Rasch analysis to obtain the shortened version
Data from all 324 ED patients who responded at T1 were used for the Rasch Rating Scale analysis.
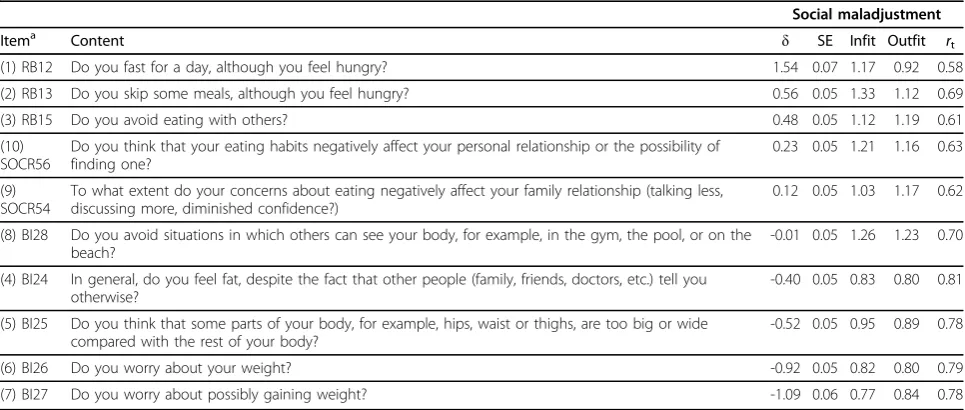
Originally, the social maladjustment domain was com-posed of 19 items. Nine of them were removed because they showed inadequate fit indices (infit or outfit) or because they overlapped the same level of difficulty as other items. Experts in ED evaluated the importance of the item content before removing the item. The shor-tened social maladjustment domain consisted of 10 items separated by 0.10 or more logit values. Table 1 shows the characteristics of the measurement level, stan-dard error, infit, outfit, and item total correlations. The level of difficulty is represented by the trait level (δ), where high values indicate greater difficulty with social adjustment.
“Almost always”in the item RB12 “Do you fast for a day although you feel hungry”. We combined adjacent cate-gories “almost always”with respondents of “Always”to obtain a robust structure of high frequency categories. This combination reproduced satisfactory results with an outfit index of 1.3. Items RB15“Do you avoid eating with others?”and BI27“Do you worry about the possi-bility of gaining weight?” showed large outfits in one of
their response categories. Response category“Always”of item RB15 presented an outfit index of 2.1. After com-bining respondents of adjacent categories “always” and
“almost always”, the outfit index reduced to 1.5. For the item BI27 the category response “never” presented an outfit index of 2.6. After combining this response cate-gory with the adjacent catecate-gory of “almost never” the outfit value reduced to 1.4. The fourth problematic item
Figure 1Path diagram of the resulting structure of the HeRQoLEDv2. In order to keep the path diagram from becoming overly complex, the lowest and highest factor loadings for each domain are described here: Restrictive behaviors = .49 - .71, Body Image = .70 - .87, Social relations = .57 - .89, Mental Health = .54 - .85, Emotional role = .81 - .94, Physical role = .84 - .95 and Personality Traits = .64 - .84. * Indicates covariances among exogenous variables.
Table 1 Rasch model: Item measure, SE, fit statistics and item-total correlations of the social maladjustment domain
Social maladjustment
Itema Content δ SE Infit Outfit rt
(1) RB12 Do you fast for a day, although you feel hungry? 1.54 0.07 1.17 0.92 0.58
(2) RB13 Do you skip some meals, although you feel hungry? 0.56 0.05 1.33 1.12 0.69
(3) RB15 Do you avoid eating with others? 0.48 0.05 1.12 1.19 0.61
(10) SOCR56
Do you think that your eating habits negatively affect your personal relationship or the possibility of finding one?
0.23 0.05 1.21 1.16 0.63
(9) SOCR54
To what extent do your concerns about eating negatively affect your family relationship (talking less, discussing more, diminished confidence?)
0.12 0.05 1.03 1.17 0.62
(8) BI28 Do you avoid situations in which others can see your body, for example, in the gym, the pool, or on the beach?
-0.01 0.05 1.26 1.23 0.70
(4) BI24 In general, do you feel fat, despite the fact that other people (family, friends, doctors, etc.) tell you otherwise?
-0.40 0.05 0.83 0.80 0.81
(5) BI25 Do you think that some parts of your body, for example, hips, waist or thighs, are too big or wide compared with the rest of your body?
-0.52 0.05 0.95 0.89 0.78
(6) BI26 Do you worry about your weight? -0.92 0.05 0.82 0.80 0.79
(7) BI27 Do you worry about possibly gaining weight? -1.09 0.06 0.77 0.84 0.78
Every question has a response scale of 6 ordinal options, being 0 = Never and 5 = Always.
δ= Level of severity of the social maladjustment factor. Higher values indicate higher severity; SE = standard error;rt= correlation between item and total
measured social maladjustment level based on the Rasch calibrated item scores and total scores.
a
The numbers in parentheses reflect the current item location in the shortened version.
is SOCR54 “Do you think that your eating habits nega-tively affect your family relationship?”which presented a large outfit (OUTF MNSQ = 1.9) for response category
3 “several times” but not for the remaining of the
response categories. Combining adjacent categories was not a good approach since the resulting merged response category would count with an excessive num-ber of respondents. We decided to leave the item as it was.
Unidimensionality was supported since the PCA of the residuals did not give additional factors with eigenvalues exceeding 3.00. Furthermore, the fit indices ranged from 0.77 to 1.30. All the item total correlations were high and homogeneous (see Table 1). Differential item
func-tioning was observed only in one item, BI27 “Do you
worry about the possibility of gaining weight?” with a difference slightly higher than 0.5 (DIF contrast = 0.66; p < 0.05) between the anorexia and the bulimia sub-groups. For patients with anorexia nervosa, this item was slightly more difficult than for patients with bulimia. Intercorrelations between residuals were all below 0.50 (range -.30 to .47).
The final shortened scale of social maladjustment included 10 items. The item locations for the HeR-QoLED-S are shown in Figure 2 (left-hand side). The person separation index (2.46) and the item separation index (12.48) exceeded the required value of 2.0, thereby indicating a reliability above 0.80. The total score was transformed to range from 0 to 100 (mean score: 48.8; SD: 23.2).
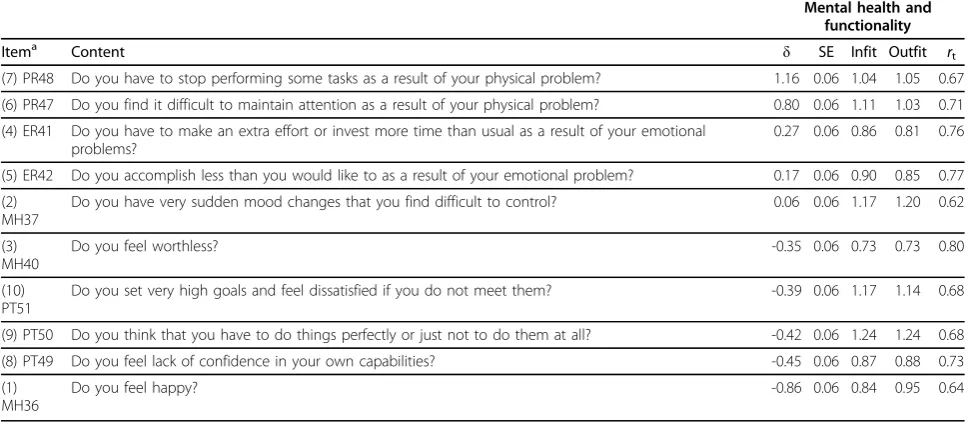
The mental health and functionality scale originally included 21 items. After performing iterative Rasch ana-lyses and item content analysis, 11 of them were removed because they overlapped or misfit and were not clinically essential. Seven of the 10 remaining items in the scale were separated by 0.10 logit units and 3 of which were separated by 0.04 logit units (Table 2; Figure 2, right). The 3 overlapping items (Figure 2, right-hand side) were retained because they were con-sidered clinically meaningful based on expert opinion and had adequate fit indices.
Unidimensionality was supported since the PCA of the residuals did not lead to additional factors with eigen-values exceeding 3.00. Furthermore, the fit indices ran-ged from 0.72 to 1.27. The item total correlations were all high and homogeneous, ranging from 0.61 to 0.78.
Only two items of the mental health and functionality domain did not comply with the requirements for ade-quate functioning of rating scale categories. Specifically, the category response “Always” of item PR48“Do you have to stop performing some tasks as a result of your
physical problem?” presented an outfit index of 2.2.
Therefore, we decided to combine this response option with the adjacent category“Almost always”. After this
combination, the outfit reduced to 1.4. The category
response “Never” from the item MH36“Do you feel
happy?” was only reported by 1 participant. Thus, we
decided to combine it with the adjacent category response “Almost never” to enlarge the sample. After this combination, the outfit index was -1.58.
Figure 2 (right side) shows the item and person loca-tions along the logit scale. Positive values indicate high levels of mental health disease and dysfunction, whereas negative values indicate low levels of mental health dis-ease and dysfunction.
The person separation index (2.5) and the item separation index (9.7) for this sample also exceeded the required value of 2.00, indicating a reliability of the scale above 0.80. The raw score in this domain was also transformed to range from 0 to 100 (mean = 48; SD = 20.3). Statistically significant DIF contrasts were not observed for any item of the scale.
Intercorrelations between residuals were below 0.50 (range -.29 to .41), except for two items ("Do you have to stop performing some tasks as a result of your physi-cal problem?”and “Do you find it difficult to maintain the attention as a result of your physical problem?”) which slightly surpassed this threshold (r = 0.51).
In summary, after applying the Rasch rating scale ana-lysis to the original 40 items (after excluding items from binges and symptoms domains) of the HeRQoLEDv2 we obtained a shortened version of 20 questions divided in 2 factors,‘social maladjustment’and‘mental health and functionality’. This HeRQoLED short version provides separate scores for each factor. Calculating the score in both long and short versions requires summing the response options selected in the factor’s items, standar-dizing the score to range from 0 to 100. In case of miss-ing values we applied the mean imputation method. Confirmatory Factor Analysis of the HeRQoLED-S
Data from the 207 patients who returned questionnaires at T2 without missing answers were used for the CFA of the HeRQoLED-S. The hypothesized model was simi-lar to that of the long version but included only the 20 items accepted after the Rasch analysis. The Lagrange multiplier test was again used. The first pair of errors intercorrelated belonged to two items from the body image domain, and the second to the personality traits domain.
The factorial structure that resulted after allowing for these covariances between errors proved satisfactory since it resulted in acceptable fit indices (x2 (df= 160) = 305.96, P < .0001; x2/df ratio = 1.9; RMSEA = 0.07; NNFI = 0.93 and CFI = 0.94) and significant factor load-ings (Figure 3).
Concurrent validity and reliability of the HeRQoLED-S A data set for the HeRQoLED-S was created using the
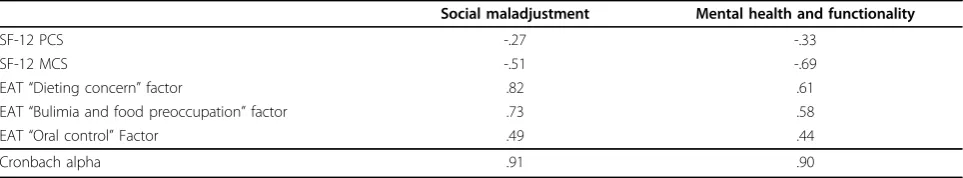
questionnaires at T2. As hypothesized (Table 3) the social maladjustment factor correlated more strongly with the dieting concern factor of the EAT-26 (r = 0.82, p < 0.001) than with the remaining factors. The mental health and functionality factor of the HeRQoLED-S also correlated higher with the mental summary component of the SF-12 (r = -0.69, p < 0.0001) than with the other factors. The Cronbach alpha was 0.91 for the social mal-adjustment domain and 0.90 for the mental health and functionality domain.
Discussion
This study confirmed the internal structure of a newly developed questionnaire for eating disorders, the 55-question HeRQoLEDv2. We also applied CFA and Rasch analysis to develop a shorter 20-question version, which maintained satisfactory psychometric qualities, and we validated the internal structure of the shortened questionnaire.
Of the three other disease-specific instruments created to date for measuring HRQoL in patients with an ED, only the EDQOL questionnaire [12] has been subjected to a CFA. In that study, the investigators confirmed the structure of a second-order factor, presumed to be the HRQoL construct that explained the relationships between four latent first-order factors. In the current study, CFA of the HeRQoLEDv2 revealed two correlated second-order factors that explained the relationships
between seven first-order factors. In theorizing our model, we did not hypothesize an orthogonal structure
a priori because we assumed that the HRQoL measure-ment construct included the intercorrelation of physical, mental, and social factors affected by EDs and treatment [44,45].
Validation of the HeRQoLEDv2 using CFA provides the questionnaire with greater construct validity than in the version we previously developed [14]. To perform the CFA, we recruited 262 patients with ED. Although one could argue that this sample size is small consider-ing the length of the questionnaire, it must be noted that it is difficult to recruit patients with ED, so recruit-ing this amount of participants can be considered as strength of the study more than a limitation. Among the potential statistical drawbacks derived from the sample size are the increase in sampling error, instability, and reduced reliability of factor analysis solutions [46].
A second aim of this study was to use modern analyti-cal techniques to create a shorter version of the HeRQo-LEDv2. Various strategies are available for the reduction of questionnaires [15]. We chose to apply the Rasch method, as this technique produces a scale that cali-brates items based on their range of difficulty for the target population.
The 20-item HeRQoLED-S that emerged from the Rasch method provided adjustment levels (infit and out-fit), unidimensionality, and local independence sufficient Table 2 Rasch model: Item measure, SE, fit statistics and item-total correlations of the mental health and functionality domain
Mental health and functionality
Itema Content δ SE Infit Outfit
rt (7) PR48 Do you have to stop performing some tasks as a result of your physical problem? 1.16 0.06 1.04 1.05 0.67
(6) PR47 Do you find it difficult to maintain attention as a result of your physical problem? 0.80 0.06 1.11 1.03 0.71
(4) ER41 Do you have to make an extra effort or invest more time than usual as a result of your emotional problems?
0.27 0.06 0.86 0.81 0.76
(5) ER42 Do you accomplish less than you would like to as a result of your emotional problem? 0.17 0.06 0.90 0.85 0.77
(2) MH37
Do you have very sudden mood changes that you find difficult to control? 0.06 0.06 1.17 1.20 0.62
(3) MH40
Do you feel worthless? -0.35 0.06 0.73 0.73 0.80
(10) PT51
Do you set very high goals and feel dissatisfied if you do not meet them? -0.39 0.06 1.17 1.14 0.68
(9) PT50 Do you think that you have to do things perfectly or just not to do them at all? -0.42 0.06 1.24 1.24 0.68
(8) PT49 Do you feel lack of confidence in your own capabilities? -0.45 0.06 0.87 0.88 0.73
(1) MH36
Do you feel happy? -0.86 0.06 0.84 0.95 0.64
Every question has a response scale of 6 ordinal options, being 0 = Never and 5 = Always.
δ= Level of severity of the social maladjustment factor. Higher values indicate higher severity; SE = standard error;rt= correlation between item and total
measured social maladjustment level based on the Rasch calibrated item scores and total scores.
a
The numbers in parentheses reflect the current item location in the shortened version.
to be considered adequate. A slight DIF was observed in only one item. We decided not to remove the item from the questionnaire since it was clinically relevant and presented satisfactory levels of functioning in the other parameters (fit statistics, local dependence, and response scale functioning).
A third aim of the study was to validate the HeR-QoLED-S. A CFA applied to the HeRQoLED-S con-firmed the goodness of the structure achieved using the Rasch method, as reflected in the obtained fit indices. Other studies have also applied CFA to vali-date the internal structure of shortened questionnaires [47]. Apart of the hypothesized concurrent correlations between the HeRQoLED-S and specific domains of the EAT-26 and SF-12, the social maladjustment factor of the HeRQoLED-S correlated highly with the second factor of the EAT-26, bulimia and food preoccupation. This latter correlation had not been hypothesized pre-viously. The bulimia and food preoccupation factor contains questions about the control that food exer-cises over an individual’s life and about binges and vomiting. It makes sense that the social maladjustment domain is highly correlated with this factor because individuals who engage in bingeing and vomiting also manifest problems with social adjustment [48,49]. However, our first hypothesis was to correlate the social maladjustment domain with the dieting concern factor because questions pertaining to it inquire about restrictive behaviors and body image, and are more similar in content to those covered by the social mal-adjustment domain.
We estimated that the shortened form requires approximately 5 to 7 minutes to complete, which is about one-third the time it takes to complete the origi-nal HeRQoLEDv2. This is a considerable reduction in time commitment for participants.
One limitation of the HeRQoLED-S is that its items did not cover the entire range of existing difficulties, and gaps in construct difficulty were detected. Although including more items would have helped cover the different levels of construct difficulty, this was not possible because we were working with a
predetermined set of items and selected those that provided the best distribution despite the gaps. In addition, although redundant items were identified for mental health and functionality, they were maintained because the scale generally provided good content validity and good fit indices.
Coste et al. [16] have recommended that shortened versions of questionnaires be evaluated psychometrically (particularly with regard to construct validity and relia-bility) using a new and independent sample. Due to financial limitations and difficulties in recruiting another large sample of patients with an ED, the HeRQoLED-S was validated using the same patient sample as in the follow-up study. We believe this was appropriate given that the T2 sample contained a different number of patients and that the one-year interval since the last contact uses to lead to significant changes in ED symp-toms, as some other studies have shown [50,51]. Never-theless, the same level of validity cannot be obtained from a repeat sample as from a new independent sam-ple. Thus, the shortened HeRQoLED-S must still be validated among different groups of patients with eating disorders.
In conclusion, CFA analysis supports an internal structure of two latent factors of the 55-question HeR-QoLEDv2. A short form questionnaire derived from this second order structure, the 20-item HeRQoLED-S, has been developed and validated with modern psycho-metric techniques that facilitate its use in research and clinical practice. Both versions have demonstrated good reliability and validity. Future applications of HeRQo-LEDv2 and HeRQoLED-S using different ED patient samples will yield more evidence about their validity and reliability.
Acknowledgements
This study was partially supported by the Instituto de Salud Carlos III (Reference: 00/0115), the Fondo Europeo de Desarrollo Regional (FEDER) and the Department of Education, Universities and Research of the Basque Government. We are very grateful to the individuals with an ED who continue to collaborate with us in our research. We also wish to thank Drs. Begoña Urresti and Arantza Madrazo for their invaluable collaboration in patient recruitment. We are grateful to the Comisión de Investigación from
Table 3 Measurement of the concurrent validity and reliability of the HeRQoLED-S
Social maladjustment Mental health and functionality
SF-12 PCS -.27 -.33
SF-12 MCS -.51 -.69
EAT“Dieting concern”factor .82 .61
EAT“Bulimia and food preoccupation”factor .73 .58
EAT“Oral control”Factor .49 .44
Cronbach alpha .91 .90
the Hospital de Galdakao for funding the translation and editing of the article.
Author details
1
CIBER Epidemiology and Public Health, Research Unit 9th floor, Hospital Galdakao - Usansolo, B° Labeaga s/n, Bizkaia 48960, Spain.2Department of Psychiatry, Hospital Galdakao - Usansolo, B° Labeaga s/n, Bizkaia 48960, Spain.3Basque Foundation for Health Innovation and Research (BIOEF) -CIBER Epidemiology and Public Health, Plaza Asua n°1, Sondika 48150, Bizkaia, Spain.4Department of Psychiatry, Ortuella Mental Health Center, Av Del Minero n°1, Ortuella, Bizkaia 48960, Spain.
Authors’contributions
CLH, JMQ, AP and AB conceived the study. CLH participated in all the phases of the study, design, recruitment of patients, data analysis, interpretation of results, and writing of the manuscript. JMQ supervised the study, participated in the interpretation of results and in the writing of the manuscript. AB designed the study and performed the statistical analysis. AP and PM collaborated actively in patient recruitment, revised the data obtained and reviewed the manuscript writing. All the authors read and approved the final manuscript.
Competing interests
The authors declare that they have no competing interests.
Received: 3 August 2009 Accepted: 18 March 2010 Published: 18 March 2010
References
1. de la Rie SM, Noordenbos G, van Furth EF:Quality of life and eating disorders.Qual Life Res2005,14:1511-1521.
2. de la Rie SM, Noordenbos G, Donker M, van Furth EF:The patient’s view on quality of life and eating disorders.Int J Eat Disord2006,40:13-20. 3. Doll HA, Petersen S, Stewart-Brown S:Eating disorders and emotional and
physical well-being: Associations between student self-reports of eating disorders and quality of life as measured by the SF-36.Qual Life Res
2005,14:705-717.
4. Keilen M, Treasure T, Schmidt U, Treasure J:Quality of life measurements in eating disorders, angina, and transplant candidates: are they comparable?J R Soc Med1994,87:441-444.
5. Miller PM:Redefining success in eating disorders.Addict Behav1996,
21:745-754.
6. Padierna A, Quintana J, Arostegui I, González N, Horcajo M:The health-related quality of life in eating disorders.Qual Life Res2000,9:667-674. 7. Padierna A, Quintana JM, Arostegui I, Gonzalez N, Horcajo MJ:Changes in
health related quality of life among patients treated for eating disorders.Qual Life Res2002,11:545-552.
8. Spitzer RL, Kroenke K, Linzer M, Hahn SR, Williams JB, deGruy FVI, Brody D, Davies M:Health-related quality of life in primary care patients with mental disorders. Results from the PRIME-MD 1000 Study.JAMA1995,
274:1511-1517.
9. Hay P, Mond JM:How to‘count the cost’and measure burden? A review of health-related quality of life in people with eating disorders.J Ment Health2005,14:539-552.
10. Adair C, Marcoux G, Cram B, Ewashen C, Chafe J, Cassin S, Pinzon J, Gusella J, Geller J, Scattolon Y, Fergusson P, Styles L, Brown K:
Development and multi-site validation of a new condition-specific quality of life measure of eating disorders.Health Qual Life Outcomes
2007,5:23.
11. Abraham SF, Brown T, Boyd C, Luscombe G, Russell J:Quality of life: eating disorders.Aust N Z J Psychiatry2006,40:150-155.
12. Engel S, Wittrock D, Crosby RD, Wonderlich S, Mitchell J, Kolotkin RL:
Development and psychometric validation of an eating disorder-specific health-related quality of life instrument.Int J Eat Disord2006,39:62-71. 13. Las Hayas C, Quintana JM, Padierna A, Bilbao A, Muñoz P, Madrazo A,
Urresti B, Cook E:The new questionnaire Health-Related Quality of Life for Eating Disorders showed good validity and reliability.J Clin Epidemiol
2006,59:192-200.
14. Las Hayas C, Quintana J, Padierna A, Bilbao A, Muñoz P, Cook E: Health-Related Quality of Life for Eating Disorders questionnaire version-2 was
responsive 1-year after initial assessment.J Clin Epidemiol2007,
60:825-833.
15. Beaton DE, Wright JG, Katz J, The Upper Extremity Collaborative Group:
Development of the QuickDASH: Comparison of three item-reduction approaches.J Bone Joint Surg Am2005,87-A:1038-1046.
16. Coste J, Guillemin F, Pouchot J, Fermanian J:Methodological approaches to shortening composite measurement scales.J Clin Epidemiol1997,
50:247-252.
17. Nijsten T, Unaeze J, Stern R:Refinement and reduction of the Impact of Psoriasis Questionnaire: Classical Test Theory vs. Rasch analysis.Br J Dermatol2006,154:692-700.
18. Smith A, Wright E, Rush R, Stark D, Velikova G, Selby P:Rasch analysis of the dimensional structure of the Hospital Anxiety and Depression Scale. Psycho-oncology2006,15:817-827.
19. Linacre J:Sample size and item calibration stability.Rasch Meas Trans
1994,7:328.
20. American Psychiatric Association:Diagnostic and Statistical Manual for Mental DisordersWashington, DC: American Psychiatric Press, 4 1994. 21. Gandek B, Ware JE, Aaronson NK, Apolone G, Bjorner JB, Brazier JE,
Bullinger M, Kaasa S, Leplege A, Prieto L, Sullivan M:Cross-validation of item selection and scoring for the SF-12 Health Survey in nine countries: results from the IQOLA Project. International Quality of Life Assessment. J Clin Epidemiol1998,51:1171-1178.
22. Ware JE, Kosinski M, Keller SD:A 12-Item Short-Form Health Survey: construction of scales and preliminary tests of reliability and validity. Med Care1996,34:220-233.
23. Castro J, Toro J, Salamero M, Guimera E:The eating attitudes test: validation of the spanish version.Evaluación Psicológica/Psychological Assessment1991,7:175-190.
24. Stice E:Review of the evidence for a sociocultural model of bulimia nervosa and an exploration of the mechanisms of action.Clin Psychol Rev
1994,14:1994.
25. Hillege S, Beale B, McMaster RE-MA, Hillege S:Impact of eating disorders on family life: Individual parents’stories.J Clin Nurs2006,15:1016-1022. 26. Bardone-Cone A, Abramson L, Vohs KD, Heatherton TF, Joiner TE Jr:
Predicting bulimic symptoms: an interactive model of self-efficacy, perfectionism, and perceived weight status.Behav Res Ther2006,
44:27-42.
27. Bardone-Cone AM, Joiner J, Crosby RD, Crow SJ, Klein MH, le Grange D, Mitchell JE, Peterson CB, Wonderlich SA:Examining a psychosocial interactive model of binge eating and vomiting in women with bulimia nervosa and subthreshold bulimia nervosa.Behav Res Ther2008,
46:887-894.
28. Cowen P, Anderson I, Fairburn CG:Neurochemical effects of dieting: Relevance to changes in eating and affective disorders.The biology of feast and famine: Relevance to eating disordersSan Diego, CA: Academic PressAnderson G, Kennedy S 1992, 269-284.
29. Hatcher L:Developing Measurement Models with Confirmatory Factor Analysis.A step-by-step approach to using the SAS® System for factor Analysis and Structural Equation Modeling (ed.)Cary, NC: SAS Institute Inc. 1994, 249-342.
30. Browne M, Cudeck R:Alternative ways of assessing model fit.SMR1992,
21:230-258.
31. SAS QC:SAS/QC User’s Guide, Version 8, Volumes 1, 2, and 3Cary, NC: SAS Institute Inc 1999.
32. Cook K, Teal C, Bjorner JB, Cella D, Chang C-H, Crane P, Gibbons L, Hays R, McHorney CA, Ocepek-Welikson K, Raczek A, Teresi J, Reeve B:IRT health outcomes data analysis project: an overview and summary.Qual Life Res
2007,16:121-132.
33. Reeve BB, Hays RD, Bjorner JB, Cook KF, Crane PK, Teresi JA, Thissen D, Revicki DA, Weiss DJ, Hambleton RK, Liu H, Gershon R, Reise SP, Lai Js, Cella D, on behalf of the PROMIS Cooperative Group:Psychometric Evaluation and Calibration of Health-Related Quality of Life Item Banks: Plans for the Patient-Reported Outcomes Measurement Information System (PROMIS).Med Care2007,45.
34. Prieto G, Delgado A:Análisis de un test mediante el modelo de Rasch. Psicothema2003,15:94-100.
36. Wright B, Stone M:Best test design: Rasch measurementChicago: MESA Press 1979.
37. Linacre J:A User’s Guide to WINSTEPSChicago, IL: MESA Press 2009. 38. Tesio L:Measuring behaviours and perceptions: rasch analysis as a tool
for rehabilitation research.J Rehabil Med2003,35:105-115. 39. Duncan P, Lai S, Bode R, Perera S, De la Rosa J, GAIN Americas
Investigators:Stroke Impact Scale-16. A brief assessment of physical function.Neurology2003,60:291-296.
40. Cole JC, Rabin A, Smith T, Kaufman A:Development and Validation of a Rasch-Derived CES-D Short Form.Psychol Assess2004,16:360-372. 41. Davidson M, Keating JL, Eyres S:A low back-specific version of the SF-36
physical functioning scale.Spine2004,29:586-594.
42. Linacre J:Investigating rating scale utility.J Outcome Meas1999,
3:103-122.
43. Cronbach LJ:Coefficient alpha and the internal structure of tests. Psychometrika1951,16:297-334.
44. Fayers PM, Machin D:Quality of Life: assessment, analysis and interpretation. West Sussex PO19 1UDEngland: John Wiley & Sons Ltd 2000.
45. Revicki DA, Osoba D, Fairclough D, Barofsky I, Berzon R, Leidy NK, Rothman M:Recommendations on health-related quality of life research to support labelling and promotional claims in the United States.Qual Life Res2000,9:887-900.
46. MacCallum R, Widaman K, Zhang S, Hong S:Sample size in factor analysis. Psychol Methods1999,4:84-99.
47. Calvete E, Estévez A, López de Arrotabe E, Ruiz P:The Schema Questionnaire - Short Form. Structure and relationship with automatic thoughts and symptoms of affective disorders.Eur J Psychol Assess2005,
21:90-99.
48. Beales DL, Dolton R:Eating disordered patients: personality, alexithymia, and implications for primary care.Br J Gen Pract2008,50:21-26. 49. Rorty M, Yager J, Buckwalter JG, Rossotto E:Social support, social
adjustment, and recovery status in bulimia nervosa.Int J Eat Disord1999,
26:1-12.
50. Bowers WA, Ansher L:The effectiveness of cognitive behavioral therapy on changing eating disorder symptoms and psychopathology of 32 anorexia nervosa patients at hospital discharge and one year follow-up. Ann Clin Psychitary2008,20:79-86.
51. Fernandez Aranda F, Bel Villar M, Jimenez Murcia S, Turón-Gil V, Vallejo-Ruiloba J, Garcia Vilches I:Outpatient group psychotherapy for Anorexia nervosa.Anales de Psiquiatria1997,13:236-242.
doi:10.1186/1477-7525-8-29
Cite this article as:Las Hayaset al.:Use of rasch methodology to develop a short version of the Health Related Quality of life for Eating Disorders questionnaire: a prospective study.Health and Quality of Life Outcomes20108:29.
Submit your next manuscript to BioMed Central and take full advantage of:
• Convenient online submission
• Thorough peer review
• No space constraints or color figure charges
• Immediate publication on acceptance
• Inclusion in PubMed, CAS, Scopus and Google Scholar
• Research which is freely available for redistribution