R E S E A R C H
Open Access
Comparative efficacy of glimepiride and
metformin in monotherapy of type 2 diabetes
mellitus: meta-analysis of randomized controlled
trials
Hongmei Zhu
1, Shuang Zhu
1, Xiuqian Zhang
1, Yang Guo
1, Yunzhen Shi
1, Zhimin Chen
1and Siu-wai Leung
1,2*Abstract
Background:Metformin treatment has been the most recommended monotherapy of type 2 diabetes mellitus (T2DM) for decades but is challenged by new antidiabetic drugs. This study conducted a meta-analysis of randomized controlled trials (RCT) comparing the efficacy of metformin and glimepiride in monotherapy of T2DM.
Methods:A literature search for RCTs on glimepiride and metformin was conducted on the bibliographic databases, including PubMed, Cochrane Library and ScienceDirect, from their inceptions to 25 Mar 2013. All RCTs were selected according to pre-specified eligibility criteria. The quality of articles was assessed with the Cochrane’s risk of bias tool. Statistical meta-analysis evaluated the overall effects and biochemical indices of T2DM. Sensitivity and subgroup analyses evaluated the robustness and explained the heterogeneity of the results. Begg and Egger’s tests quantified possible publication biases. Results were represented as“standard mean difference or odds ratio [95% confidence internals] P value”.
Results:Fifteen RCTs with 1681 adult T2DM patients were included for meta-analysis. Metformin was not better than glimepiride in overall efficacy in controlling the levels of HbA1c, postprandial blood sugar (PPBS), fasting plasma insulin (FINS), systolic and diastolic blood pressures (SBP and DBP), and high density lipoprotein (HDL). Metformin was only more effective than glimepiride in controlling the levels of total cholesterol (TC, 0.33 [0.03, 0.63], P = 0.03), low-density lipoprotein (LDL, 0.35 [0.16, 0.53], P = 0.0002) and triglycerides (TG, 0.26 [0.05, 0.46], P = 0.01). Odds ratios of adverse events showed that glimepiride was more likely to induce hypoglycemia episodes and metformin was with a higher risk of gastrointestinal upset.
Conclusion:Metformin was not significantly better than glimepiride in glycemic control of T2DM, suggesting that glimepiride would be a good choice second to metformin in the monotherapy of T2DM.
Keywords:Glimepiride, Metformin, Type 2 diabetes mellitus, Meta-analysis
Introduction
Metformin has been the most recommended monother-apy of type 2 diabetes mellitus (T2DM) [1,2]. The UK Prospective Diabetes Study (UKPDS) found metformin more effective than chlorpropamide, glibenclamide and insulin [3–5]. The American Diabetes Association (ADA) recommended metformin as the first drug of choice for
treating T2DM patients, especially those who are over-weight [2]. The UK National Institute for Health and Clinical Excellence (NICE) recommended metformin if the patients are at danger under hypoglycaemia [1]. The latest recommendations of ADA [2] and NICE [1] were updated with the results of UKPDS [6,7], post-trial moni-toring of UKPDS [8], and systematic reviews of comparing metformin with placebo, sulfonylureas and other anti-diabetic drugs [7,9], as well as the randomized controlled trials (RCTs) comparing metformin monotherapy with pio-glitazone [10], metformin plus nateglinide [11], metformin
* Correspondence:siu@inf.ed.ac.uk
1
State Key Laboratory of Quality Research in Chinese Medicine, Institute of Chinese Medical Sciences, University of Macau, Macao, China
2
School of Informatics, University of Edinburgh, Edinburgh EH8 9AB, UK
plus rosiglitazone [12] and other non-metformin treat-ments [13]. A meta-analysis of RCTs on the efficacy of metformin in treating T2DM [14] found metformin lacking clear evidence for efficacy over the conven-tional or placebo treatment. A recent literature review suggested that metformin, albeit old, remained the best treatment for T2DM [15] but the review was not a systematic review or meta-analysis. It did not include the latest RCTs comparing metformin and glimepiride in monotherapy of T2DM.
Glimepiride is of the latest generation sulfonylureas for treating T2DM [16]. It has a lower cardiovascular risk than conventional sulfonylureas do [17–19]. Recent RCTs found it comparable to metformin in treating T2DM patients [20,21] including those who are not responding well to non-glimepiride sulfonylureas [22,23]. Probably due to the late launch of glimepiride [24,25] and lack of head-to-head comparative RCTs, early UKPDS, ADA and NICE’s recommendations did not include the results of RCTs comparing metformin with
Figure 1. Flow of study selection
Identification
583duplicates removed 818 records were assessed for eligibility through database:
Pubmed (n=208)
Cochrane library (n=89)
Science Direct (n=48)
CNKI (n=267)
Wan Fang (n=206)
205 records from:
Google (n=205)
Screening
1023records
440records screened 413records excluded
Not monotherapy design (n=193)
Not clinical trial (n=147)
Non-Randomized Controlled Trials (n=23)
Reviews (n=50)
Eligibility
27 full-text articles assessed for eligibility 12 full-text articles excluded
Non-Randomized Controlled Trials (n=2)
Not adult patients or unclear age range (n=2)
Results Incomplete (n=4)
Redundant publications (n=1)
Plagiarism (n=1)
Medication failure before test (n=2)
Included
15 studies included in quantitative synthesis (meta-analysis)
glimepiride in monotherapy but they did include the findings that sulfonlyureas had increased risks in hypoglycemia, weight gain and cardiovascular issues. Recent cohort studies confirmed the increased cardiovascular risks of glimepiride [26] but did no car-diovascular harm to the patients with diagnosed coronary artery disease [27]. This study aimed to compare the efficacy between metformin and glimepiride in monother-apy of T2DM through a meta-analysis and supply the evidence that was missing from previous reviews [9,11] and clinical guidelines [1,2].
Methods Eligibility criteria Inclusion criteria
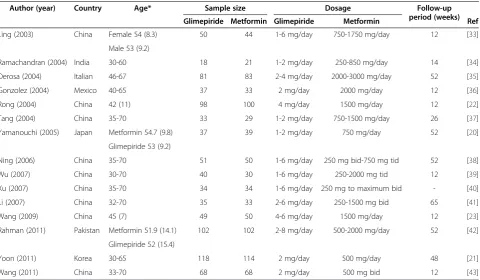
This study included the RCTs comparing glimepiride with metformin as monotherapy of T2DM. Participants in the RCTs were adult patients suffering from T2DM. Outcome measures of the treatment of T2DM included BMI (body mass index), SBP (systolic blood pressure), DBP (diastolic blood pressure), FPG (fasting plasma glucose), HbA1c (glycosylated hemoglobin level), PPBS (postprandial blood sugar), TC (total cholesterol), HDL Table 1 Characteristics of included studies
Author (year) Country Age* Sample size Dosage Follow-up
period (weeks)
Glimepiride Metformin Glimepiride Metformin Ref
Ling (2003) China Female 54 (8.3) 50 44 1-6 mg/day 750-1750 mg/day 12 [33]
Male 53 (9.2)
Ramachandran (2004) India 30-60 18 21 1-2 mg/day 250-850 mg/day 14 [34]
Derosa (2004) Italian 46-67 81 83 2-4 mg/day 2000-3000 mg/day 52 [35]
Gonzolez (2004) Mexico 40-65 37 33 2 mg/day 2000 mg/day 12 [36]
Rong (2004) China 42 (11) 98 100 4 mg/day 1500 mg/day 12 [22]
Tang (2004) China 35-70 33 29 1-2 mg/day 750-1500 mg/day 26 [37]
Yamanouchi (2005) Japan Metformin 54.7 (9.8) 37 39 1-2 mg/day 750 mg/day 52 [20]
Glimepiride 53 (9.2)
Ning (2006) China 35-70 51 50 1-6 mg/day 250 mg bid-750 mg tid 52 [38]
Wu (2007) China 30-70 40 30 1-6 mg/day 250-2000 mg tid 12 [39]
Xu (2007) China 35-70 34 34 1-6 mg/day 250 mg to maximum bid - [40]
Li (2007) China 32-70 35 33 2-6 mg/day 250-1500 mg bid 65 [41]
Wang (2009) China 45 (7) 49 50 4-6 mg/day 1500 mg/day 12 [23]
Rahman (2011) Pakistan Metformin 51.9 (14.1) 102 102 2-8 mg/day 500-2000 mg/day 52 [42]
Glimepiride 52 (15.4)
Yoon (2011) Korea 30-65 118 114 2 mg/day 500 mg/day 48 [21]
Wang (2011) China 33-70 68 68 2 mg/day 500 mg bid 12 [43]
* presented in range or mean (standard deviation).
Table 2 Results of overall efficacy
Outcome No. of
studies
Pooled sample size Heterogeneity Overall effect
T2 I2 P-value SMD [95% CI] P-value
BMI 10 988 0.50 92% <0.00001 -0.06 [-0.53, 0.40] 0.79
SBP 5 615 0.22 86% <0.0001 0.39 [-0.06, 0.83] 0.09
DBP 5 615 0.23 87% <0.00001 0.34 [-0.12, 0.79] 0.15
FPG 14 1611 0.03 47% 0.03 -0.02 [-0.16, 0.12] 0.80
HbA1c 13 1543 0.02 41% 0.06 0.01 [-0.13, 0.14] 0.91
PPBS 11 1099 0.18 81% <0.00001 -0.27 [-0.56, 0.01] 0.06
TC 9 887 0.16 79% <0.0001 0.33 [0.03, 0.63] 0.03
HDL 9 887 0.24 85% <0.00001 0.11 [-0.25, 0.46] 0.56
LDL 6 702 0.02 29% 0.21 0.35 [0.16, 0.53] 0.0002
TG 9 887 0.05 54% 0.03 0.26 [0.05, 0.46] 0.01
(high-density lipoprotein), LDL (low-density lipoprotein), TG (triglycerides) and FINS (fasting plasma insulin).
Exclusion criteria
This study excluded the RCTs with the participants who were non-responders to metformin or glimepiride and received dosages exceeded the upper recommended limit (metformin: 2550 mg daily; glimepiride: 8 mg daily) [28]. The RCTs of extremely small sample size (fewer than 10 patients) were also excluded.
Search and selection of studies
Bibliographical databases, including PubMed, Cochrance Library, Science Direct, China Academic Journals Web Publishing Database, China Master Theses Full-text Database and China Doctor Theses Full-text Database
on the China National Knowledge Infrastructure (CNKI), WanFang Data and Google, were searched from their in-ceptions to 25 Mar 2013.
Search strategies were specified in the working lan-guages of databases, although the terminologies in searching Chinese and English databases were equiva-lent. Basically, the articles with the terms “glimepiride” and “metformin” in titles, abstracts, and keywords were retriered. Specific search strategies were:
PubMed:“Glimepiride”and“Metformin”in Abstract or Title;Cochrane Llibrary:“Glimepiride”and“Metformin” in Title, Abstract or Keywords; Science Direct: “Glimepiride” and “Metformin” in Abstract, Title, or Keywords; China Academic Jounrnals Web Publishing
Database, China Doctor Theses Full-text Database and
China Master Theses Full-text Database:‘Title = Glimepiride Table 3 Cochrane’s risk of bias
Source of bias Random
sequence generation
Allocation concealment
Blinding of participants and
personnel
Blinding of outcome assessment
Incomplete outcome data
Selective reporting
Other source of bias
Ling (2003)[33] U U U U L U U
Ramachandran (2004)[34] U U U U L U U
Derosa (2004)[35] U U U U L U U
Gonzolez (2004)[36] U L L L L U U
Rong (2004)[22] U U U U L U U
Tang (2004)[37] U U U U L U U
Yamanouchi (2005)[20] L L L U L U U
Ning (2006)[38] U U U U L U U
Wu (2007)[39] U U U U L U U
Xu (2007)[40] U U U U L U U
Li (2007)[41] U U U U L U U
Wang (2009)[21] U U U U L U U
Rahman (2011)[42] U U U U L U U
Yoon (2011)[21] U U U U L U U
Wang (2011)[43] U U U U L U U
Note: L, low risk of bias; U, unclear risk of bias; H, high risk of bias.
* Metformin or Keyword = Glimepiride * Metformin or Abstract = Glimepiride * Metformin’ (in Chinese); Wan Fang:‘Title All“Glimepiride Metformin”or Keywords All
“Glimepiride Metformin” or Abstract All “Glimepiride Metformin”’(in Chinese).
Two groups of reviewers (three reviewers in each group) independently performed the literature search and selection. The results from one group were
cross-checked by the other group. Disagreements were re-solved by group discussion.
Data extraction and quality assessment
Two reviewers (HZ, XZ) independently extracted data of study characteristics and outcome measures from the selected RCTs. The extracted data were cross-checked before quality assessment according to the Cochrane’s Table 4 Sensitivity analysis (sample size≥90)
Outcome No. of
studies
Pooled sample size
Heterogeneity Overall effect
T2 I2 P-value SMD [95% CI] P-value
BMI 4 605 0.05 65% 0.03 0.21 [-0.06, 0.49] 0.13
FPG 8 1228 0.01 30% 0.18 0.09 [-0.04, 0.23] 0.18
HbA1c 8 1228 0.03 56% 0.03 0.06 [-0.12, 0.23] 0.52
PPBS 6 792 0.00 0% 0.59 -0.01 [-0.15, 0.13] 0.85
TC 3 504 0.22 90% <0.0001 0.56 [0.00, 1.12] 0.05
HDL 3 504 0.18 88% 0.0002 -0.27 [-0.78, 0.24] 0.30
LDL 3 504 0.01 21% 0.28 0.41 [0.21, 0.61] <0.0001
TG 3 504 0.00 0% 0.61 0.13 [-0.05, 0.30] 0.16
FINS 5 698 0.44 93% <0.00001 0.37 [-0.23, 0.98] 0.22
Table 5 Sensitivity analysis based on drug treatment before trials
Criteria Outcome No. of
studies
Pooled sample size
Heterogeneity Overall effect
T2 I2 P-value SMD [95% CI] P-value
Excluding the studies with non-responders to
other sulfonylureas
BMI 10 988 0.50 92% <0.00001 -0.06 [-0.53, 0.40] 0.79
SBP 5 615 0.22 86% <0.0001 0.39 [-0.06, 0.83] 0.09
DBP 5 615 0.23 87% <0.00001 0.34 [-0.12, 0.79] 0.15
FPG 12 1314 0.04 48% 0.03 0.01 [-0.15, 0.17] 0.91
HbA1c 11 1246 0.03 46% 0.05 0.04 [-0.12, 0.19] 0.65
PPBS 9 802 0.27 85% <0.00001 -0.32 [-0.69, 0.06] 0.10
TC 9 887 0.16 79% <0.0001 0.33 [0.03, 0.63] 0.03
HDL 9 887 0.24 85% <0.00001 0.11 [-0.25, 0.46] 0.56
LDL 6 702 0.02 29% 0.21 0.35 [0.16, 0.53] 0.0002
TG 9 887 0.05 54% 0.03 0.26 [0.05, 0.46] 0.01
FINS 8 722 0.58 92% <0.00001 0.11 [-0.44, 0.67] 0.69
Excluding the studies with participants who used other anti-diabetic drugs before RCTs
BMI 6 687 0.05 56% 0.04 0.27 [0.03, 0.51] 0.03
SBP 3 444 0.22 87% 0.0004 0.60 [0.03, 1.16] 0.04
DBP 3 444 0.29 90% <0.0001 0.52 [-0.12, 1.16] 0.11
FPG 8 989 0.07 66% 0.004 -0.03 [-0.26, 0.19] 0.78
HbA1c 7 921 0.05 61% 0.02 -0.00 [-0.22, 0.22] 1.00
PPBS 5 477 0.54 92% <0.00001 -0.60 [-1.28, 0.08] 0.08
TC 6 687 0.18 82% <0.0001 0.38 [0.00, 0.76] 0.05
HDL 6 687 0.12 76% 0.0009 -0.14 [-0.46, 0.19] 0.41
LDL 4 572 0.04 56% 0.08 0.30 [0.05, 0.56] 0.02
TG 6 687 0.00 0% 0.74 0.13 [-0.02, 0.28] 0.10
risks of bias tool [29]. Disagreement was resolved by discussion between the reviewers (HZ, XZ). A third reviewer (SZ) was consulted when necessary.
Meta-analysis
Extracted data were transferred to Review Manager 5.2 [30] for meta-analysis with random-effects model. Nu-meric outcome measures were represented in standard-ized mean differences (SMD) or odds ratios (OR) and their 95% confidence intervals (CI). Study heterogeneity
was evaluated with T2 test and I2 statistics. P values below 0.05 were considered statistically significant.
Sensitivity and subgroup analysis
Sensitivity analysis of the efficacy was performed on the sample sizes, on whether the patients received prior anti-diabetic treatments and on the daily dose of metformin. Subgroup analysis was performed to explain the heterogen-eity in terms of differences in follow-up periods and charac-teristics of the participants.
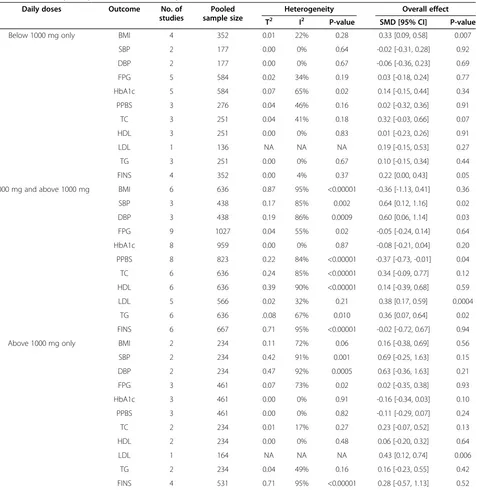
Table 6 Sensitivity analysis based on the daily doses of metformin
Daily doses Outcome No. of
studies
Pooled sample size
Heterogeneity Overall effect
T2 I2 P-value SMD [95% CI] P-value
Below 1000 mg only BMI 4 352 0.01 22% 0.28 0.33 [0.09, 0.58] 0.007
SBP 2 177 0.00 0% 0.64 -0.02 [-0.31, 0.28] 0.92
DBP 2 177 0.00 0% 0.67 -0.06 [-0.36, 0.23] 0.69
FPG 5 584 0.02 34% 0.19 0.03 [-0.18, 0.24] 0.77
HbA1c 5 584 0.07 65% 0.02 0.14 [-0.15, 0.44] 0.34
PPBS 3 276 0.04 46% 0.16 0.02 [-0.32, 0.36] 0.91
TC 3 251 0.04 41% 0.18 0.32 [-0.03, 0.66] 0.07
HDL 3 251 0.00 0% 0.83 0.01 [-0.23, 0.26] 0.91
LDL 1 136 NA NA NA 0.19 [-0.15, 0.53] 0.27
TG 3 251 0.00 0% 0.67 0.10 [-0.15, 0.34] 0.44
FINS 4 352 0.00 4% 0.37 0.22 [0.00, 0.43] 0.05
1000 mg and above 1000 mg BMI 6 636 0.87 95% <0.00001 -0.36 [-1.13, 0.41] 0.36
SBP 3 438 0.17 85% 0.002 0.64 [0.12, 1.16] 0.02
DBP 3 438 0.19 86% 0.0009 0.60 [0.06, 1.14] 0.03
FPG 9 1027 0.04 55% 0.02 -0.05 [-0.24, 0.14] 0.64
HbA1c 8 959 0.00 0% 0.87 -0.08 [-0.21, 0.04] 0.20
PPBS 8 823 0.22 84% <0.00001 -0.37 [-0.73, -0.01] 0.04
TC 6 636 0.24 85% <0.00001 0.34 [-0.09, 0.77] 0.12
HDL 6 636 0.39 90% <0.00001 0.14 [-0.39, 0.68] 0.59
LDL 5 566 0.02 32% 0.21 0.38 [0.17, 0.59] 0.0004
TG 6 636 .0.08 67% 0.010 0.36 [0.07, 0.64] 0.02
FINS 6 667 0.71 95% <0.00001 -0.02 [-0.72, 0.67] 0.94
Above 1000 mg only BMI 2 234 0.11 72% 0.06 0.16 [-0.38, 0.69] 0.56
SBP 2 234 0.42 91% 0.001 0.69 [-0.25, 1.63] 0.15
DBP 2 234 0.47 92% 0.0005 0.63 [-0.36, 1.63] 0.21
FPG 3 461 0.07 73% 0.02 0.02 [-0.35, 0.38] 0.93
HbA1c 3 461 0.00 0% 0.91 -0.16 [-0.34, 0.03] 0.10
PPBS 3 461 0.00 0% 0.82 -0.11 [-0.29, 0.07] 0.24
TC 2 234 0.01 17% 0.27 0.23 [-0.07, 0.52] 0.13
HDL 2 234 0.00 0% 0.48 0.06 [-0.20, 0.32] 0.64
LDL 1 164 NA NA NA 0.43 [0.12, 0.74] 0.006
TG 2 234 0.04 49% 0.16 0.16 [-0.23, 0.55] 0.42
FINS 4 531 0.71 95% <0.00001 0.28 [-0.57, 1.13] 0.52
Adverse events analysis
Adverse events analysis was performed on the hypoglycemia, gastrointestinal upset and overall side effects with their odds ratios (OR) and 95% CI.
Publication bias
Funnel plots were generated to visualize possible publi-cation bias. Begg and Egger’s tests using the package
“metafor” [31] with statistical software R [32] evaluated the statistical significance of the publication bias.
Results
Included studies and their characteristics
Figure 1 shows the selection process of the studies. A total of 1023 records were identified in accordance with the search strategies from specific bibliographical data-bases, i.e. PubMed (n = 208), Cochrance Library (n = 89), Science Direct (n = 48), Chinese National Knowledge Infrastructure (n = 267), WangFang (n = 206) and Google (n = 205). Among the 440 records after removal of dupli-cates, 27 records met the eligibility criteria. After full-text assessment, 12 of 27 studies were excluded for the reasons stated in Figure 1. As a result, 15 RCTs with 1681 participants were included for meta-analysis. The characteristics of the included studies are shown in Table 1.
Overall effects
Meta-analysis was performed on the outcome measures FPG, BMI, HbA1c, PPBS, TC, FINS, HDL, LDL, TG, SBP and DBP. The SMD, 95% CI and P values for out-comes between metformin and glimepiride are shown in Table 2. The SMDs between metformin and glimepiride were only statistically significant on TC (0.33 [0.03, 0.63], P = 0.03), LDL (0.35 [0.16, 0.53], P = 0.00002), and TG (0.26 [0.05, 0.46], P = 0.01), indicating that efficacy of metformin was statistically significant over glimepiride in lipid metabolism indices. The differences in glycemic control (e.g. HbA1c and PPBS) and cardiovascular indi-ces (e.g. blood pressure) were not statistically significant. As shown in Table 2, there were significant heterogene-ities among studies in SBP (I2= 86%, P < 0.0001), DBP (I2= 87%, P < 0.00001), PPBS (I2= 81%, P < 0.00001), TC (I2= 79%, P < 0.0001), HDL (I2= 86%, P < 0.00001) and FINS (I2= 91%, P < 0.00001). The heterogeneities justified the use of random-effects model in meta-analysis.
Risk of bias across studies
Cochrane’s risk of bias tool was used to assess the RCT quality (Table 3 and Figure 2). The attrition bias of all included studies was low (few missing data). Other key aspects among studies were mostly unclear in risk of bias except two studies [20,36].
Table 7 Subgroup analysis of different follow-up periods Follow-up
period
Outcome No. of studies
Pooled sample size
Heterogeneity Overall effect
T2 I2 P-value SMD [95% CI] P-value
12-24 weeks BMI 4 307 0.00 0% 0.69 0.47 [0.24, 0.69] <0.0001
FPG 7 698 0.03 39% 0.13 -0.08 [-0.27, 0.12] 0.46
HbA1c 7 698 0.07 61% 0.02 -0.04 [-0.29, 0.20] 0.72
PPBS 2 297 0.00 0% 0.78 -0.15 [-0.38, 0.08] 0.20
TC 4 307 0.00 0% 0.98 0.50 [0.27, 0.72] <0.0001
HDL 4 307 0.00 0% 0.66 0.12 [-0.10, 0.35] 0.28
LDL 2 198 0.00 0% 0.36 0.28 [-0.00, 0.56] 0.05
TG 4 307 0.00 0% 0.65 0.21 [-0.01, 0.44] 0.07
FINS 5 542 0.05 54% 0.07 0.05 [-0.21, 0.32] 0.69
48-60 weeks BMI 5 613 0.84 96% <0.00001 -0.63 [-1.46, 0.20] 0.14
SBP 4 545 0.26 89% <0.00001 0.43 [-0.10, 0.96] 0.11
DBP 4 545 0.27 89% <0.00001 0.39 [-0.15, 0.93] 0.16
FPG 7 913 0.04 53% 0.05 0.03 [-0.17, 0.23] 0.77
HbA1c 6 845 0.00 0% 0.43 0.03 [-0.10, 0.17] 0.65
PPBS 3 333 0.00 0% 0.95 -0.02 [-0.23, 0.20] 0.88
TC 4 512 0.37 91% <0.00001 0.23 [-0.39, 0.86] 0.47
HDL 4 512 0.53 94% <0.00001 0.10 [-0.64, 0.84] 0.79
LDL 3 436 0.00 0% 0.80 0.48 [0.29, 0.67] <0.00001
TG 4 512 0.14 80% 0.002 0.31 [-0.11, 0.73] 0.15
Sensitivity analysis
Sensitivity analysis checked whether the overall effects would be different if only the studies with the sample size N≥90 were included. As shown in Table 4, metfor-min outperformed glimepiride only on LDL (0.41 [0.21, 0.61], P < 0.0001) in the studies with sample size N≥90. Other outcomes such as FPG, BMI, TC and TG did not show significant difference between glimepiride and metformin.
Sensitivity analysis also considered whether prior use of anti-diabetic drugs would affect the RCT results. Table 5 shows that only the effect of metformin on BMI became statistically significant after excluding the studies with participants who were non-responders to other sul-fonyureas. The significance of the effects of metformin on TC, LDL, TG and other aspects remained the same, indicating the overall results on those aspects were robust.
Sensitivity analysis tested whether the efficiency of metformin would be different if the daily dose of min was less than 1000 mg. Table 6 shows that metfor-min outperformed glimepiride only on BMI (0.33 [0.09,
0.58], P = 0.007) with a low daily dose and on LDL (0.43 [0.12, 0.74], P = 0.006) with a relative high daily dose.
Subgroup analysis
Meta-analysis of the subgroups with different follow-up periods (12-24 weeks and 48-60 weeks) showed that metformin moderated BMI and TC better than glimepir-ide in the shorter term while both drugs were equivalent in performance in all aspects except LDL in the longer term. As shown in Table 7, metformin performed better than glimepiride on both BMI (0.47 [0.24, 0.69], P < 0.0001) and TC (0.50 [0.27, 0.72], P < 0.0001) in 12-24 weeks subgroup. In 48-60 weeks subgroup, metformin per-formed better only on LDL (0.48 [0.29, 0.67], P < 0.00001).
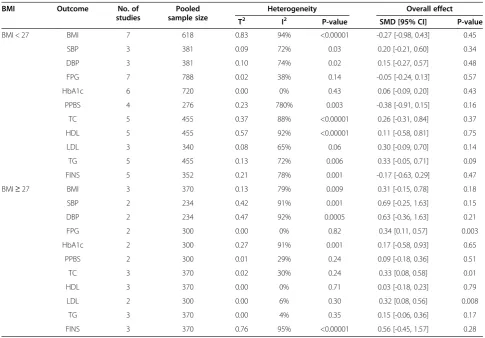
Meta-analysis of the subgroups with BMI below or above 27.5 (i.e. the norm in the countries where the in-cluded RCTs were conducted) [44] was also conducted. As shown in Table 8, metformin outperformed glimepir-ide on control of FPG (0.34 [0.11, 0.57], P = 0.003), TC (0.33 [0.08, 0.58], P = 0.01) and LDL (0.32 [0.08, 0.56], P = 0.008) in the higher BMI subgroup (BMI≥27.5). However, in the lower BMI subgroup (BMI < 27.5)
Table 8 Subgroup analysis of different BMI
BMI Outcome No. of
studies
Pooled sample size
Heterogeneity Overall effect
T2 I2 P-value SMD [95% CI] P-value
BMI < 27 BMI 7 618 0.83 94% <0.00001 -0.27 [-0.98, 0.43] 0.45
SBP 3 381 0.09 72% 0.03 0.20 [-0.21, 0.60] 0.34
DBP 3 381 0.10 74% 0.02 0.15 [-0.27, 0.57] 0.48
FPG 7 788 0.02 38% 0.14 -0.05 [-0.24, 0.13] 0.57
HbA1c 6 720 0.00 0% 0.43 0.06 [-0.09, 0.20] 0.43
PPBS 4 276 0.23 780% 0.003 -0.38 [-0.91, 0.15] 0.16
TC 5 455 0.37 88% <0.00001 0.26 [-0.31, 0.84] 0.37
HDL 5 455 0.57 92% <0.00001 0.11 [-0.58, 0.81] 0.75
LDL 3 340 0.08 65% 0.06 0.30 [-0.09, 0.70] 0.14
TG 5 455 0.13 72% 0.006 0.33 [-0.05, 0.71] 0.09
FINS 5 352 0.21 78% 0.001 -0.17 [-0.63, 0.29] 0.47
BMI≥27 BMI 3 370 0.13 79% 0.009 0.31 [-0.15, 0.78] 0.18
SBP 2 234 0.42 91% 0.001 0.69 [-0.25, 1.63] 0.15
DBP 2 234 0.47 92% 0.0005 0.63 [-0.36, 1.63] 0.21
FPG 2 300 0.00 0% 0.82 0.34 [0.11, 0.57] 0.003
HbA1c 2 300 0.27 91% 0.001 0.17 [-0.58, 0.93] 0.65
PPBS 2 300 0.01 29% 0.24 0.09 [-0.18, 0.36] 0.51
TC 3 370 0.02 30% 0.24 0.33 [0.08, 0.58] 0.01
HDL 3 370 0.00 0% 0.71 0.03 [-0.18, 0.23] 0.79
LDL 2 300 0.00 6% 0.30 0.32 [0.08, 0.56] 0.008
TG 3 370 0.00 4% 0.35 0.15 [-0.06, 0.36] 0.17
metformin and glimepiride were not significantly different in performance as determined by outcome measures.
Adverse events
Eight out of 15 studies reported adverse events. As shown in Table 9, glimepiride had more hypoglycemia episodes than metformin did (4.94 [2.03, 11.99], P = 0.0004). Inci-dents of gastrointestinal upset, including diarrhea, epigas-tric discomfort, stomach pain and abdominal distension, were reported more frequently in metformin group (0.07 [0.01, 0.37], P = 0.002). Overall, these two drugs had no significant difference in side effects (0.35 [0.06, 2.01], P = 0.24) among the included RCTs.
Publication bias
Funnel plots were generated to visualize possible publi-cation bias. Major outcomes FPG, BMI, HbA1c, PPBS, TC, FINS, HDL, LDL, TG, SBP and DBP showed moder-ate asymmetries across studies in the funnel plots, indi-cating there was publication bias. A typical funnel plot is shown in Figure 3. The statistical significance of the mod-erate publication bias in sugar (FPG and PPBS) and lipid (HDL and TG) indices was confirmed by the Begg’s rank correlation test [45]. Egger’s linear regression method [46] further confirmed the statistical significance of the publica-tion bias in FPG towards metformin (Table 10), indicating that the difference in glycemic control efficacy between metformin and glimepiride was less than it seemed.
Discussion
Metformin remains the most effective monotherapy of T2DM while its advantages are diminishing among newer anti-diabetic drugs. Past studies comparing the ef-ficacy between metformin with sulfonylureas showed that metformin was significantly better in controlling HbA1c, FPG, BMI, LDL and TG [3–5,7]. Glimepiride is a better sulphonylurea in treating T2DM [17–19,47,48]. The present meta-analytic study found that metformin was not significantly better than glimepiride, particularly in controlling HbA1c, FPG and BMI.
This meta-analysis supported that both metformin and glimepiride was effective in treating T2DM for glycemic control. Metformin performed better than glimepiride in management of BMI and lipid metabolism indices but the advantages of metformin were only significant in short follow-up periods.
These results were deemed robust after evaluation by sensitivity analysis that excluded small RCTs and the par-ticipants who were non-responders to non-glimepiride sulfonylureas or who received anti-diabetic treatment. The differences between metformin and glimepiride be-came insignificant in large RCTs. Even for treating the patients who were not responding to conventional (non-glimepiride) sulfonylureas, glimepiride and met-formin were equivalent in glycemic control. This find-ing could not be achieved by comparfind-ing sulfonylureas (including glimepiride) as a group with metformin.
Figure 3Funnel plots of publication biases in FPG.
Table 10 Results of Begg and Egger's tests Outcome No. of
studies
Begg’s test Egger’s test
Z P-value Kendall’s tau P-value
BMI 10 -2.9174 0.0035 -0.0222 1.0000
SBP 5 -1.3229 0.1859 -0.2000 0.1867
DBP 5 -1.5941 0.1109 -0.4000 0.4833
FPG 14 -2.2496 0.0245 -0.4286 0.0356
HbA1c 13 -0.9014 0.3673 -0.2308 0.3062
PPBS 11 -2.2267 0.0260 -0.4182 0.0866
TC 9 -0.8218 0.4112 -0.0556 0.9195
HDL 9 2.2070 0.0273 0.5000 0.0752
LDL 6 -1.1076 0.2680 -0.3333 0.4694
TG 9 0.8232 0.04104 0.2778 0.3585
FINS 10 -0.8661 0.3864 -0.2444 0.3807
Table 9 Adverse events
Adverse events No. of studies
Pooled sample size
Heterogeneity Overall effect
T2 I2 P-value OR [95% CI] P-value
All side effects 8 1003 4.70 81% <0.00001 0.35 [0.06, 2.01] 0.24
Hypoglycemia 5 542 0.00 0% 0.77 4.94 [2.03, 11.99] 0.0004
Adverse events analysis showed that glimepiride had more hypoglycemia episodes, in agreement with previ-ous results that metformin was associated with less hypoglycemia than sulphonylureas [3] and that metfor-min had a higher risk of gastrointestinal upset [49–51]. The weight gain side effects were not significant in the included RCTs, in consistency with the findings of previ-ous studies [52] on the weight gain issue of glimepiride.
The daily dose of metformin affected the efficacy and side effects of metformin. When the daily dose of metfor-min was more than 1000 mg, the probability of gastro-intestinal upset would be increased exponentially [53]. Sensitivity analysis on the daily doses of metformin showed that metformin outperformed glimepiride only on BMI with a low daily dose and on LDL with a rela-tively high daily dose, but was not significantly better than glimepiride on controlling HbA1c, FPG and Fins in all daily doses.
Most of the included RCTs (13 out of 15 in this meta-analysis) were conducted in Asia; thus, the Asian norm of BMI for subgroup analysis was adopted. It seems that Asian patients were less affected by the weight gain side effect of glimepiride. Multi-country and multi-ethnic tri-als are warranted to test whether glimepiride is more suitable for Asian patients. Double-blind RCTs with lon-ger follow-up periods should be conducted to assess other side effects such as those on cardiovascular sys-tem. It is encouraging that new clinical trials comparing metformin and glimepiride for monotherapy of T2DM have been registered [54]. Hence, proper updates on this meta-analysis will be conducted in forthcoming years.
These results provide direct evidence to support ADA’s and NICE’s recommendations to consider glimepiride as one of the alternatives to metformin. Our meta-analysis of the RCT results demonstrated that the advantages of metformin over glimepiride were not always significant particularly in Asian patients.
Conclusion
Metformin and glimepiride were not significantly differ-ent in glycemic control of T2DM, suggesting that glime-piride would be a good choice second to metformin in the monotherapy of T2DM.
Abbreviations
BMI:Body mass index; DBP: Diastolic blood pressure; FPG: Fasting plasma glucose; FINS: Fasting plasma insulin; HbA1c: Glycosylated hemoglobin level; HDL: High-density lipoprotein; LDL: Low-density lipoprotein;
PPBS: Postprandial blood sugar; RCT: Random control trials; SBP: Systolic blood pressure; TC: Total cholesterol; TG: Triglycerides; T2DM: Type 2 diabetes mellitus.
Competing interests
The authors declare that they have no competing interests.
Authors’contributions
SL supervised this study. HZ and XZ extracted and analyzed the data from the selected studies according to the eligibility criteria. SZ repeated data analysis for cross-checking. Other authors assisted in searching the databases, assessing and selecting studies. HZ, SZ and SL interpreted the data and drafted a report on the findings. SL revised the manuscript for submission. All authors read and approved the final version of the manuscript.
Acknowledgement
The work of HZ, SZ and SL is part of a research project“Open systematic reviewing of clinical trials”(MYRG190-Y3-L3-ICMS-LSW) funded by the University of Macau.
Received: 13 May 2013 Accepted: 4 November 2013 Published: 14 November 2013
References
1. The National Collaborating Centre for Chronic Conditions:Type 2 diabetes: national clinical guideline for management in primary and secondary care (update).London: Royal College of Physicians; 2008.
2. Association American Diabetes:Standards of medical care in diabetes-2013.
Diabetes Care2013,36:S11–66.
3. UK Prospective Diabetes Study Group:Effect of intensive blood-glucose control with metformin on complications in overweight patients with type 2 diabetes (UKPDS 34).Lancet1998,352:854–865.
4. Stratton IM, Adler AI, Neil HAW, Matthews DR, Manley SE, Cull CA, Hadden D, Turner RC, Holman RR, on behalf of the UK Prosepective Diabetes Study Group:Association of glycaemia with macrovascular and microvascular complications of type 2 diabetes (UKPDS 35): prospective observational study.BMJ2000,321:405–412.
5. Adler AI, Stratton IM, Haw N, Yudkin JS, Matthews DR, Cull CA, Wright AD, Turner RC, Holman RR, UK Prospective Diabetes Study Group:Association of systolic blood pressure with macrovascular and microvascular complications of type 2 diabetes (UKPDS 36): prospective observational study.BMJ2000,321:412–419.
6. Inzucchi SE, Bergenstal RM, Buse JB, Diamant M, Ferrannini E, Nauck M, Peters AL, Tsapas A, Wender R, Matthews DR:Management of
hyperglycemiain type 2 diabetes: a patient-centered approach.Diabetes Care2012,35:1364–1379.
7. Saenz A, Fernandez-Esteban I, Mataix A, Ausejo Segura M, Roqué i Figuls M, Mohr D:Metformin monotherapy for type 2 diabetes mellitus.Cochrane DB Syst Rev2009,3:CD002966. doi: 10.1002/14651858.CD002966.pub3. 8. Holman RR, Paul SK, Bethel MA, Matthews DR, Neil HAW:10-year follow-up of
intensive glucose control in type 2 diabetes.NEJM2008,359:1577–1589. 9. Bennett WL, Maruthur NM, Singh S, Segal JB, Wilson LM, Chatterjee R,
Marinopoulos SS, Puhan MA, Ranasinghe P, Block L, Nicholson WK, Hutfless S, Bass EB, Bolen S:Comparative effectiveness and safety of medications for type 2 diabetes: an update including new drugs and 2-drug combinations.
Ann Intern Med2011,154:602–614.
10. Schernthaner G, Matthews DR, Charbonnel B, Hanefeld M, Brunetti P, on behalf of the quarter study group:Efficacy and safety of pioglitazone versus metformin in patients with type 2 diabetes mellitus: a double-blind, randomized trial.J Clin Endocrinol Metab2004,89:6068–6076. 11. Marre M, Gaal LV, Usadel KH, Ball M, Whatmough I, Guitard C:Nateglinide
improves glycaemic control when added to metformin monotherapy: results of a randomized trial with type 2 diabetes patients.Diabetes Obes Metab2002,4:177–186.
12. Bailey CJ, Bagdonas A, Rubes J, McMorn SO, Donaldson J, Biswas N, Stewart MW:Rosiglitazone/metformin fixed-dose combination compared with uptitrated metformin alone in type 2 diabetes mellitus: a 24-week, multicenter, randomized, double-blind, parallel-group study.Clin Ther 2005,27:1548–1561.
13. Cryer DR, Nicholas SP, Henry DH, Mills DJ, Stadel BV:Comparative outcomes study of metformin intervention versus conventional approach.Diabetes Care2005,28:539–543.
14. Boussageon R, Suupper I, Bejan-Angoulvant T, Kellou N, Cucherat M, Boissel JP, Kassai B, Moreau A, Gueyffier F, Cornu C:Reappraisal of metformin efficacy in the treatment of type 2 diabetes: a meta-analysis of randomised controlled trials.PLOS Med2012,9:e1001204.
16. Hamaguchi T, Hirose T, Asakawa H, Itoh Y, Kamado K, Tokunaga K, Tomita K, Masuda H, Watanabe N, Namba M:Efficacy of glimepiride in type 2 diabetic patients treated with glibenclamide.Diabetes Res Clin Pract2004,
66:S129–132.
17. Rendell M:The role of sulphonylureas in the management of type 2 diabetes mellitus.Drugs2004,64:1339–1358.
18. Nissen SE, Nicholls SJ, Wolski K, Nesto R, Kupfer S, Perez A, Jure H, Larochellière R, Staniloae CS, Mavromatis K, Saw J, Hu B, Lincoff AM, Tuzcu EM, for the PERISCOPE Investigators:Comparison of pioglitazone vs glimepiride on progression of coronary atherosclerosis in patients with type 2 diabetes.JAMA2008,299:1561–1573.
19. Schotborgh CE, Wilde AAM:Sulfonylurea derivatives in cardiovascular research and in cardiovascular patients.Cardiovasc Res1997,34:73–80. 20. Yamanouchi T, Sakai T, Igarashi K, Ichiyanagi K, Watanabe H, Kawasaki T:
Comparison of metabolic effects of pioglitazone, metformin, and glimepiride over 1 year in Japanese patients with newly diagnosed Type 2 diabetes.Diabet Med2005,22:980–985.
21. Yoon KH, Shin JA, Kwon HS, Lee SH, Min KW, Ahn YB, Yoo SJ, Ahn KJ, Park SW, Lee KW, Sung YA, Park TS, Kim MS, Kim YK, Nam MS, Kim HS, Park IB, Park JS, Woo JT, Son HY:Comparison of the efficacy of glimepiride, metformin, and rosiglitazone monotherapy in korean drug-naive type 2 diabetic patients: the practical evidence of antidiabetic monotherapy study.Diabetes Metab J2011,35:26–33.
22. Rong W, Cai LS:Comparing the efficacy of glimepiride and metformin in patients who are secondary sulfonylurea failure.Chinese J Diabetes2004,
12:211–212.
23. Wang KL, Lei GD, Tang XX, Huang YH:Comparison of the efficacy of glimepiride and metformin in patients who are secondary sulfonylurea failure.Drug Research2009,18.
24. UK Prospective Diabetes Study.http://www.dtu.ox.ac.uk/ukpds_trial/index.php. 25. HMR's Amaryl Launched For Diabetes In The USA.http://www.
thepharmaletter.com/file/69437/hmrs-amaryl-launched-for-diabetes-in-the-usa.html.
26. Schramm TK, Gislason GH, Vaag A, Rasmussen JN, Folke F, Hansen ML, Fosbol EL, Kober L, Norgaard ML, Madsen M, Hansen PR, Torp-Pedersen C:
Mortality and cardiovascular risk associated with different insulin secretagogues compared with metformin in type 2 diabetes, with or without a previous myocardial infarction: a nationwide study.Eur Heart J2011,32:1900–1908.
27. Pantalone KM, Kattan MW, Yu C, Wells BJ, Arrigain S, Jain A, Atreja A, Zimmerman RS:Increase in overall mortality risk in patients with type 2 diabetes receiving glipizide, glyburide or glimepiride monotherapy versus metformin: a retrospective analysis.Diabetes Obes Metabol2012,
14:803–809.
28. Food and Drug Administration (FDA):Appoved drug products with therapeutic equivalence evaluations 32nd.U.S: Department of Health and Human Services, Food and Drug Administration, Center for Drug Evaluation and Research, Office of Pharmaceutical Science, and Office of Generic Drugs; 2012.
29. Higgins JPT, Green S (Eds):Cochrane handbook for systematic reviews of interventions version 5.1.0 [updated March 2011].The Cochrane Collaboration; 2011. Available from www.cochrane-handbook.org.
30. Review Manager (RevMan):[Computer program]. Version 5.2.Copenhagen: The Nordic Cochrane Centre, The Cochrane Collaboration; 2012.
31. Viechtbauer W:Conducting meta-analyses in R with the metafor package.
J Stat Software2010,36:1–48.
32. The R Project for Statistical Computing.[http://www.r-project.org/] Accessed in 2013-06-19.
33. Ling ZM:The clinical observation of glimepiride in treating type 2 diabetes.J Clin Med Pract2003,7:574–575.
34. Ramachandran A, Snehalatha C, Salini J, Vijay V:Use of glimepiride and insulin sensitizers in the treatment of type 2 diabetes-a study in indians.
J Assoc Physicians India2004,52:459–463.
35. Derosa G, Franzetti I, Gadaleta G, Ciccarelli L, Fogari R:Metabolic variations with oral antidiabetic drugs in patients with Type 2 diabetes: Comparison between glimepiride and metformin.Dia Nutr Metab2004,
17:143–150.
36. González-Ortiz M, Martínez-Abundis E, Grupo para el Tratamiento de la Diabetes Mellitus con Combinaciones:Efficacy and safety of glimepiride plus metformin in a single presentation, as combined therapy, in
patients with type 2 diabetes mellitus and secondary failure to glibenclamide, as monotherapy.Rev Inest Clin2004,56:327–333. 37. Tang JZ, Mao JP, Yang ZF, Zhou ZG, Tang WP, Feng Q:Effects of
glimepiride and metformin on free fatty acid in patients with type 2 diabetes mellitus.J Cent South Univ Technol2004,29:631–634.
38. Ning J, Tang WL, Zhou ZG, Feng Q, Liu YH, Zhou WD:Effect of glimepiride and metformine on insulin resistance in type 2 diabetics.China J Mod Med2006,16:2224–2227.
39. Wu PS:The clinical efficacy of glimepiride on previously untreated type 2 diabetes patients.Appl J Gen Pract2007,5:1084–1085.
40. Xu ZQ, Yu JB:Clinical observation of glimepiride and metformin in newly diagnosed type 2 diabetes.Chin J Misdiagn2007,7:2454–2455.
41. Li F, Tang GF, Tang TC, Yang YH, Zhang ZM:Glimepiride and metformin in the treatment of metabolism syndrome.J Bengbu Med Coll2007,
32:445–446.
42. Rahman IU, Malik SA, Bashir M, Khan RU, Idrees M:Monotherapy with metformin or glimepiride and changes in serum sialic acid in type 2 diabetes mellitus.British J Diabetes Vascular Med2011,11:137–140. 43. Wang H:Observation of 68 cases of obese type 2 diabetes who are
treated with metformin.Med Forum Mag2011,32:156–157. 44. WHO expert consultation:Appropriate body-mass index for Asian
populations and its implications for policy and intervention strategies.
Lancet2004,363:157–163.
45. Begg CB, Mazumdar M:Operating characteristics of a rank correlation test for publication bias.Biometrics1994,50:1088–1101.
46. Egger M, Smith GD, Schneider M, Minder C:Bias in meta-analysis detected by a simple, graphical test.BMJ1997,315:629–634.
47. Holstein A, Plaschke A, Egberts EH:Lower incidence of severe
hypoglycaemia in patients with type 2 diabetes treated with glimepiride versus glibenclamide.Diabetes Metab Res Rev2001,17:467–473. 48. Sato J, Ohsawa I, Oshida Y, Fukuharu M, Hu XC, Tamagawa T, Sato Y:
Comparison of the effects of three sulfonylureas on in vivo insulin action.Arzneimittel-Forsch2001,51:459–464.
49. Nathan DM, Buse JB, Davidson MB, Ferrannini E, Holman RR, Sherwin R, Zinmann B:Medical management of hyperglycemia in type 2 diabetes: a consensus algorithm for the initiation and adjustment of therapy: a consensus statement of the American Diabetes Association and the European Association for the Study of Diabetes.Diabetes Care2009,
32:193–203.
50. Okayasu S, Kitaichi K, Hori A, Suwa T, Horikawa Y, Yamamoto M, Takeda J, Itoha Y:The evaluation of risk factors associated with adverse drug reactions by metformin in type 2 diabetes mellitus.Biol Pharm Bull2012,
35:933–937.
51. Bennett WL, Wilson LM, Bolen S, Maruthur N, Singh S, Chatterjee R, Marinopoulos SS, Puhan MA, Ranasinghe P, Nicholson WK, Block L, Odelola O, Dalal DS, Ogbeche GE, Chandrasekhar A, Hutfless S, Bass EB, Segal JB:
Oral diabetes medications for adults with type 2 diabetes: an update. In Comparative Effectiveness Review No 27 (Prepared by Johns Hopkins University Evidence-based Practice Center under Contract No 290-02-0018) AHRQ Publication No. 11-EHC038-EF.Edited by Rockville MD. Agency for Healthcare Research and Quality; 2011. Available at: http://www.ncbi.nlm. nih.gov/books/NBK55754/.
52. Bugos C, Austin M, Atherton T, Viereck C:Long-term treatment of type 2 diabetes mellitus with glimepiride is weight neutral: a meta-analysis.
Diabetes Res Clin Pract2000,50:251–254.
53. Garber AJ, Duncan TG, Goodman AM, Mills DJ, Rohlf JL:Efficacy of metformin in type II diabetes: results of a double-blind, placebo-controlled, dose–response trial.Am J Med1997,102:491–497.
54. ClinicalTrials.gov.http://clinicaltrials.gov/ct2/results?term=Diabetes +metformin+Glimepiride.
doi:10.1186/1758-5996-5-70