Open Access
Research
Predicting gender differences as latent variables: summed scores,
and individual item responses: a methods case study
Ricardo Pietrobon*
1, Marcus Taylor
2, Ulrich Guller
3, Laurence D Higgins
1,
Danny O Jacobs
4and Timothy Carey
5Address: 1Division of Orthopaedic Surgery, Center for Excellence in Surgical Outcomes, Duke University Medical Center, Box 3094, Durham, NC
27710, USA, 2Department of Health and Physical Education, Center for Excellence in Surgical Outcomes, Duke University Medical Center,
Durham, NC, USA, 3Center for Excellence in Surgical Outcomes, University Hospital Basel, Department of General Surgery and Surgical Research,
Basel, Switzerland, 4Department of Surgery, Duke University Medical Center, Durham, NC 27710, USA and 5Department of Internal Medicine,
University of North Carolina at Chapel Hill, Chapel Hill, NC 27599, USA
Email: Ricardo Pietrobon* - [email protected]; Marcus Taylor - [email protected]; Ulrich Guller - [email protected]; Laurence D Higgins - [email protected]; Danny O Jacobs - [email protected]; Timothy Carey - [email protected] * Corresponding author
Statistical ModelsOutcome AssessmentPsychometricsGenderLow-back painDisability Evaluation
Abstract
Background: Modeling latent variables such as physical disability is challenging since its measurement is performed through proxies. This poses significant methodological challenges. The objective of this article is to present three different methods to predict latent variables based on classical summed scores, individual item responses, and latent variable models.
Methods: This is a review of the literature and data analysis using "layers of information". Data was collected from the North Carolina Back Pain Project, using a modified version of the Roland Questionnaire.
Results: The three models are compared in relation to their goals and underlying concepts, previous clinical applications, data requirements, statistical theory, and practical applications. Initial linear regression models demonstrated a difference in disability between genders of 1.32 points (95% CI 0.65, 2.00) on a scale from 0–23. Subsequent item analysis found contradictory results across items, with no clear pattern. Finally, IRT models demonstrated three items were demonstrated to present differential item functioning. After these items were removed, the difference between genders was reduced to 0.78 points (95% CI, -0.99, 1.23). These results were shown to be robust with re-sampling methods.
Conclusions: Purported differences in the levels of a latent variable should be tested using different models to verify whether these differences are real or simply distorted by model assumptions.
Published: 25 October 2004
Health and Quality of Life Outcomes 2004, 2:59 doi:10.1186/1477-7525-2-59
Received: 10 May 2004 Accepted: 25 October 2004
This article is available from: http://www.hqlo.com/content/2/1/59 © 2004 Pietrobon et al; licensee BioMed Central Ltd.
Background
Clinical researchers frequently use statistical models in an attempt to model outcomes that are not directly meas-ured, also known as latent variables. Examples of such latent variables include mental health, quality of life, and physical disability. Although groups of items (questions) known as outcome scales can be assumed to measure latent variables, it is methodologically challenging to aggregate item responses into scores that accurately and reliably represent the latent variable.
The aim of this study is to point that the choice of models with biased assumptions can lead to different conclusions regarding the associations between latent variables and predictors. Three alternative methods are presented: Pre-diction of latent variables measured as summed scores using linear regression models, prediction of individual item responses using logistic regression models and pro-pensity scores to control for differences in item responses, and prediction of latent variables using Item Response Theory models with covariates. Since all three methods are statistically sophisticated, they will be described using the technique of "layers of information", and used to eval-uate the purported association between gender and disa-bility. Specifically, we will test whether this association can be explained by different reporting patterns.
Methods
Method of layers of information
The method of "layers of information" was designed to explain complex statistical methods to audiences with a variety of previous quantitative backgrounds. Each layer is associated with a progressive level of complexity; thus, ensuring that readers with different needs can understand the technique to a level that will enable them to at least understand the statistical method of a clinical study (first layer) and ultimately to apply the statistical method to a new research study (last layer). In the current study, we have used five layers of information: (1) General descrip-tion, (2) Examples of previous clinical applications, (3) Data requirements, (4) Statistical Theory, and (5) Analysis and Reporting.
Layer 1 – General description
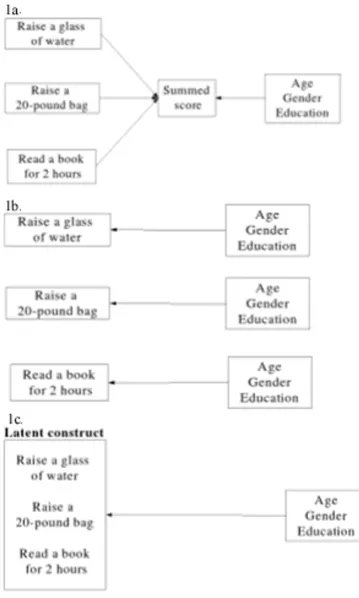
A latent construct is a concept not directly measured, but that can be estimated through proxy measures. Physical disability is an example since its level is frequently inferred from responses given to a series of items in an outcomes scale measuring patients' ability to perform activities of daily living. Because latent variables cannot be directly measured and predicted, several statistical tech-niques were devised to approach this problem (Figure 1).
1. Outcome prediction based on summed scores
The most common approach is to simply add patients' responses to each item; thus, creating a summed score. Summed scores are then used to determine significant predictors in a regression model (Figure 1a).
Two assumptions underlie this strategy. First, we assume that the contribution of each item to the latent variable is known. For example, in a disability scale where patients are questioned about their ability to "raise a glass of water" and to "raise a 40-pound bag", researchers assume that they know the exact amount of disability associated with each of the activities stated by these items. In a scale that does not discriminate between the level of disability associated with each item, the assumption would be that answers to each of these items would represent the same amount of disability, when, in fact, they may not.
The second assumption when using summed scores is that each item measures the latent construct without any inter-ference from extraneous factors. For example, it is assumed that two individuals with the same neck disabil-ity level, but different educational levels would have sim-ilar answer patterns for an item such as "I feel pain in my neck after reading for more than two hours". In this exam-ple this assumption might not be true since individuals with different educational levels may have different levels of exposure to a two-hour reading session and conse-quently have a different perception of the disability caused by such activity. Therefore, in spite of having the same disability level, they would probably provide differ-ent answers to the same item. This phenomenon is known as Differential Item Functioning, previously known as item bias.
2. Outcome prediction based on responses to individual items
A second approach is to use answers from each item and then determine how each predictor is associated with individual item responses (Figure 1b). Although appar-ently simple, this model no longer measures the associa-tion of each predictor with the latent variable of interest since individual items, and not the latent construct, is part of the model. In addition, if different items have contra-dictory levels and directions of association with each pre-dictor, making inferences about the construct may be difficult or impossible.
3. Outcome prediction based on latent variables
Graphical description of three models to predict a latent construct Figure 1
individual items, a latent variable is still assumed. The main underlying assumptions of IRT models are that the association between item responses and the latent varia-ble obeys a constant pattern across items, usually an S-shaped pattern, and that patterns of item-response are not influenced by any factor extraneous to the latent variable. Additional requirements include more powerful comput-ers to execute the computations as well as larger sample sizes.
Layer 2 – Examples of previous clinical
applications
Outcome prediction based on summed scores
In a study designed to predict factors associated with post-treatment disability after lower-extremity soft tissue sar-coma, Davis [1] calculated summed scores from scales measuring impairment [2,3], physical disability [4], and quality of life [5]. Although the authors did not report whether the four scales complied with the assumptions of a linear regression model described in our first layer, they found that large tumor size, bone resection, motor nerve sacrifice, and complications were associated with poor outcomes.
Outcome prediction based on responses to individual items
In a study evaluating the prediction of visual disability based on individual objective measures of visual impair-ment, Bandeen-Roche [6] regressed individual items of Activities of Daily Vision scale [7] and then compared their results to the prediction based on summed scores. These authors found that whereas most vision covariates were similarly associated with different item responses, visual acuity was much more strongly associated with two activities ("difficulty reading signs at night and during the day", and "watching television") than with others ("descending steps in either type of light"). In addition, male gender and a greater number of comorbid condi-tions were also preferentially associated with difficulty watching television.
Although these models bring new insights into the associ-ation between individual physical activities and their respective predictors, they cannot clarify whether these were true predictors or whether they simply presented dif-ferent reporting patterns.
Prediction based on latent variables
To our knowledge, although multiple previous clinical research projects have used IRT for the determination of scale scores [8], no previous clinical articles have used IRT models with concomitant predictors. Potential clinical applications are any situations where the researcher is attempting to predict a latent construct based on a group of variables [8], but where a possibility of different
report-ing patterns or items with an association with different levels of the latent construct are present.
Layer 3 – Data requirements
Outcomes
First, a latent construct has to be measured through a set of proxy variables. These indicators may have responses in various formats, including dichotomous (yes/no), ordinal (e.g., a little, moderate, a lot), or nominal (alternatives without a rank). IRT models assume that the latent con-struct is continuous and, in most cases, unidimensional, meaning that one single latent construct is assumed.
Predictors
Predictors can be continuous or categorical variables.
Sample size
Previous studies have estimated that, for logistic regres-sion models, one should have at least 10 events per pre-dicting variable [9], while for multiple linear regression models this number reduces to four (Freedman 1989). For IRT, some studies have estimated that models can be estimated with as few as 250 respondents, although 500 would be ideal in most scenarios [11]. This number may vary; however, depending on the response heterogeneity to the items in the original sample. As general rule, more heterogeneous responses usually require smaller sample sizes.
Layer 4 – Statistical theory
Outcome prediction based on summed scores
Differences in summed scores according to a set of predic-tor or covariates can be described using linear regression.
In these models, the summed score is represented by y
using a linear combination of predictor variables xj, where
j represents several predicting variables 1, 2, ..., p. It is assumed that no missing values are present for every observation. The fitted values, or predicted summed scores, are then the sum of coefficients βj multiplying each of the xj plus an intercept β0, although the later may be absent in some models. This model can be represented by:
y - β0 + β1 x1 +...+ βp xp
Ordinary least-squares models estimate the coefficients to minimize the squared sum of residuals. If the response and predictors corresponding to the ith of n observations are yi, xi1 ,..., xip, then the fitting criterion chooses the βj to minimize:
The standard statistical theory of linear models makes the first formula more explicit by writing the model for the ith observation as:
( ( : : ))
: : yi j j ijx p i
n
− + −
−
∑
This model makes the following assumptions: The ci are
independently and identically distributed; the ci have
mean zero and finite variance σ2; the c
i have a normal
distribution.
Outcome prediction based on responses to individual items
Individual responses to dichotomous items can be pre-dicted by generalized linear models using a binomial dis-tribution and, most commonly, a logit link function that will bound the probability of an answer to be between 0 (answer = no) and 1 (answer = yes). The logit link can be expressed by:
where πis the probability of a positive answer andx is a vector with item responses
. To linearize the function, the dichotomous response for each item can be algebraically transformed to:
Notice that, in contrast to linear models, the logistic model does not have an error term since it models the probability of an event directly that will determine the variability of the binary outcome. Logistic models are mated by maximum likelihood, which is a method to esti-mate regression coefficients that will maximize the likelihood of obtaining the data ( p(0|x), where 0 is the latent construct.
One of the problems with the prediction based on indi-vidual items is that items do not indiindi-vidually represent the latent construct. Therefore, if one is to predict individual answers, it would be interesting to at least account (adjust) for responses of the same patient to other items. This adjustment can be accomplished by propensity scores [12], which reduce all remaining items to a single composite variable that appropriately summarizes their responses. Compared to the multiple adjustment per-formed in logistic regression models, propensity scores have the advantage of making the adjustment more transparent.
It is important to notice that although the covariates are used as predictors for the item-response, it is still impossi-ble to infer whether this association was distorted by an
association between item responses and extraneous varia-bles rather than the association between item responses and the latent trait.
Outcome prediction based on latent variables
Although multiple models have been described for the regression of latent variables on predictors [6], we will concentrate on IRT. IRT assumes that the response of patients to individual items can be modeled with a two-level logistic regression where the log odds of patient i
providing a positive answer to an item j is represented by:
Where βj represents the difficulty of item j and ui repre-sents the trait level associated with subject i. This equation holds true in the simplest IRT model known as Rasch or one-parameter logistic (1PL). Other models – two-param-eter logistic, ordinal logistic – among others – are used according to the types of response alternatives presented by each item.
Adding one additional parameter λto represent the extent
to which item j can discriminate between subjects of dif-ferent trait levels, we obtain:
Finally, if we add a predictor to this equation we will have
where γis the regression coefficient for predictor x. This model allows several advantages over the two models pre-viously described in this layer, including the absence of assumptions from summed scores as well as the summarization of all items into a single latent variable. The most frequent assumptions in IRT models are that a single construct is measured and that observations are independent, conditional on the latent variable. Different IRT models will have different assumptions about the extent to which assumptions of summed scores can be relaxed. For example, 1-Parameter. Logistic Regression models assume that each item measures the latent trait with equivalent strength.
One important practical aspect, when making use of IRT models with predictors, is to check quadrature point approximation used in the random-effects estimator. As a rule of thumb, if the coefficients do not change by more than a relative difference of 0.01%, then the choice of quadrature points does not significantly affect the
yi j ijx ci j
p
−β0+
∑
:−1:β +π − + e e x x β β 1
e prob positive answer given a certain disability level prob n
x
β − ( )
( eegative answer given a certain disability level)
log( π ) : :
π β β
1− − 0+
∑
j−1 j ij+ i px c
log( π ) ,
π β
ij
ij
j ui
1− − +
log( π )
π β λ
ij
ij j i j u
1− − +
log( π ) ,
π β λ γ
ij
ij j i j i
u x
outcome and the results may be confidently interpreted. Two aspects of random-effects models have the potential to make the quadrature approximation inaccurate: large group sizes and large correlations within groups [16].
Layer 5 – Analysis and reporting
Data analysis
To illustrate a practical application of the previously described models, we will use data from a cohort study of patients with low-back pain to evaluate the gender-disa-bility association. Specifically, we will evaluate whether female patients either have more severe disability or sim-ply whether they are more likely to give positive answers to some items while having equivalent physical disability levels.
Several studies have found that, compared to men, women are usually associated with higher initial disability and pain scores after low-back pain episodes [14,15]. However, it is usually unnoticed that these studies do not directly measure disability, a latent construct, but rather measure patients' responses to items that are hypothe-sized to measure disability. In other words, the hypothesis is that the instrument accurately measures the construct, although the instrument is rarely re-evaluated by the time of measurement. In support of this important caveat is that previous studies have found that women have differ-ent responses to the stress caused by low-back pain when compared to men [16]. Therefore, the question of whether women really present with higher disability levels, simply
have a different response to items measuring disability or both have higher disability and have a different response is open.
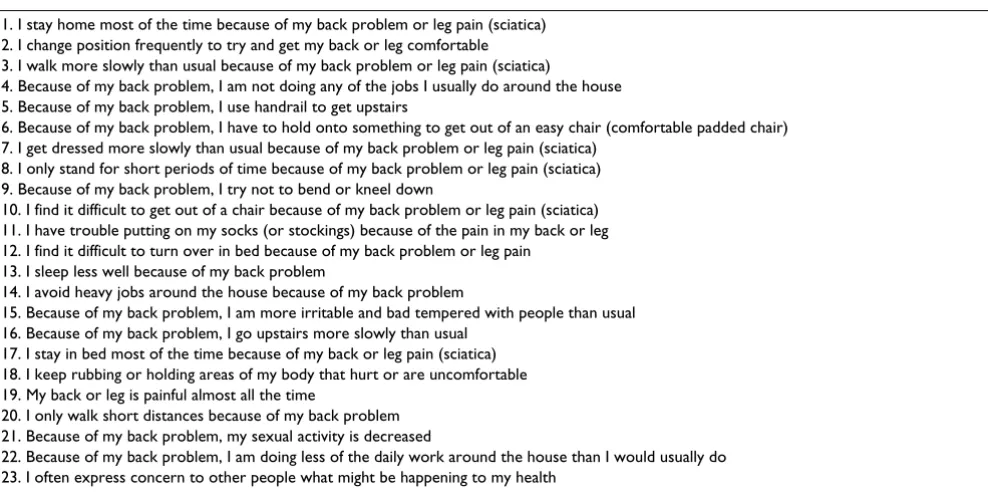
A description of the cohort used for this analysis is pre-sented in detail elsewhere [17]. Briefly, the cohort con-tains data on 1,633 patients with low-back pain answering 23 dichotomous items from the Roland Ques-tionnaire modified by Patrick [18,19]. The item content for this scale is presented in Table 1. The outcome of inter-est is physical disability represented by items of the mod-ified Roland Questionnaire, and the main effect is gender. The association between these variables is adjusted for several potential confounders, including marital status (married, other), presence of workman's compensation (yes/no), and presence of private insurance (yes/no). All analyses were performed using Stata 8.0 for Linux (Stata Corporation, College Station, TX). Because Item Response Theory model with predictors are very computer intensive and individual models may take over 24 hours to run in personal computers, a special arrangement of the operat-ing system was instituted to obtain maximal performance. These changes included establishing maximal priority (renice set to -20 to the Stata process, and running in a Linux "bigmem" kernel 4.20 with random allocation memory of 4 gigabytes). Additional measures to increase computational speed included data collapsing, frequency weights, and matrices with previous beta coefficients used as priors.
Table 1: Item content for the modified Roland Questionnaire
1. I stay home most of the time because of my back problem or leg pain (sciatica) 2. I change position frequently to try and get my back or leg comfortable 3. I walk more slowly than usual because of my back problem or leg pain (sciatica)
4. Because of my back problem, I am not doing any of the jobs I usually do around the house 5. Because of my back problem, I use handrail to get upstairs
6. Because of my back problem, I have to hold onto something to get out of an easy chair (comfortable padded chair) 7. I get dressed more slowly than usual because of my back problem or leg pain (sciatica)
8. I only stand for short periods of time because of my back problem or leg pain (sciatica) 9. Because of my back problem, I try not to bend or kneel down
10. I find it difficult to get out of a chair because of my back problem or leg pain (sciatica) 11. I have trouble putting on my socks (or stockings) because of the pain in my back or leg 12. I find it difficult to turn over in bed because of my back problem or leg pain
13. I sleep less well because of my back problem
14. I avoid heavy jobs around the house because of my back problem
15. Because of my back problem, I am more irritable and bad tempered with people than usual 16. Because of my back problem, I go upstairs more slowly than usual
17. I stay in bed most of the time because of my back or leg pain (sciatica) 18. I keep rubbing or holding areas of my body that hurt or are uncomfortable 19. My back or leg is painful almost all the time
20. I only walk short distances because of my back problem 21. Because of my back problem, my sexual activity is decreased
Data preparation
Briefly, our sample is composed by 1,633 individuals with a diagnosis of low-back pain. Most patients are females (52.3%), married (69.9%), white (83.0), and with medi-cal insurance (68.3%).
For linear and logistic regression models the data were placed in wide format, with individual variables repre-senting patient responses to each item. For IRT models the data were presented in long compressed format (Figure 2).
Prediction based on summed scores
When comparing the crude association between summed scores and gender, it was found that female patients had scores that were on average 1.46 (95% CI 0.73, 2.08) points higher than their male counterparts in a 0–23 scale. This association was further tested in a linear regression model (Figure 1a) controlling for gender, insurance status (including workman's compensation), marital status, and income. The full model demonstrated that, adjusted to potential confounders, women report on average 1.32 (95% CI 0.65, 2.00) more points in the modified Roland scale than men. After backwards deletion, none of the pre-vious potential confounders were proven to be substantial confounders using a cut point of 10% change the original point estimate.
Since the distribution of summed scores of the modified Roland Questionnaire was not normal, we used regres-sion diagnostics using plots to determine that the rela-tionship between predicted and observed values did not display any violations of the regression assumptions. This was confirmed by a Ramsey regression specification error test (RESET) for omitted variables (p = 0.7371) although the Breusch-Pagan / Cook-Weisberg test demonstrated a trend towards heteroscedacity (p = 0.0777).
In order to further verify the robustness of this associa-tion, an ordinal logistic regression model was used with cut-points at 0–7 (low summed score), 8–15 (medium summed score), and 16–23 (high summed score). This model was considered to adequately comply with the proportionality assumption (p = 0.776). Results for the ordinal regression model demonstrated that the predicted probability of a male having low, intermediate, and high scores were progressively decreasing: 0.38, 0.33, and 0.28, respectively. This pattern was in contrast with women, where the probabilities were ascending: 0.32, 0.33, and 0.35, respectively.
In summary, all results from models using summed scores point to a significant association between female gender and high disability scores. It is unclear; however, whether
this association can be explained by high disability levels or simply different report patterns between men and women.
Prediction based on responses to individual items
As a next step, the association between individual item responses and gender was evaluated using logistic regres-sion models stratified by propensity scores adjusting for responses to other items (Figure 1b). Propensity scores were determined by running logistic regression models that evaluated the probability of a positive response to an item adjusted for all remaining items and covariates except gender. These scores were then used to classify all
Sequence of Stata commands for the execution of the three sets of model
Figure 2
observations into five different propensity score percen-tiles. The distribution of each of the covariates was found to be balanced among all four groups, indicating that the propensity scores were effective in "randomizing" the groups (Alcouffe 1999).
The analysis across propensity strata demonstrated con-tradictory results, with male patients being significantly associated with positive responses to items 4 ("Because of my back problem, I am not doing any of the jobs I usually do around the house") and 8 ("I only stand for short peri-ods of time because of my back problem or leg pain (sci-atica)"), while female patients were significantly associated with positive responses on items 7 ("I get dressed more slowly than usual because of my back lem or leg pain (sciatica)"), 15 ("Because of my back prob-lem, I am more irritable and bad tempered with people than usual"), 17 ("I stay in bed most of the time because of my back or leg pain (sciatica)"), and 19 ("My back or leg is painful almost all the time"). No single item was consistently associated with gender across all propensity score strata.
A new model was then built adjusting for scores pooled across strata. The results demonstrated that most items were not associated with either gender, items 4 ("Because of my back problem, I am not doing any of the jobs I usu-ally do around the house") and 8 ("I only stand for short periods of time because of my back problem or leg pain (sciatica)") being positively associated with male gender while items 7 ("I get dressed more slowly than usual because of my back problem or leg pain (sciatica)") and 15 ("Because of my back problem, I am more irritable and bad tempered with people than usual") being associated with female gender (Figure 3).
Since logistic regression models do not control for the latent variable one cannot test whether the association between gender and individual item responses is related to an association with disability or simply caused by women being more likely to provide a positive response to a certain item in spite of having the same degree of disability.
Odds ratio of having a positive response to an item* Figure 3
Prediction based on latent variables
Finally, IRT models (Figure 1c) were used to determine the association between gender and IRT scores. First, a crude association between male and IRT scores was calcu-lated based on all 23 items. This model demonstrated that female gender continued to be significantly associated with higher disability (coefficient 0.34, log likelihood test
p < 0.001). Notice that this value is presented in a new scale that can no longer be compared to the previous scores obtained from the modified Roland scale with a range from 0 to 23.
To test the hypothesis that some items might present dif-ferent reporting patterns, we tested for interaction terms between each item and gender. Our results demonstrated that items 7 ("I get dressed more slowly than usual because of my back problem or leg pain (sciatica)", Figure 4a), 14 ("I avoid heavy jobs around the house because of my back problem", Figure 4b), and 17 ("I stay in bed most of the time because of my back or leg pain (sciatica)", Fig-ure 4c) presented significant interactions with gender. An interaction with gender indicates that the item response is affected by gender; thus, demonstrating different report-ing patterns. Although interpretations of item content are speculative, items 7 and 14 may indicate that male and female patients interpret these questions as a different type and level of activity, respectively, while item 17 may be associated with differential behaviors in relation to dis-ability across genders.
A new IRT model was then calculated, but now excluding all items with differential reporting patterns. The differ-ence in disability reporting between men and women was reduced (coefficient 0.04, log likelihood p = 0.08), indi-cating that gender was no longer significantly associated with disability. In fact, when the same items were excluded from the summed score, a multiple linear regres-sion model demonstrated that the difference between female and male patients had been reduced to 0.78 points (95% CI, -0.99, 1.23) on the original 0–23 scale (p = 0.06), a reduction of 53.4% compared to the original difference.
Bootstrapping methods were used in the linear regression model to verify whether the association was robust after multiple sampling procedures had been applied to the models. The results demonstrated a variation of only 13.2%; thus, indicating that these results are robust pro-vided that the sample is representative of the study population.
In conclusion, one could infer that although women still have slightly more disability than men, much of the pre-viously reported differences using the modified Roland were inflated by the presence of items with different reporting patterns in scales measuring disability.
Conclusions
We used three different regression models to investigate the association between gender and disability. Although summed models demonstrated a significant association between gender and disability, these models did not allow
Item characteristic curves for items demonstrating differen-tial item functioning
Figure 4
Publish with BioMed Central and every scientist can read your work free of charge "BioMed Central will be the most significant development for disseminating the results of biomedical researc h in our lifetime."
Sir Paul Nurse, Cancer Research UK
Your research papers will be:
available free of charge to the entire biomedical community
peer reviewed and published immediately upon acceptance
cited in PubMed and archived on PubMed Central
yours — you keep the copyright
Submit your manuscript here:
http://www.biomedcentral.com/info/publishing_adv.asp
BioMedcentral us to test whether this purported difference was related to
the latent construct disability or to items presenting with differential item functioning. Analysis of the association within individual items demonstrated inconsistent associ-ations with gender, with some items presenting a strong positive association with male gender while others had a positive association with female gender. Since these asso-ciations were made with the item response rather than the latent variable, it was impossible to verify whether these were valid representations of the construct of interest, associations with disability, or simply the effects of differ-ential item functioning. Last, we examined the association between gender and disability measured as a latent varia-ble. After removing items with differential item function-ing, the association with gender was lessened and no longer significant. Therefore, we concluded that although a small difference between genders in relation to the disa-bility associated with low back pain does exist, much of it is caused by differential item functioning than a true asso-ciation with the disability construct.
In summary, we advocate that the measurement of the association between latent variables and covariates be systematically performed using a combination of regres-sion models to ensure that observed associations are not distorted by differential item functioning.
Authors' contributions
RP: design, analysis, manuscript writing; MT: design, anal-ysis, manuscript revision; UG: design, analanal-ysis, manu-script revision; LDH: design, manumanu-script revision; DOJ: design, manuscript revision; TC: data collection, design, manuscript revision.
Acknowledgements
Sources of funding: partially funded by the Orthopaedic Trauma Association.
We would like to thank Mrs. Suzana S. M. Albano for editorial support.
References
1. Davis AM, Sennik S, Griffin AM, Wunder JS, O'Sullivan B, Catton CN, Bell RS: Predictors of functional outcomes following limb sal-vage surgery for lower-extremity soft tissue sarcoma.J Surg Oncol 2000, 73:206-211.
2. Enneking WF: American Orthopaedic Association. In Limb sal-vage in musculoskeletal oncology New York: Churchill Livingstone; 1987.
3. Enneking WF, Dunham W, Gebhardt MC, Malawar M, Pritchard DJ:
A system for the functional evaluation of reconstructive pro-cedures after surgical treatment of tumors of the muscu-loskeletal system.Clin Orthop 1993, 286:241-246.
4. Davis AM, Wright JG, Williams JI, Bombardier C, Griffin A, Bell RS:
Development of a measure of physical function for patients with bone and soft tissue sarcoma.Qual Life Res 1996, 5:508-516. 5. Ware JE Jr, Sherbourne CD: The MOS 36-item short-form health survey (SF-36). I. Conceptual framework and item selection.Med Care 1992, 30:473-483.
6. Bandeen-Roche K, Huang GH, Munoz B, Rubin GS: Determination of risk factor associations with questionnaire outcomes: a methods case study.Am J Epidemiol 1999, 150:1165-1178.
7. Mangione CM, Phillips RS, Seddon JM, Lawrence MG, Cook EF, Dailey R, Goldman L: Development of the 'Activities of Daily Vision Scale'. A measure of visual functional status.Med Care 1992,
30:1111-1126.
8. Teresi JA, Kleinman M, Ocepek-Welikson K: Modern psychomet-ric methods for detection of differential item functioning: application to cognitive assessment measures.Stat Med 2000,
19:1651-1683.
9. Peduzzi P, Concato J, Kemper E, Holford TR, Feinstein AR: A simu-lation study of the number of events per variable in logistic regression analysis.J Clin Epidemiol 1996, 49:1373-1379. 10. Freedman LS, Pee D: Return to note on screening regression
equations.Am Statistician 1989, 43:279-282.
11. Reise SP, Yu J: Parameter recovery in the graded response model using MULTILOG.Journal of Educational Measurement 1990,
27:133-144.
12. Rubin DB: Estimating causal effects from large data sets using propensity scores.Ann Intern Med 1997, 127:757-763.
13. Alcouffe J, Manillier P, Brehier M, Fabin C, Faupin F: Analysis by sex of low back pain among workers from small companies in the Paris area: severity and occupational consequences. Occup Environ Med 1999, 56:696-701.
14. Fillingim RB, Doleys DM, Edwards RR, Lowery D: Clinical charac-teristics of chronic back pain as a function of gender and oral opioid use.Spine 2003, 28:143-150.
15. Bolton JE: Psychological distress and disability in back pain patients: evidence of sex differences. J Psychosom Res 1994,
38:849-858.
16. Jensen I, Nygren A, Gamberale F, Goldie I, Westerholm P: Coping with long-term musculoskeletal pain and its consequences: is gender a factor?Pain 1994, 57:167-172.
17. Carey TS, Garrett J, Jackman A, McLaughlin C, Fryer J, Smucker DR:
The outcomes and costs of care for acute low back pain among patients seen by primary care practitioners, chiro-practors, and orthopedic surgeons. The North Carolina Back Pain Project.N Engl J Med 1995, 333:913-917.
18. Roland M, Morris R: A study of the natural history of back pain. Part I: development of a reliable and sensitive measure of disability in low-back pain.Spine 1983, 8:141-144.
19. Patrick DL, Deyo RA, Atlas SJ, Singer DE, Chapin A, Keller RB: