Open Access
Research article
Lung diffusing capacity for nitric oxide and carbon monoxide in
relation to morphological changes as assessed by computed
tomography in patients with cystic fibrosis
Holger Dressel*
1, Laura Filser
1, Rainald Fischer
2, Katharina Marten
3,
Ullrich Müller-Lisse
4, Dorothea de la Motte
1, Dennis Nowak
1,
Rudolf M Huber
2and Rudolf A Jörres
1Address: 1Institute and Outpatient Clinic for Occupational, Social and Environmental Medicine, Ludwig-Maximilians-University, Ziemssenstr. 1, D-80336 München, Germany, 2Department of Pneumology, Medizinische Klinik Innenstadt, Ludwig-Maximilians-University, Munich, Germany, 3Department of Diagnostic Radiology, University of Göttingen, Göttingen, Germany and 4Institute for Clinical Radiology, Medizinische Klinik Innenstadt, Ludwig-Maximilians-University, Munich, Germany
Email: Holger Dressel* - [email protected]; Laura Filser - [email protected];
Rainald Fischer - [email protected]; Katharina Marten - [email protected]; Ullrich Müller-Lisse - Ullrich.Mueller-Mü[email protected]; Dorothea de la Motte - [email protected]; Dennis Nowak - [email protected]; Rudolf M Huber - [email protected];
Rudolf A Jörres - [email protected] * Corresponding author
Abstract
Background: Due to large-scale destruction, changes in membrane diffusion (Dm) may occur in cystic fibrosis (CF), in correspondence to alterations observed by computed tomography (CT). Dm can be easily quantified via the diffusing capacity for nitric oxide (DLNO), as opposed to the conventional diffusing capacity for carbon monoxide (DLCO). We thus studied the relationship
between DLNO as well as DLCO and a CF-specific CT score in patients with stable CF.
Methods: Simultaneous single-breath determinations of DLNO and DLCO were performed in 21 CF patients (mean ± SD age 35 ± 9 y, FEV1 66 ± 28%pred). Patients also underwent spirometry and bodyplethysmography. CT scans were evaluated via the Brody score and rank correlations (rS) with
z-scores of functional measures were computed.
Results: CT scores correlated best with DLNO (rS = -0.83; p < 0.001). Scores were also related to the volume-specific NO transfer coefficient (KNO; rS = -0.63; p < 0.01) and to DLCO (rS = -0.79; p < 0.001) but not KCO. Z-scores for DLNO were significantly lower than for DLCO (p < 0.001).
Correlations with spirometric (e.g., FEV1, IVC) or bodyplethysmographic (e.g., SRaw, RV/TLC) indices were weaker than for DLNO or DLCO but most of them were also significant (p < 0.05 each).
Conclusion: In this cross sectional study in patients with CF, DLNO and DLCO reflected CT-morphological alterations of the lung better than other measures. Thus the combined diffusing capacity for NO and CO may play a future role for the non-invasive, functional assessment of structural alterations of the lung in CF.
Published: 16 June 2009
BMC Pulmonary Medicine 2009, 9:30 doi:10.1186/1471-2466-9-30
Received: 2 June 2008 Accepted: 16 June 2009
This article is available from: http://www.biomedcentral.com/1471-2466/9/30
© 2009 Dressel et al; licensee BioMed Central Ltd.
Page 2 of 7
Background
Cystic fibrosis (CF) is characterized by the combined find-ings of bronchiectasis and parenchymal fibrosis, which may affect lung diffusing capacity. However, the results of studies focussing on the diffusing capacity for carbon monoxide (DLCO) in CF are largely contradictory, as a spectrum of elevated, decreased, or normal values has been reported [1,2]. Recent data in children and adults suggest a slightly elevated DLCO in early CF and a reduc-tion only in advanced disease [3-5]. Based on these find-ings, DLCO currently appears to play no role in CF assessment compared to spirometry or computed tomog-raphy (CT) [6].
The diffusing capacity for nitric oxide (DLNO) can be used
to directly describe pulmonary membrane diffusing capacity (Dm), without interfering with pulmonary capil-lary blood volume (Vc). Diffusion properties of NO are similar to those of CO; however, its rate of reaction with red blood cells is much greater [7]. DLNO primarily reflects
Dm, whereas DLCO depends on both Dm and Vc [7]. In combination with DLCO, Vc and Dm can be determined in a single maneuver, based on the equation for the serial connection of resistances [8,9].
Thus, DLNO might be superior to DLCO for quantification of structural changes by purely functional means when morphological changes of gas transport compartments instead of changes in pulmonary blood volume are con-sidered. The method of choice for the assessment of mor-phological changes in CF is thin-section CT [10], which also represents the gold standard for the diagnosis of bronchiectasis [11]. Quantification of disease extent in patients with CF can be achieved using dedicated scoring systems focussing on different parameters, e.g. bron-chiectasis, mucous plugging or bronchial wall thickening [12]. Specifically, the CT scoring system developed by Brody et al. has been shown to be a robust and reproduc-ible tool for the semiquantitative assessment of parenchy-mal and airway disease in CF patients [13].
The aim of our study was to correlate DLNO, DLCO and other pulmonary function analyses with the extent of dis-ease on CT in order to further investigate the hypothesis that DLNO as a measure of Dm may accurately reflect mor-phological changes in patients with CF.
Methods
Study subjectsAdult patients with CF (n = 21) in whom thin-section CTs of the lungs were available were recruited from the Cystic Fibrosis Outpatient Unit during routine follow-up visits. Patients with a smoking history or with an interval of more than 3 years between CT scans and pulmonary func-tion tests (PFT) were excluded from the study. During the
time between the CT and the PFT the clinical status of the patients had been regularly monitored by specialists from the Cystic Fibrosis Outpatient unit, usually with 3 months intervals between visits. Patients were excluded if severe exacerbations were present when CT scans or PFTs were performed. They were also excluded if severe exacerba-tions were recorded during the time interval between CT and PFT. Any exacerbation resulting in one or more days of hospitalisation was defined as severe. The study was approved by the local Ethics Committee and all partici-pants gave their written informed consent.
Measurements
Simultaneous single-breath determinations of DLCO, DLNO and alveolar volume (VA), were performed with a Master-screen PFT (Viasys/Jaeger, Höchberg, Germany) which uses electrochemical sensors at an inspiratory target concentra-tion of 45 (± 5) ppm NO and a breath-hold time of 8 s [14]. Patients were seated in upright position, wearing a nose clip. The final inspiratory gas (21% O2) was mixed from a
gas containing 448 ppm NO in N2 (Linde, Unterschleiβ heim, Germany), a mixture of 0.28% CO and 9.5% He in synthetic air (Viasys), and 100% oxygen and analyzed immediately before inhalation. Maneuvers were performed as described previously [8] and the device was calibrated at least daily. Hb was measured in the patients and DLCO was corrected to the standard Hb according to international guidelines [8]. All measurements were performed threefold with an interval of approx. 4 min, and mean values were recorded. Values relative to volume (KNO, KCO) were obtained by dividing DLNO and DLCO through the
corre-sponding VA. VA, DLNO and DLCO %predicted were calcu-lated using published reference formulae [15-19]. Using a standard approach Dm was expressed as DLNO divided by 1.97 [18], and Vc was derived as previously described [9].
Spirometry and bodyplethysmography were performed using a pneumotachograph-based device (MasterLab™, Viasys) following established guidelines [20]. At least three technically acceptable flow-volume curves were obtained and the highest values of forced expiratory vol-ume in 1 second (FEV1) and inspiratory vital capacity (IVC) were recorded. Airway resistance (RAW), specific air-way resistance (SRAW), intrathoracic gas volume (ITGV),
total lung capacity (TLC) and residual volume (RV) were also obtained.
CT examinations and scoring
Unenhanced low-dose CT examinations were performed on a clinical whole-body multidetector-row CT scanner (Mx 8000, Philips Medical Systems, Best, The Nether-lands), with the patient in supine position, at 120 kV, 4 × 1 mm slice collimation, 3 mm reconstruction slice thickness, 10 mAs/slice (effective tube current-time product), and Pitch 1.75, resulting in an effective dose of approximately 0.5 mSv. Multiplanar image reformatting was performed in all instances, such that axial, coronal, and sagittal CT images were available for review on a pic-ture archiving and communication system (PACS, "Impax", AGFA, Munich, Germany). CT images were evaluated by two independent experienced chest radiol-ogists blinded to clinical or functional information, using a validated scoring system [13]. The order in which CTs were scored was not randomized. In detail, scores for the presence and severity of parenchymal findings and airway disease were calculated of each lobe, with the lingula counted as a separate lobe. The following sub-scores were obtained by averaging subsub-scores across the 6 lobes in each patient: bronchiectasis, mucous plugging, peribronchial thickening, and parenchymal disease. As expiratory scans were not available, the air trapping sub-score was omitted. The scoring system has been described in detail by Brody at al. [13]. In brief, the sub-score for bronchiectasis (possible range: 0–12) was defined as the sum of the extent of bronchiectasis in the central lung (0–3) and in the peripheral lung (0–3), multiplied by the average bronchiectasis size (0–2). For the mucous plugging score (0–6) the extent of mucous plugging in the central lung (0–3) was added to the extent of mucous plugging in the peripheral lung (0–3). For the peribronchial thickening score (0–9) the sum of the extent of peribronchial thickening in the central lung (0–3) and the extent of peribronchial thickening in the peripheral lung (0–3) was multiplied by the severity of peribronchial thickening (1–1.5). The parenchyma score (0–9) was the sum of the extent of dense parenchymal opacity (0–3), the extent of ground glass opacity (0–3) and the extent of cysts or bullae (0–3). Subscores were added to obtain the total score, ranging between 0 and 36. The mean scores of both observers were used for analysis.
Statistical analysis
Median with range or mean values and standard devia-tions (SD) were computed. Z-scores were additionally calculated where appropriate using published equations [15-17,21]. The relationship between functional meas-ures and CT scores was quantified by Spearman's rank correlation (rS). Statistical comparisons were performed using the Wilcoxon test. Statistical significance was assumed for p < 0.05. To adjust the alpha level for mul-tiple tests for correlation the Bonferroni method was used. All analyses were performed using SPSS 14.0 (SPSS Inc., Chicago, IL).
Results
Patient demographics and results of pulmonary function tests are displayed in table 1. Using standard reference equations [16], mean ± SD DLCO was 83 ± 18 %pred and the respective z-score ± SD was -1.3 ± 1.4. According to 3 recently published reference value equations using gen-der, age, and height as predictors, respective mean DLNO
%pred and DLCO %pred for the patient group were: 71 ± 19 and 82 ± 17 %pred [17]; 60 ± 17 and 75 ± 16 %pred [18]; 63 ± 18 and 86 ± 19 %pred [19]. DLNO %pred was always lower than DLCO %pred (p < 0.001 each). Z-scores for DLNO, that could be calcuated from [17] were -2.3 ±
1.5. When comparing DLNO and DLCO expressed as z-scores according to references [16,17], DLNO was signifi-cantly lower than DLCO (p < 0.001). 13 subjects (62%)
had a z-score < -1.96, i.e. below the 2.5th centile
concern-ing DLNO compared to only 8 subjects (38%) concerning DLCO.
The median (range) total CT score in our sample was 10.7 (3.4–26.5). The corresponding subscore values were 3.9 (0.8–11.2) for bronchiectasis, 1.8 (0.6–4.5) for mucous plugging, 4.0 (0.8–8.7) for peribronchial thickening, and 1.3 (0.4–4.0) for the parenchyma subscore. The total CT scores correlated closely between the two observers, as indicated by the high intraclass correlation (ANOVA, R = 0.91), as well as the rank correlation coefficient (rS = 0.897; p < 0.001) and pairwise comparison according to Wilcoxon (p = 0.465). Subscores also significantly corre-lated between both observers (p < 0.001 each), despite differences in bronchiectasis and parenchyma subscores (Wilcoxon, p < 0.01 each).
Correlation coefficients between total CT scores and func-tional measures are given in Table 2. Both DLNO and DLCO, expressed as z-scores were related to the overall CT score (p < 0.001 each; Figure 1, Panel A and B). Moreover, KNO was correlated with the CT score (p = 0.002), as opposed to KCO (Figure 2, Panel A and B). Similar results as for the total score were obtained for the subscores. DLNO, DLCO, Dm and Vc showed the closest correlations with bronchiectasis, mucous plugging and peribronchial thickening. With regard to KNO, the correlation was clos-est for peribronchial thickening, whereas KCO was not related to any of the subscores. The correlations between CT scores and indices of spirometry and bodyplethysmog-raphy were generally weaker than with DLNO and DLCO.
Page 4 of 7
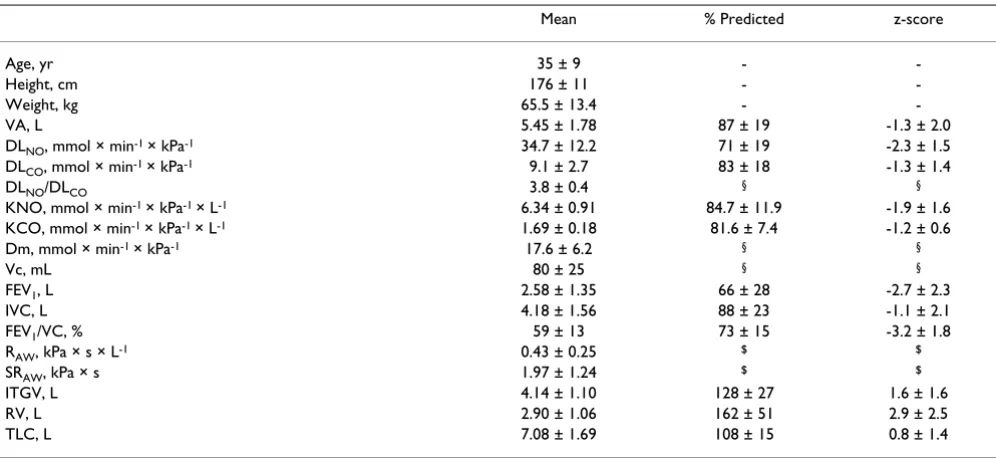
Table 1: Basic characteristics and pulmonary function tests of 21 patients (females = 8; males = 13) with CF
Mean % Predicted z-score
Age, yr 35 ± 9 -
-Height, cm 176 ± 11 -
-Weight, kg 65.5 ± 13.4 -
-VA, L 5.45 ± 1.78 87 ± 19 -1.3 ± 2.0
DLNO, mmol × min-1 × kPa-1 34.7 ± 12.2 71 ± 19 -2.3 ± 1.5
DLCO, mmol × min-1 × kPa-1 9.1 ± 2.7 83 ± 18 -1.3 ± 1.4
DLNO/DLCO 3.8 ± 0.4 § §
KNO, mmol × min-1 × kPa-1 × L-1 6.34 ± 0.91 84.7 ± 11.9 -1.9 ± 1.6
KCO, mmol × min-1 × kPa-1 × L-1 1.69 ± 0.18 81.6 ± 7.4 -1.2 ± 0.6
Dm, mmol × min-1 × kPa-1 17.6 ± 6.2 § §
Vc, mL 80 ± 25 § §
FEV1, L 2.58 ± 1.35 66 ± 28 -2.7 ± 2.3
IVC, L 4.18 ± 1.56 88 ± 23 -1.1 ± 2.1
FEV1/VC, % 59 ± 13 73 ± 15 -3.2 ± 1.8
RAW, kPa × s × L-1 0.43 ± 0.25 $ $
SRAW, kPa × s 1.97 ± 1.24 $ $
ITGV, L 4.14 ± 1.10 128 ± 27 1.6 ± 1.6
RV, L 2.90 ± 1.06 162 ± 51 2.9 ± 2.5
TLC, L 7.08 ± 1.69 108 ± 15 0.8 ± 1.4
§Not computed due to lack of sufficient and standardised data
$ Not computed, as reference equations are not commonly used for interpretation
Data are presented as mean ± SD. Abbreviations: VA = alveolar volume, DLNO = lung diffusing capacity for nitric oxide, DLCO = lung diffusing
capacity for carbon monoxide, KNO = nitric oxide transfer coefficient, KCO = carbon monoxide transfer coefficient, Dm = membrane diffusing capacity, Vc = pulmonary capillary blood volume, FEV1 = forced expiratory volume in 1 s, VC = maximal inspired vital capacity, RAW = airway resistance, SRAW = specific airway resistance, ITGV = intrathoracic gas volume, RV = residual volume, TLC = total lung capacity. Prediction equations for VA according to [15], for DLCO/KCO according to [16], for DLNO/KNO according to [17], and for lung volumes according to [21].
Scatterplots for z-scores of DLNO (Panel A, rS = -0.83; p < 0.001), and DLCO (panel B, rS = -0.79; p < 0.001) against total CT
score
Figure 1
Scatterplots for z-scores of DLNO (Panel A, rS = -0.83; p < 0.001), and DLCO (panel B, rS = -0.79; p < 0.001) against total CT score.
Discussion
We found that in patients with CF, the correlation between DLNO as well as DLCO and CT was closer than for indices derived from spirometry and bodyplethysmogra-phy, including the standard measure for monitoring CF, FEV1. Additionally, using recently published reference val-ues [17-19], DLNO %pred was significantly lower than DLCO %pred in CF.
At present, spirometry is the established standard in the assessment of patients with CF, while the role of DLCO is less well defined. This may be partially explained by the fact that diffusion measurements are influenced by a vari-ety of functional or structural alterations in CF, e.g. the obstruction typically found in those patients, and thus
dif-ficult to interpret. In children with CF, DLCO has been shown to be stable despite a decline in FEV1 %pred [4], and in adults DLCO was found to decrease below reference values only in patients with severe disease [3]. Based on these and other conflicting results [2,22] it seems unlikely that DLCO is a useful marker of disease severity in CF.
In part, these differences may be due to the fact that DLCO
essentially comprises two factors: the membrane (Dm) and the blood component (Vc). Changes of these two compo-nents do not necessarily correlate. In contrast to DLCO, DLNO is thought to mainly represent Dm, thus possibly bet-ter reflecting morphological albet-terations in CF. In our study sample values of DLNO%pred were regularly significantly lower than those for DLCO, using different reference
equa-Scatterplots for z-scores of KNO (Panel A, rS = -0.63; p = 0.002) and KCO (Panel B, rS = 0.01; n.s.) against total CT score
Figure 2
Scatterplots for z-scores of KNO (Panel A, rS = -0.63; p = 0.002) and KCO (Panel B, rS = 0.01; n.s.) against total CT score.
A
B
Table 2: Spearman rank coefficients between CT scores according to Brody et al. [13] and z-scores of lung function measures as obtained in bivariate analyses.
Bronchiectasis Mucous plugging Peribronchial thickening Parenchyma Overall CT Score
DLNO/Dm -0.78*** -0.73*** -0.79*** -0.60** -0.83***
DLCO -0.75*** -0.73*** -0.76*** -0.59** -0.79***
KNO -0.53* -0.56** -0.62** -0.40 -0.63**
KCO 0.10 0.02 0.03 0.23 0.01
Vc, mL§ -0.64** -0.58** -0.59** -0.50* -0.63**
IVC -0.50* -0.51* -0.54* -0.50* -0.55*
FEV1 -0.56** -0.53* -0.59** -0.43 -0.59**
SRAW, kPa × s$ 0.69*** 0.61** 0.71*** 0.61** 0.72***
RV 0.47* 0.43* 0.50* 0.35 0.51*
RV/TLC, %§ 0.64** 0.58** 0.65** 0.51* 0.66**
§No z-scores used due to lack of sufficient and standardised data
$ No z-scores used, as reference equations are not commonly used for interpretation
Page 6 of 7
tions [16-19]. This indicates that DLNO might be more sen-sitive for detecting CF-related structural changes of the lung. As different approaches were used to derive Dm and Vc by the authors of the recently published reference equa-tions we did not compare our derived values with these ref-erences; further standardization of calculations seems desirable. In this study Dm was calculated as DLNO/1.97,
whereas recently published data indicates that DLNO/2.42 may be more accurate [19]. This however does not change correlations. Dm was more closely related with the CT score than Vc. As DLCO consists of Dm and Vc, the strong correla-tion with the CT score may be explained mainly by changes in Dm. The lower sensitivity to detect CF related changes expressed as percent of predicted values for DLCO compared to DLNO may be due to the additional influence of the
pul-monary capillary blood volume, which is thought to be negligible when measuring DLNO. As DLNO is thought to be influenced by parenchymal alterations it may complement the standard parameter measuring obstruction, FEV1. CT is the standard measurement for structural alterations in CF, usually performed in intervals of several years. As the meas-urement of DLNO is non-invasive, easy to perform and closely correlated with the CT score, it may be applied more often during those routine visits when no CT scans are per-formed. However, prospective longitudinal studies are needed to decide whether the measurement of DLNO may provide additional value to the existing standard monitor-ing parameters.
As the reduction in diffusion capacities might be caused by a reduction in alveolar volume, which was also corre-lated with the CT score, we additionally assessed their val-ues relative to alveolar volume. KCO was not related to the CT score or its subscores, while KNO decreased with increasing CT scores (figure 2), being specifically related to bronchiectasis, mucus plugging and peribronchial thickening. With decreasing VA, healthy subjects are known to show an increase in KCO indicating an increase in the thickness of the pulmonary capillary blood sheet [23], while KNO is essentially stable, reflecting the diffu-sional properties of the lung [17]. Thus, both KCO and KNO reflect different aspects of lung morphology and functionality. In CF, VA and/or TLC may be reduced. This renders KNO, being less related to VA than KCO, superior for a noninvasive assessment of membrane diffusion, indicating structural alterations independent of volume-dependent effects. Our data strongly support this hypoth-esis. Zavorsky et al. recently published reference equations for DLNO using gender and age as well as either VA or height as predictors [19] to discern between patients with abnormal gas exchange or low lung volume. When using the equation including VA with our data mean ± SD pre-dicted DLNO was 71 ± 13%, indicating abnormal gas exchange. The equation including height instead of VA resulted in a significantly lower predicted DLNO of 63 ±
18% (p < 0.001). According to these authors this means
that a reduction in lung volume explains part of the low predicted DLNO. This is in line with the finding of a slightly reduced mean VA when expressed as percent of predicted. DLNO and DLCO also showed stronger correla-tions with the CT score than measures derived from spirometry and bodyplethysmography. It should be noted that a number of correlation coefficients were rather high, leading to only minor differences. Correlation coefficients were comparable or slightly lower when using absolute values instead of z-score values for DLNO and DLCO, prob-ably reflecting the fact that lung function indices depend on anthropometric characteristics, in contrast to CT scores.
Among the subscores, the bronchiectasis score correlated best with most functional measures, similar to the total score. Indeed, bronchiectasis seems to be the most impor-tant structural change that can be reliably scored on CT [11]. It has even been suggested that restricting scoring to bronchiectasis would suffice for CT monitoring in CF [6]. It should be noted that most subscores reflect airway dis-ease, whereas DLNO and KNO are influenced mainly by parenchymal destruction. Thus our findings show a good correlation between a CT score as a marker of disease severity and DLNO as a marker of parenchyma destruction. However, a causal connection between single subscores and the changes in diffusing capacities cannot be derived.
Thin-section CT represents the methodology of choice for the assessment of structural alterations in CF [10]. For this purpose, a variety of disease-specific CT scores have been proposed [12] and it seems that further standardization of scores is mandatory. The CT scoring system used in our study has been demonstrated to be reproducible and sen-sitive to disease severity [13]. CT scores are known to be subject to considerable interobserver variability, and the observation that for selected subscores the two experi-enced observers differed in their rating is in line with pub-lished data [12]. In our study the differences concerned only the magnitude, while ratings were still correlated with each other.
Major weaknesses of this study are its retrospective nature and the time interval between scan and measurements of up to 3 years with a maximum interval of 1 year in 15 patients. Moreover, the order in which CTs were scored was not randomized. This short-coming may introduce additional bias concerning the CT scores.
time interval of 3 years did not exert a major influence on our results. Furthermore, only patients with a fairly stable course of their disease were included in our study. It is, however, reasonable to expect even higher correlations with CT scores if these are performed at the same visit as the functional assessments.
Conclusion
In conclusion, our findings indicated that in patients with CF NO diffusing capacity was a functional measure that was suitable to quantify structural changes of the lung as assessed by CT scores. The suitability of NO diffusing capacity is in line with previous observations in healthy subjects or patients with other diseases than CF [25] and renders it a challenging question of whether the com-bined diffusing capacity for NO and CO has a potential to be included in the assessment of CF. In this respect, the conclusions of this retrospective cross-sectional study can only be limited. Future longitudinal studies have to decide over the potential of this method for the monitor-ing of CF patients.
Competing interests
The authors declare that they have no competing interests.
Authors' contributions
HD performed analyses and wrote the initial draft of the paper. LF, RF, and DM participated in study design, data collection and interpretation. KM and UM assessed and scored CT scans and drafted parts of the paper. DN and RMH enabled the realisation of the study and participated in data interpretation and drafting the manuscript. RAJ par-ticipated in and supervised study design, writing and anal-ysis. All authors read and approved the final manuscript.
Acknowledgements
The data represent part of the medical doctoral thesis of L. Filser.
References
1. Keens TG, Mansell A, Krastins IR, Levison H, Bryan AC, Hyland RH, Zamel N: Evaluation of the single-breath diffusing capacity in asthma and cystic fibrosis. Chest 1979, 76(1):41-44.
2. Russell NJ, Bagg LR, Hughes DT, Neville E: Lung function in young adults with cystic fibrosis. Br J Dis Chest 1982, 76(1):35-43. 3. Espiritu JD, Ruppel G, Shrestha Y, Kleinhenz ME: The diffusing
capacity in adult cystic fibrosis. Respir Med 2003, 97(6):606-611. 4. Merkus PJ, Govaere ES, Hop WH, Stam H, Tiddens HA, de Jongste JC: Preserved diffusion capacity in children with cystic fibro-sis. Pediatr Pulmonol 2004, 37(1):56-60.
5. Chemery L, Fekete K, Guillot S, Roussey M, Desrues B, Dabadie A, Belleguic C, Deneuville E, Dassonville J: Diffusing capacity for car-bon monoxide (T(LCO)) and oxygen saturation during exer-cise in patients with cystic fibrosis. Arch Pediatr 2004,
11(9):1060-1066.
6. de Jong PA, Lindblad A, Rubin L, Hop WC, de Jongste JC, Brink M, Tiddens HA: Progression of lung disease on computed tomog-raphy and pulmonary function tests in children and adults with cystic fibrosis. Thorax 2006, 61(1):80-85.
7. Borland CD, Higenbottam TW: A simultaneous single breath measurement of pulmonary diffusing capacity with nitric oxide and carbon monoxide. Eur Respir J 1989, 2(1):56-63.
8. MacIntyre N, Crapo RO, Viegi G, Johnson DC, Grinten CPM van der, Brusasco V, Burgos F, Casaburi R, Coates A, Enright P, Gustafsson P, Hankinson J, Jensen R, McKay R, Miller MR, Navajas D, Pedersen OF, Pellegrino R, Wanger J: Standardisation of the single-breath determination of carbon monoxide uptake in the lung. Eur Respir J 2005, 26(4):720-735.
9. Guenard H, Varene N, Vaida P: Determination of lung capillary blood volume and membrane diffusing capacity in man by the measurements of NO and CO transfer. Respir Physiol 1987,
70(1):113-120.
10. Rosenfeld M: An overview of endpoints for cystic fibrosis clin-ical trials: one size does not fit all. Proc Am Thorac Soc 2007,
4(4):299-301.
11. Tiddens HA, de Jong PA: Imaging and clinical trials in cystic fibrosis. Proc Am Thorac Soc 2007, 4(4):343-346.
12. de Jong PA, Tiddens HA: Cystic fibrosis specific computed tom-ography scoring. Proc Am Thorac Soc 2007, 4(4):338-342. 13. Brody AS, Kosorok MR, Li Z, Broderick LS, Foster JL, Laxova A,
Bandla H, Farrell PM: Reproducibility of a scoring system for computed tomography scanning in cystic fibrosis. J Thorac Imaging 2006, 21(1):14-21.
14. Dressel H, Filser L, Fischer R, de la Motte D, Steinhaeusser W, Huber RM, Nowak D, Jörres RA: Lung diffusing capacity for nitric oxide and carbon monoxide: Dependence on breath-hold time. Chest 2008, 133(5):1149-1154.
15. Frans A, Nemery B, Veriter C, Lacquet L, Francis C: Effect of alve-olar volume on the interpretation of single breath DLCO.
Respir Med 1997, 91(5):263-273.
16. Cotes JE, Chinn DJ, Quanjer PH, Roca J, Yernault JC: Standardiza-tion of the measurement of transfer factor (diffusing capac-ity). Report Working Party Standardization of Lung Function Tests, European Community for Steel and Coal. Official Statement of the European Respiratory Society. Eur Respir J Suppl 1993, 16:41-52.
17. Lee I van der, Zanen P, Stigter N, Bosch JM van den, Lammers JJ: Dif-fusing capacity for nitric oxide: reference values and depend-ence on alveolar volume. Respir Med 2007, 101(7):1579-1584. 18. Aguilaniu B, Maitre J, Glenet S, Gegout-Petit A, Guenard H:
Euro-pean reference equations for CO and NO lung transfer. Eur Respir J 2008, 31:1091-1097.
19. Zavorsky GS, Cao J, Murias JM: Reference values of pulmonary diffusing capacity for nitric oxide in an adult population. Nitric Oxide 2008, 18:70-79.
20. Miller MR, Hankinson J, Brusasco V, Burgos F, Casaburi R, Coates A, Crapo R, Enright P, Grinten CP van der, Gustafsson P, Jensen R, John-son DC, MacIntyre N, McKay R, Navajas D, Pedersen OF, Pellegrino R, Viegi G, Wanger J: Standardisation of spirometry. Eur Respir J
2005, 26(2):319-338.
21. Quanjer PH, Tammeling GJ, Cotes JE, Pedersen OF, Peslin R, Yernault JC: Lung volumes and forced ventilatory flows. Report Work-ing Party Standardization of Lung Function Tests, European Community for Steel and Coal. Official Statement of the European Respiratory Society. Eur Respir J Suppl 1993, 16:5-40. 22. Cotton DJ, Graham BL, Mink JT, Habbick BF: Reduction of the sin-gle breath CO diffusing capacity in cystic fibrosis. Chest 1985,
87(2):217-222.
23. Glénet SN, De Bisschop C, Vargas F, Guénard HJP: Deciphering the nitric oxide to carbon monoxide lung transfer ratio: physio-logical implications. J Physiol 2007, 582(2):767-775.
24. Judge EP, Dodd JD, Masterson JB, Gallagher CG: Pulmonary abnor-malities on high-resolution CT demonstrate more rapid decline than FEV1 in adults with cystic fibrosis. Chest 2006,
130(5):1424-1432.
25. Lee I van der, Zanen P, Grutters JC, Snijder RJ, Bosch JM van den: Dif-fusing capacity for nitric oxide and carbon monoxide in patients with diffuse parenchymal lung disease and pulmo-nary arterial hypertension. Chest 2006, 129(2):378-383.
Pre-publication history
The pre-publication history for this paper can be accessed here:
![Table 2: Spearman rank coefficients between CT scores according to Brody et al. [13] and z-scores of lung function measures as obtained in bivariate analyses.](https://thumb-us.123doks.com/thumbv2/123dok_us/519254.1546398/5.612.60.546.91.284/spearman-coefficients-according-function-measures-obtained-bivariate-analyses.webp)