R E S E A R C H A R T I C L E
Open Access
Prevalence of malnutrition and associated
factors among hospitalized elderly patients
in King Abdulaziz University Hospital,
Jeddah, Saudi Arabia
Sami H. Alzahrani
*and Sultan H. Alamri
Abstract
Background:Malnutrition is a nutritional disorder that adversely affects the body from a functional or clinical perspective. It is very often observed in the elderly population. This study aimed to estimate the prevalence of malnutrition among hospitalized elderly patients and its associated factors and outcomes in terms of length of stay and mortality in King Abdulaziz University Hospital, Jeddah, Saudi Arabia.
Methods:In a cross-sectional study, we evaluated the nutritional status of hospitalized elderly patients using the most recent version of the short form of Mini Nutritional Assessment (MNA-SF).
Results:A total of 248 hospitalized patients were included (70.0 ± 7.7 years; 60% female). According to the MNA-SF, a total of 76.6% patients were either malnourished or at risk of malnutrition. Malnourished patients had significantly lower levels of serum albumin (28.2 ± 7.7), hemoglobin (10.5 ± 1.8), and lymphocyte (1.7 ± 0.91). They had increased tendency to stay in the hospital for longer durations (IQR, 5-11 days; median = 7 days) and had a mortality rate of 6.9%.
Conclusion:Malnutrition was highly prevalent among hospitalized elderly and was associated with increased length of stay and mortality.
Keywords:Malnutrition, Geriatric, Elderly, Hospitalized, Health services
Background
Malnutrition is a nutritional disorder that adversely affects the body from a functional or clinical perspective [1]. It is very often observed in the elderly population. A retrospective pooled analysis of elderly people from 12 countries reported that the overall prevalence of malnu-trition was approximately 23%. The highest prevalence was observed in rehabilitation settings (50.5%), followed by hospitals (38.7%), nursing homes (13.8%), and com-munities (5.8%) [2].
Malnutrition is associated with several adverse health outcomes in the elderly, including increased morbidity and mortality, prolonged hospital stays [3], functional impairment [4], poor quality of life [5], increased
infections, electrolyte imbalances, anemia, muscle wast-ing, and fatigue [6, 7]. There is also an association between falls and undernourishment in elderly people who are either hospitalized or living in long-term care facilities [8]. Despite these consequences, several reports have shown that malnutrition remains under-recognized in the hospitalized elderly, where is no standard proced-ure is available for proper documentation due to insuffi-cient awareness among healthcare professionals [9]. Therefore, an early identification of malnutrition, as well as nutritional intervention, is of considerable importance in helping to delay or prevent associated poor outcomes, [10] This indicates the need of activation/establishing services dedicated to assess the nutritional status of elderly people. In this respect, several screening tools have been developed to identify malnutrition [10]. The Mini Nutritional Assessment (MNA) is an 18-point * Correspondence:drsamihz@gmail.com
Family and Community Medicine Department, Faculty of Medicine, King Abdulaziz University, PO Box 80205, Jeddah 21589, Saudi Arabia
nutritional screening tool that has gained worldwide ac-ceptance, relying on anthropometrical, medical, lifestyle, dietary, and psychosocial factors [11]. It was designed specifically for use among the elderly population and has been validated in many care settings, including commu-nities, hospitals, and nursing homes [12]. A short form of MNA (MNA-SF) has been developed as a time-saving nutritional screening tool that is easy to use in routine practice with comparable diagnostic accuracy to the full MNA [13]. The most recent version of MNA-SF pro-vides a quick nutritional screening with the option of using calf circumference when BMI is unavailable [14].
The objectives of this study were 1) to estimate the prevalence of malnutrition among elderly population ad-mitted to King Abdulaziz University Hospital (KAUH) in Jeddah, Saudi Arabia using the revised version of Mini Nutritional Assessment (MNA-SF) and 2) to assess relationships between their nutritional status, socio-demographic data, mortality and length of stay (LOS).
Methods
Setting and sample
In a cross-sectional study, we used the most recent version of the short form of Mini Nutritional Assess-ment (MNA-SF) to evaluated the nutritional status of hospitalized elderly patients, it was carried out at King Abdulaziz University Hospital in Jeddah, Saudi Arabia. A tow repeated annual cross-sectional surveys (pseudo-longitudinal study) was carried out to estimate the length of stay, readmission and mortality rates. The sam-ple size was calculated by using the single proportion equation in the Raosoft software package. Considering the frequency of having sufficient knowledge as 50%, ac-cepted margin of error was 5% and the confidence level was 95%. The estimated sample size was 184, it was in-creased to 248 to compensate for non-responders.
During the month of February 2015, a total of 248 consecutive elderly patients (over 60 years of age) were evaluated by a single investigator within the first 48 h of admission, all patients with limb amputation, with terminal cancer, re-admitted within the study period, suffering from any abnormality that will interfere with accurate measurement of body weight and/or height & Patients (or their relatives) unable or unwilling to give written informed consent were excluded from the study.
Study tools
Two tools were used to collect the data: 1- First a specially designed questionnaire was used to collect socio-demographic variables including patient’s age, gen-der, marital status, living arrangement, level of educa-tion, income, smoking history, alcohol consumpeduca-tion, chronic illnesses, and polypharmacy.
2- Second: Patient’s nutritional status was evaluated using the most recent version of the short form of Mini Nutritional Assessment (MNA-SF) [13]. This instrument has a comparable sensitivity to the full MNA with the option of measuring calf circumference (CC) when Body Mass Index (BMI) is unavailable. It has a maximum score of 14 and categorizes patients into malnourished (less than 8), at risk for malnutrition (from 8 to 11), or normal nutritional status (more than 11) [14]. This re-vised MNA-SF has the advantages of fast screening and increased clinical applicability in practice through mal-nourished category inclusion [14].
All anthropometric data including body mass index (BMI), calf circumference (CC), weight and height were recorded using standard techniques. Biochemical and hematological parameters including hemoglobin (g/L), albumin (g/L), and lymphocyte count (× 10^9/L) were obtained from patient’s chart and recorded for analysis.
Readmission, length of stay and mortality outcomes were determined within one year after discharge.
Statistical analysis
SPSS version 23.0 was used to manage and analyze the data. Normally distributed variables were expressed as means (standard deviation [SD]), and non-normally distributed variables were presented as medians (IQR). Categorical variables were expressed as numbers and percentages. The chi-square test was used to assess the significance of categorical variables. Binary logistic re-gression (enter method) was carried out to identify pre-dictors of being categorized as malnourished (BMI and calf circumference, food intake, and mobility, live arrangement), variables excluded from the model were Albumin, Hemoglobin, and Lymphocyte. P value ≤0.05 was considered statistically significant. Overall survival rates were investigated using Kaplan-Meier method.
Results
Based on the study design and assigned population, the mean age of the elderly hospitalized patients was 70.0 ± 7.7 years; it ranged between 60 and 94 years. Females constituted almost two-thirds (60.5%) of them. Most of them were married (85.5%) or widowed (13.3%), and the majority were illiterate (73.4%), with a monthly income of <3000 SR (US $800) (85.9%). The vast major-ity lived with others (83.1%). The majormajor-ity of the patients (210, 84.7%) reported that they were diagnosed previ-ously with a chronic disease, of them, there were 143 pa-tients (57.7%) who were diabetic and 132 (53.2%) who were hypertensive in addition to 68 patients (27.4%) with IHD and 60 (24.2%) had dyslipidemia.
of becoming malnourished (MNA-SF score 8-11 points), making a total of 76.6% who were either malnourished or at nutritional risk, and the rest 58 (23.4%) were within normal.
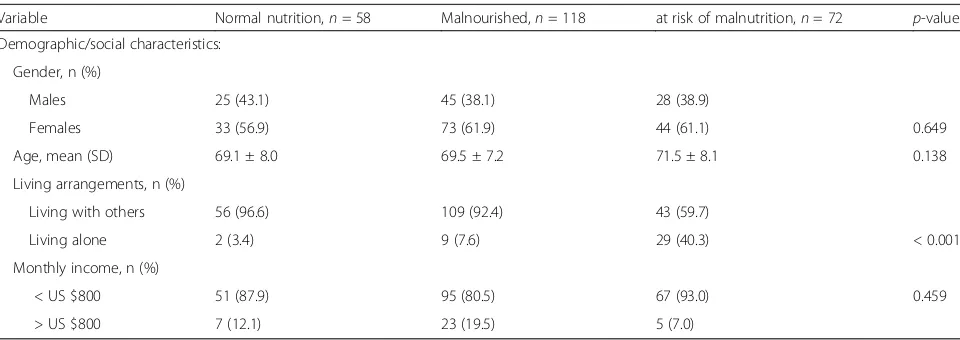
In order to compare differences within elderly patients according to their nutritional status (as revealed by their MNA-SF scores), Table 1 shows that there was no differ-ence according to gender. Among other demographic and social factors, only living alone showed a significant difference, where it was found that 20% of the malnour-ished or those at risk of malnourishment were living alone (p< 0 .001) (Table 1).
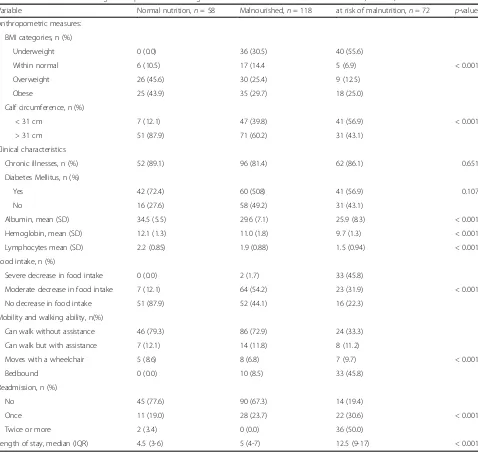
Regarding the anthropometric measures that partly re-flect malnutrition, as expected, 6.3% of the malnourished patients were categorized as being underweight com-pared to 0% of the normally nourished; also, the mean calf circumference was significantly lower among the malnourished patients. The laboratory investigation re-sults showed that the malnourished elderly patients had significantly lower serum albumin levels (28.2 ± 7.7), hemoglobin levels (10.5 ± 1.8), and lymphocyte count (1.7 ± 0.91). Most of the patients 210 (84.7%) reported being previously diagnosed with a chronic disease; of these, 143 patients (57.7%) were diabetic and 132 (53.2%) were hypertensive; while 68 patients (27.4%) had ischemic heart disease (IHD) and 60 (24.2%) had dyslipidemia.
When compared to patients with a normal nutritional status, a significantly higher percentage of malnourished patients experienced either a severe (18.4%) or moderate (45.8%) decrease in food intake. Moreover, a significantly higher percentage of malnourished patients (50%) reported that they could not walk independently and mobilized ei-ther with assistance (19.5%), with wheelchairs (10.5%), or were bedbound (20%). Furthermore, malnourished elderly patients were significantly more likely to be readmitted
when compared to patients with a normal nutritional sta-tus, with a total of (45.3%) being readmitted for an average of 7 days (IQR, 5-11 days). Lastly, out of the 7 reported mortalities, 5 were elderly malnourished patients (Table 2). Binary logistic regression revealed that the significant independent predictors for being categorized as at nutri-tional risk or malnourished include a lower BMI and calf circumference, in addition to reduced food intake and mobility (p < 0.05). Living alone also showed a border-line level of significance (p = 0.082) as an independent predictor (Table 3).
Regarding mortality and survival rate, the median of the length of stay were 5.0 months (95%CI: 4.2-5.7) among normal nutrition patients and 7.0 months (95%CI: 6.2-7.7) among malnutrition patients (Fig. 1).
Discussion
As people get older, many changes typically occur that affect nutritional status. Sensory changes, including smell, vision, and taste, affect the appetite in many ways that lead to a diminished dietary intake; these, together with changes in the digestive system that alter absorp-tion and the digesabsorp-tion of food, can lead to malnutriabsorp-tion. The problem of malnutrition becomes more apparent and remarkable when elderly individuals are hospital-ized. Hospitalized patients especially the elderly have an increased vulnerability due to their catabolic state, decreased immune system, investigations that require fasting, delay of nutritional support and the presenting disease manifestations. These factors increase the tional requirements, resulting in utilization of the nutri-tional reserves that lead to malnutrition [15].
The worldwide prevalence of malnutrition among hos-pitalized geriatric patients ranges from 12% to 75% [16]. In our study, the prevalence of poorly nourished patients reached the highest recorded limit, with three-quarters
Table 1Nutritional status of geriatric patients according to their demographic characteristics (n= 248)
Variable Normal nutrition,n= 58 Malnourished,n= 118 at risk of malnutrition,n= 72 p-value
Demographic/social characteristics:
Gender, n (%)
Males 25 (43.1) 45 (38.1) 28 (38.9)
Females 33 (56.9) 73 (61.9) 44 (61.1) 0.649
Age, mean (SD) 69.1 ± 8.0 69.5 ± 7.2 71.5 ± 8.1 0.138
Living arrangements, n (%)
Living with others 56 (96.6) 109 (92.4) 43 (59.7)
Living alone 2 (3.4) 9 (7.6) 29 (40.3) < 0.001
Monthly income, n (%)
< US $800 51 (87.9) 95 (80.5) 67 (93.0) 0.459
> US $800 7 (12.1) 23 (19.5) 5 (7.0)
Data are presented as number & percentage (%) or as mean & standard deviation
of the hospitalized elderly patients (76.6%) having a poor nutritional status; this was higher than that reported in a multinational study where approximately two-thirds of study participants were determined to be malnourished or at nutritional risk [2]. However, our findings were congruent with the results of another study conducted in Makkah Governorate, Saudi Arabia, which used the Mini Nutritional Assessment (MNA) tool and deter-mined that among the studied patients, (22.6%) were malnourished, (57.8%) were at risk of malnutrition, and (19.6%) were well-nourished [17]. These figures indicate that malnutrition is highly prevalent among hospitalized elderly patients. This high prevalence could be attributed
to several factors related to the reasons for hospital admission, including age-related coexisting medical con-ditions that can result in low food intake [18], polyphar-macy that can be an iatrogenic cause of malnutrition [19], exaggerated decline in senses of taste and/or smell with resultant poor appetite [20, 21], and cognitive changes such as dementia [22]. The relatively higher per-centage in our patients may additionally indicate poor dietary habits.
Other factors that contribute to malnutrition among elderly individuals are social isolation and financial deprivation [18]. In our study, the percentage of mal-nourished geriatrics that lived alone was significantly
Table 2Nutritional status of geriatric patients according to their clinical characteristics and outcome (n= 248)
Variable Normal nutrition,n= 58 Malnourished,n= 118 at risk of malnutrition,n= 72 p-value
Anthropometric measures:
BMI categories, n (%)
Underweight 0 (0.0) 36 (30.5) 40 (55.6)
Within normal 6 (10.5) 17 (14.4 5 (6.9) < 0.001
Overweight 26 (45.6) 30 (25.4) 9 (12.5)
Obese 25 (43.9) 35 (29.7) 18 (25.0)
Calf circumference, n (%)
< 31 cm 7 (12.1) 47 (39.8) 41 (56.9) < 0.001
> 31 cm 51 (87.9) 71 (60.2) 31 (43.1)
Clinical characteristics
Chronic illnesses, n (%) 52 (89.1) 96 (81.4) 62 (86.1) 0.651
Diabetes Mellitus, n (%)
Yes 42 (72.4) 60 (508) 41 (56.9) 0.107
No 16 (27.6) 58 (49.2) 31 (43.1)
Albumin, mean (SD) 34.5 (5.5) 29.6 (7.1) 25.9 (8.3) < 0.001
Hemoglobin, mean (SD) 12.1 (1.3) 11.0 (1.8) 9.7 (1.3) < 0.001
Lymphocytes mean (SD) 2.2 (0.85) 1.9 (0.88) 1.5 (0.94) < 0.001
Food intake, n (%)
Severe decrease in food intake 0 (0.0) 2 (1.7) 33 (45.8)
Moderate decrease in food intake 7 (12.1) 64 (54.2) 23 (31.9) < 0.001
No decrease in food intake 51 (87.9) 52 (44.1) 16 (22.3)
Mobility and walking ability, n(%)
Can walk without assistance 46 (79.3) 86 (72.9) 24 (33.3)
Can walk but with assistance 7 (12.1) 14 (11.8) 8 (11.2)
Moves with a wheelchair 5 (8.6) 8 (6.8) 7 (9.7) < 0.001
Bedbound 0 (0.0) 10 (8.5) 33 (45.8)
Readmission, n (%)
No 45 (77.6) 90 (67.3) 14 (19.4)
Once 11 (19.0) 28 (23.7) 22 (30.6) < 0.001
Twice or more 2 (3.4) 0 (0.0) 36 (50.0)
Length of stay, median (IQR) 4.5 (3-6) 5 (4-7) 12.5 (9-17) < 0.001
Data are presented as number & percentage (%) or as mean & standard deviation
higher than the percentage living with others (p< .001). This emphasizes the important role of social support for this age group, as they are often unable to prepare food or even serve themselves [23].
Aging is characterized by the loss of lean muscle mass (sarcopenia), with a noticeable loss of strength, functional decline, and poor endurance [24]. Another common symptom of aging are changes in bone density, which can increase the risk for osteoporosis [25]. These changes progressively limit the mobility of elderly individuals, which makes shopping, preparing food, and even eating more difficult. Limited mobility was apparent in our malnourished geriatric patients, as most of them indicated that they needed assistance with walking, used wheelchairs, or were bedridden.
These factors, in addition to economic factors, may well affect the frequency, quantity, and quality of food intake. In our study, a significantly higher percentage of
malnourished patients experienced either severe (18.4%) or moderate (45.8%) decreases in food intake. These find-ings are comparable to reported findfind-ings by Elmadbouly and Abdelhafez [17], who showed that 52.2% of malnour-ished elderly patients had severe declines in food intake. Similar results were observed by Oliveira et al. [26] and were attributed to anorexia, chewing or swallowing problems and digestion problems. Poverty and cognitive impairment are other issues that may affect eating habits and food choices [27].
Serum proteins have been used as markers of nutri-tion, with serum albumin being the most widely adopted because of its ability to predict mortality and other out-comes in older people [28]. Reuben et al. [29] reported that geriatrics with albumin <38 g/L had higher hospital resource use. In our study, it was found that malnour-ished geriatric patients had significantly lower serum albumin levels (28.2 ± 7.7), which could predict overuti-lization of the hospital resources. This observation is supported by Herrmann et al., who found that low albu-min levels in hospitalized geriatrics, were associated with longer periods of hospital stays and increased the risk of being readmitted to the hospital within one year [30].
The MNA-SF has been determined to be a powerful tool for predicting the length of stay of hospitalized elderly patients [31]. In our study, it was found that malnourished patients had a significantly longer length of stay than their well-nourished counterparts, which emphasizes the important role of nutrition in patient re-covery [32] and delayed rere-covery [33]. Therefore, a mal-nourished elderly patient when admitted to the hospital
Fig. 1Mortality and survival rates
Table 3Predictors of malnutrition among geriatric inpatients p Odds Ratio 95% C.I. for Odds Ratio
Lower Upper
BMI 0.000 0.146 0.071 0.287
Calf Circumference 0.016 1.837 1.132 3.072
Mobility 0.002 0.056 0.010 0.346
Food intake 0.000 0.077 0.027 0.219
Living arrangements 0.082 4.856 0.457 4.149
Constant 0.000 9.548
Cox & Snell R Square = 0.427 Nagelkerke R Square = 0.643
will have increased risks of more complications than a well-nourished patient with the same medical condition, consequently resulting in a longer hospital stay [34].
For over 7 decades, it has been documented that mal-nutrition among elderly hospitalized patients influences their mortality rate, which ranges from 20 to 50% [35]. In the current study, 5 out of the 7 malnourished pa-tients (n= 72) died, reporting a mortality rate of 6.9%.
There is a limitation of this study represented by small sample size and the heterogeneity of the study group with different diseases at different stages, which poten-tially could influence the generalizability of our findings.
Conclusions
Malnutrition was highly prevalent among hospitalized elderly and was associated with increased length of stay and mortality. It is, therefore, essential to assess the nu-tritional status of elderly patients early in admission and to institute appropriate nutritional therapy to minimize its devastating consequences on the patients and health care system.
Abbreviations
BMI:Body mass index; CC: Calf circumference; KAUH: King Abdulaziz University Hospital; LOS: Length of stay; MNA: Mini Nutritional Assessment Tool; MNA-SF: Mini Nutritional Assessment Tool - Short Form
Acknowledgements
We are grateful to Dr. Adel Ibrahim for his expertise and precious advice in proofreading the manuscript.
Funding
This research received no specific grant from any funding agency in the public, commercial, or not-for-profit sectors.
Availability of data and materials
All original data is available at king Abdulaziz University Hospital, Jeddah city, Saudi Arabia.
Authors’contributions
SaHA performed the data analysis and drafted the manuscript. SaHA and SuHA participated in the design of the study and revised the manuscript. Both authors read and approved the final version of the manuscript.
Ethics approval and consent to participate
The protocol of the present study was approved by the Research Ethics Committee (REC) of King Abdulaziz University Hospital (KAUH), Jeddah, Saudi Arabia. (Reference No. 29-15/2). Written informed consent was obtained and documented from all participants. They were informed about the nature of the study and confidentiality of their response.
Consent for publication Not applicable.
Competing interests
The authors declare that they have no Financial and Non-financial competing interests.
Publisher’s Note
Springer Nature remains neutral with regard to jurisdictional claims in published maps and institutional affiliations.
Received: 6 December 2016 Accepted: 27 June 2017
References
1. Elia M. The malnutrition advisory group consensus guidelines for the detection and management of malnutrition in the community. Nutr Bull. 2001;26(1):81–3.
2. Kaiser MJ, Bauer JM, Rämsch C, Uter W, Guigoz Y, Cederholm T, et al. Frequency of malnutrition in older adults: a multinational perspective using the mini nutritional assessment. J Am Geriatr Soc. 2010;58(9):1734–8. 3. Correia MIT, Waitzberg DL. The impact of malnutrition on morbidity,
mortality, length of hospital stay and costs evaluated through a multivariate model analysis. Clin Nutr. 2003;22(3):235–9.
4. Kiesswetter E, Pohlhausen S, Uhlig K, Diekmann R, Lesser S, Heseker H, et al. Malnutrition is related to functional impairment in older adults receiving home care. J Nutr Health Aging. 2013;17(4):345–50.
5. Rasheed S, Woods RT. Malnutrition and quality of life in older people: a systematic review and meta-analysis. Ageing Res Rev. 2013;12(2):561–6. 6. Singh DK, Manaf ZA, Yusoff NAM, Muhammad NA, Phan MF, Shahar S.
Correlation between nutritional status and comprehensive physical performance measures among older adults with undernourishment in residential institutions. Clin Interv Aging. 2014;9:1415.
7. Aeberhard C, Stanga Z, Leuenberger M. Practical scores for the detection of malnutrition. Ther Umsch. 2014;71(3):141–7.
8. Vivanti A, Ward N, Haines T. Nutritional status and associations with falls, balance, mobility and functionality during hospital admission. J Nutr Health Aging. 2011;15(5):388–91.
9. Adams NE, Bowie AJ, Simmance N, Murray M, Crowe TC. Recognition by medical and nursing professionals of malnutrition and risk of malnutrition in elderly hospitalised patients. Nutr Diet. 2008;65(2):144–50.
10. Guyonnet S, Rolland Y. Screening for malnutrition in older people. Clin Geriatr Med. 2015;31(3):429–37.
11. Guigoz Y, Vellas B. Malnutrition in the elderly: the mini nutritional assessment (MNA). Ther Umsch. 1997;54(6):345–50.
12. Vellas B, Villars H, Abellan G, Soto M, Rolland Y, Guigoz Y, et al. Overview of the MNA®-its history and challenges. J Nutr Health Aging. 2006;10(6):456. 13. Rubenstein LZ, Harker JO, Salvà A, Guigoz Y, Vellas B. Screening for
undernutrition in geriatric practice developing the short-form mini-nutritional assessment (MNA-SF). J Gerontol Ser A Biol Med Sci. 2001;56(6): M366–M72.
14. Kaiser MJ, Bauer JM, Ramsch C, Uter W, Guigoz Y, Cederholm T, et al. Validation of the mini nutritional assessment short-form (MNA®-SF): a practical tool for identification of nutritional status. J Nutr Health Aging. 2009;13(9):782–8.
15. Lara-Pulido A, Guevara-Cruz M. Malnutrition and associated factors in elderly hospitalized. Nutr Hosp. 2012;27:652–5.
16. Haritha S, Shaharb S, Yusoffb NAM, Kamaruzzamanc SB, Huac PPJ. The magnitude of malnutrition among hospitalized elderly patients in university Malaya medical centre. Health Environ J. 2010;1:64–72.
17. Elmadbouly MA, Elhafez AMA. Assessment of nutritional status of hospitalized elderly patients in Makkah governorate. Pak J Nutr. 2012;11(10): 984–90.
18. Pearson J, Schlettwein-Gsell D, Brzozowska A, Van Staveren W, Bjørnsbo K. Life style characteristics associated with nutritional risk in elderly subjects aged 80-85 years. J Nutr Health Aging. 2001;5(4):278–83.
19. Shum N, Hui W, Chu F, Chai J, Chow T. Prevalence of malnutrition and risk factors in geriatric patients of a convalescent and rehabilitation hospital. Hong Kong Med J. 2005;11(4):234–42.
20. Doty RL, Shaman P, Applebaum SL, Giberson R, Siksorski L, Rosenberg L. Smell identification ability: changes with age. Science. 1984;226(4681):1441–3. 21. Bartoshuk LM. Taste: robust across the age span? Ann N Y Acad Sci. 1989;
561(1):65–75.
22. Ikeda M, Brown J, Holland A, Fukuhara R, Hodges J. Changes in appetite, food preference, and eating habits in frontotemporal dementia and Alzheimer’s disease. J Neurol Neurosurg Psychiatry. 2002;73(4):371–6. 23. van Bokhorst-de van der Schueren MA, Lonterman-Monasch S, de Vries OJ,
Danner SA, Kramer MH, Muller M. Prevalence and determinants for malnutrition in geriatric outpatients. Clin Nutr (Edinburgh, Scotland). 2013; 32(6):1007–11.
25. Saito M, Marumo K. Collagen cross-links as a determinant of bone quality: a possible explanation for bone fragility in aging, osteoporosis, and diabetes mellitus. Osteoporos Int. 2010;21(2):195–214.
26. Oliveira M, Fogaca K, Leandro-Merhi VA. Nutritional status and functional capacity of hospitalized elderly. Nutr J. 2009;8(54):10.1186.
27. Culross B. Nutrition: meeting the needs of the elderly. ARN Network. 2008; 28. Heizer W, Holcombe B. Approach to the patient requiring nutritional
supplementation. Textbook of Gastroenterology. 1995:1044–90. 29. Reuben DB, Keeler E, Seeman TE, Sewall A, Hirsch SH, Guralnik JM.
Development of a method to identify seniors at high risk for high hospital utilization. Med Care. 2002;40(9):782–93.
30. Herrmann FR, Safran C, Levkoff SE, Minaker KL. Serum albumin level on admission as a predictor of death, length of stay, and readmission. Arch Intern Med. 1992;152(1):125–30.
31. Raslan M, Gonzalez MC, Dias MCG, Nascimento M, Castro M, Marques P, et al. Comparison of nutritional risk screening tools for predicting clinical outcomes in hospitalized patients. Nutrition. 2010;26(7):721–6.
32. Reyes J, Zuniga AS, Cruz MG. Prevalence of hyponutrition in the elderly at admission to the hospital. Nutr Hosp. 2006;22(6):702–9.
33. Covinsky KE, Martin GE, Beyth RJ, Justice AC, Sehgal AR, Landefeld CS. The relationship between clinical assessments of nutritional status and adverse outcomes in older hospitalized medical patients. J Am Geriatr Soc. 1999; 47(5):532–8.
34. Brantervik ÅM, Jacobsson IE, Grimby A, Wallén TC, Bosaeus IG. Older hospitalised patients at risk of malnutrition: correlation with quality of life, aid from the social welfare system and length of stay? Age Ageing. 2005; 34(5):444–9.
35. Pirlich M, Schütz T, Kemps M, Luhman N, Burmester G-R, Baumann G, et al. Prevalence of malnutrition in hospitalized medical patients: impact of underlying disease. Dig Dis. 2003;21(3):245–51.
• We accept pre-submission inquiries
• Our selector tool helps you to find the most relevant journal
• We provide round the clock customer support
• Convenient online submission
• Thorough peer review
• Inclusion in PubMed and all major indexing services • Maximum visibility for your research
Submit your manuscript at www.biomedcentral.com/submit