R E S E A R C H
Open Access
Differential item functioning of the SF-12 in
a population-based regional joint
replacement registry
Iraj Yadegari
1, Eric Bohm
3, Olawale F. Ayilara
1,2, Lixia Zhang
1,2, Richard Sawatzky
4, Tolulope T. Sajobi
5and
Lisa M. Lix
1,2*Abstract
Background:Joint replacement, an increasingly common procedure amongst older adults, can substantially improve health-related quality of life (HRQoL). However, differential item functioning (DIF) may affect the accurate interpretation of differences in HRQoL amongst patients with different demographic and health status characteristics but the same underlying (i.e., latent) level of the investigated construct. This study tested for DIF in pre-operative SF-12 physical health (PH) and mental health (MH) sub-scale items amongst patients undergoing total hip arthroplasty (THA) and total knee arthroplasty (TKA).
Methods:Data were from a population-based joint replacement registry from the Canadian province of Manitoba. TKA and THA patients who had surgery between 2009 and 2015 and completed a pre-operative assessment were included. DIF was tested using the multiple indicators multiple causes (MIMIC) method with sex, age group, body weight status, and presence of multiple comorbid conditions (i.e., multimorbidity) as covariates. Analyses were stratified by joint type.
Results:The study cohort included 8820 patients; 42.1% underwent THA, 57.3% were female, 32.7% were 70+ years, and 52.8% were obese. For each sub-scale, four of the six items exhibited DIF in both THA and TKA groups. Differences in the covariate effect estimates for DIF and No-DIF models on the MH latent variable were largest for age and body weight status for the THA group, and for sex and multimorbidity for the TKA group. All of the differences were small for PH. Multimorbidity had the strongest association with PH and age and sex had the strongest association with MH in the DIF models.
Conclusions:Demographic and health status characteristics influenced SF-12 PH and MH item responses in joint replacement populations, although the size of the effects were not large for PH. We recommend testing and adjusting for DIF effects to ensure comparability of HRQoL measures in joint replacement populations.
Keywords:Arthroplasty, Clinical registry, Health-related quality of life, Measurement bias
Background
Joint replacement is an increasingly common procedure; rates of total hip and knee arthroplasty (THA/TKA) are in-creasing worldwide [1,2]. THA and TKA can positively im-pact the health-related quality of life (HRQoL) of patients, resulting in substantial improvements in functional abilities and reductions in pain [3, 4]. There is strong interest
worldwide in the incorporation of patient-reported out-come measures (PROMs) into joint replacement registries for monitoring appropriateness of care, improvements in health status, and health system performance [5]. The International Society of Arthroplasty Registries has con-vened working groups to evaluate and advise on best prac-tices in the selection, administration, and interpretation of PROMs for joint replacement registries [6,7].
Measurement validity and reliability are key consider-ations in the interpretation of patient responses on PROMs. An important validity criterion relevant to group comparisons is that the scoring of PROMs must be free
© The Author(s). 2019Open AccessThis article is distributed under the terms of the Creative Commons Attribution 4.0 International License (http://creativecommons.org/licenses/by/4.0/), which permits unrestricted use, distribution, and reproduction in any medium, provided you give appropriate credit to the original author(s) and the source, provide a link to the Creative Commons license, and indicate if changes were made. The Creative Commons Public Domain Dedication waiver (http://creativecommons.org/publicdomain/zero/1.0/) applies to the data made available in this article, unless otherwise stated.
* Correspondence:[email protected] 1
Department of Mathematics and Statistics, University of Ottawa, Ottawa, ON, Canada
2Department of Community Health Sciences, University of Manitoba,
from the effects of differential item functioning (DIF), which arises when patients with the same underlying level of the latent trait that the PROM is intended to measure do not interpret a PROM’s items in the same way [8]. DIF results in different item response probabilities for individ-uals with similar observed characteristics [9]. If DIF is present, then observed group differences will at least par-tially reflect something other than the latent construct, such as different interpretations of the item(s). DIF can sult in biased between-group comparisons because the re-sponse patterns may reflect attributes other than those that the instrument is intended to measure.
Brief general-purpose PROMs, such as the 12-item Short Form Survey (i.e., SF-12), are advantageous to ad-minister to joint replacement patients because they fa-cilitate comparisons across patient populations while reducing participant response burden at pre- and post-operative measurement occasions. The SF-12 has under-gone comprehensive psychometric evaluations of its reli-ability and validity [10].
Although DIF has been tested in other measurement instruments [9, 11–13], only a few studies have investi-gated DIF for the SF-12. DIF has been detected for the SF-12 in population-based data [14, 15]; a study in the general population revealed DIF effects by age, sex, and level of education [14]. However, DIF has not been thor-oughly investigated in specific populations, such as in joint replacement populations.
The goal of our study was to test for DIF on the SF-12 physical health (PH) and mental health (MH) sub-scale items in a joint replacement population. We considered demographic characteristics in addition to health status characteristics in assessing DIF; the latter have recently been examined as potential contributors to DIF in PROMs for patients with osteoarthritis [16] and joint pain [17].
Methods
Data source
Data were from the Winnipeg Regional Health Authority Joint Replacement Registry; the Health Authority is the largest health region in the province of Manitoba, Canada and has a population of more than 700,000 resi-dents. The province has a single-payer health care sys-tem that provides necessary hospital, medical and surgical services to all individuals eligible to receive health services. The Registry captures more than 90% of the joint replacement procedures conducted within the health region and more than three-quarters of all proce-dures in the entire province.
The Registry was initiated in 2004 with partial capture of information on all joint replacement surgeries; this was expanded to full mandatory capture of information in 2005. The Registry has been described in detail else-where [18]; it contains patient demographics, comorbid
conditions, surgical technique, implant details, and com-plications. Both general and condition-specific HRQoL measures are included in the Registry. The former in-cludes the SF-12 and the latter inin-cludes the Oxford Hip and Knee scores [19, 20]. Pre-operative data capture oc-curs in the pre-admission clinic under the guidance of a clinic nurse. Post-operative data are collected via a mail-out questionnaire conducted by Registry staff. Data entry is undertaken by the hospital medical records depart-ment for hospital stay characteristics and by Registry staff for PROMs. All data are collected via standardized instruments and the process of data collection and entry is overseen by Registry staff for all hospital sites.
The study cohort included all individuals who under-went THA or TKA between April 1, 2009, and March 31, 2015 and for whom complete pre-operative data were available. All patients from one hospital were ex-cluded in 2011 because pre-operative questionnaires were not distributed that year.
Measures
The SF-12 (version 2) is a general-purpose instrument consisting of 12 items that comprise eight sub-domains [21]: physical functioning, role physical, bodily pain, gen-eral health, vitality, social functioning, role-emotional, and mental health. The eight sub-domain scores can be weighted and summarized into MH and PH sub-scale scores. According to this model, the items from the physical functioning, role-physical, bodily pain, and gen-eral health sub-domains are indicators of PH while vital-ity, social functioning, role-emotional, and mental health items are indicators for MH. Assessments of construct validity using latent variable models has confirmed this measurement structure [21,22], although correlations of residual errors for items associated with PH and MH la-tent variables has been observed [21–23].
Information about 14 chronic conditions was captured from a self-report questionnaire administered by clinic staff at the pre-operative occasion; individuals were clas-sified as having multimorbidity if they had at least two of these chronic conditions. A single dummy variable COMORB (1 = presence of 2+ comorbid conditions and 0 otherwise) was defined.
Statistical analysis
The analyses were conducted for patients with complete information (i.e., no missing data) on all SF-12 items. De-scriptive analyses were conducted using frequencies and percentages. All analyses were stratified by joint type.
A variety of methods have been used to detect DIF in-cluding logistic regression [27], item response theory (IRT) models [28, 29], and the multiple indicators mul-tiple causes (MIMIC) model [30–32]. IRT and MIMIC models can be applied to binary and ordinal item re-sponses, and are flexible to incorporate one or more la-tent constructs. In addition, the MIMIC is flexible to allow for the specification of dependencies between item residuals [23,33]. Consequently, we adopted the MIMIC model to test for uniform DIF.
We constructed baseline models for MH and PH sub-scales based on the hypothesized measurement structure of the SF-12, in which the PH and MH items have no cross loading items (Additional file1: Figures S1 and S2) . The baseline models included two correlated residuals (items P2 and P3, P4 and P5) for the PH sub-scale and two correlated residuals (items M1 and M2, M3 and M5) for the MH sub-scale [21,23] and confirmed by the assessment of fit measures, which demonstrated poorer overall fit when these residuals were not correlated.
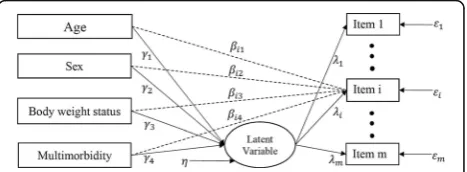
In a MIMIC model withmitems andkcovariates, the latent response for the ith item (i= 1,…, m) is regressed on the latent variableFand the covariate vectorΖ,
y
i ¼iFþβ′iZþi; ð1Þ
whereεiis the error term,λi is the factor loading, and
β′
i ¼ ði1…ikÞ is the vector of the effects of covariates on the latent response yi. The latent response is scored via a threshold model
yi¼c; if τiðcÞ<yi≤τiðcþ1Þ; ð2Þ
for categories c= 0, 1, 2,…, C – 1, where τi(0)= − ∞ and τi(C)= +∞. Thus,yi is a polytomous variable which takes discrete values 0, 1, …,C– 1. In addition, the la-tent factor is regressed on the covariates via
F¼′Zþη; ð3Þ
whereηis the error term and is independent ofZ, and γ′=(γ1, …,γ
k) is a vector of regression coefficients that describe between group differences in F (Fig. 1). These
formulations enable us to estimate and test β0i condi-tional on F. If β0i≠0, there is a significant direct effect from the covariates to the latent response yi which means that DIF exists in theith item [34,35].
There were four primary steps in the DIF analysis. First, unidimensionality of the measurement scales was assessed. Next, anchor items were selected. Then, each item was assessed for DIF. Finally after adjustment for DIF, the contributions of the covariates and items to the final DIF model was assessed.
In the first step the unidimensionality assumption, which implies that all sub-scale items measure a single la-tent construct, was examined by applying a single-factor model with an oblique rotation to the polychoric correl-ation matrix for the items for each of the MH and PH sub-scales. To make a decision about unidimensionality, we used two criteria: (a) the existence of only one eigen-value greater than one, and (b) a large eigen-value for the ratio of the first to second eigenvalues (i.e.,r> 4) [36]. We used several criteria to evaluate the goodness-of-fit of a single-factor model. We considered the model to be a reasonable fit to the data if it had a small root mean square error of approximation (i.e., RMSEA < 0.06), a large comparative fit index (i.e., CFI > 0.95), a large Tucker-Lewis Index (i.e., TLI > 0.95), and a small weighted root mean square re-sidual (i.e., WRMR < 1.0) [37–39].
In the second step, we selected anchor items (i.e., DIF-free items). At least one anchor item must be selected to define the latent construct on which the groups are compared. We used the following method to select the anchor item(s). First, for each sub-scale, a single-factor model was fit to the data; it included direct effects of the covariates on the latent variable but no direct effects be-tween the covariates and the sub-scale items. This was the base model. Next, a series of single-factor models were fit to the data that added direct effects from the co-variates; there was one model for each sub-scale item. A
Fig. 1Example of MIMIC model permitting DIF for theith item. The dashed arrow from each covariate to theith item represents the direct effect;γk= regression coefficient for the effect of thekth
covariate on the latent variable;λi= the regression coefficient for the
latent variable and theith item;βik= regression coefficient showing
the effect of thekth covariate on theith item;εi= measurement
χ2
difference test was used to compare the models with and without the direct effects. The item(s) with the smallest χ2 statistics was(were) selected as the anchor item(s) [40]. Note that this process was applied to the data for all cohort members so that the same anchor items were selected for both THA and TKA patients. This facilitated the interpretation of the study findings because the same item(s) served as reference points for all analyses. We confirmed the same anchor items in separate analyses for THA and TKA patients.
In the third step, item purification was conducted to identify the items affected by DIF. First, a full model was fit to the data that included direct effects from covariates to all sub-scale items except the anchor item(s). Next, we fit a series of reduced models that excluded direct ef-fects from the covariates to each item; this was done one item at a time. Aχ2difference test was used to compare these nested models using DIFFTEST for the robust weighted least square estimation method (i.e., WLSMV) in Mplus (https://www.statmodel.com/chidiff.shtml). A large χ2 difference statistic implies uniform DIF is present for the item.
The fourth step was to fit a model that included direct effects from the covariates to all DIF items (i.e., the items for which DIF was identified in the previous step) and direct effects of the covariates on the latent variable [9, 31]. This model was used to obtain parameter estimates of direct effects of the co-variates on the PH and MH sub-scale items. The total effect of DIF was measured via the relative difference between standardized coefficient estimates for the DIF and No-DIF models (i.e., difference in standardized estimates divided by the standardized estimates for the No-DIF model). A difference in standardized coef-ficients of 0.20 was considered as small, 0.50 as mod-erate, and 0.80 or greater as large [41]. Estimates of the total effects (i.e., direct and indirect effects) of the covariates on the individual sub-scale items were also produced.
We used an approach based on dominance analysis [42] and Nagelkerke’s coefficient of determination [43–45] to assess the relative importance of both in-dividual items and covariates in the DIF models. Spe-cifically, an item’s importance in the final DIF model was estimated based on its contribution (i.e., direct effects from the covariates to the item) conditional on the contributions of the other items. To measure the item’s importance, a full model was fit to the data that include direct effects of the covariates on all DIF items identified in the previous step, as well as direct effects of the covariates on the latent variable. Next, we fit a series of reduced models that excluded direct effects from the covariates to each DIF item; we did this one item at a time. The importance of each DIF
item was assessed using an adaptation of Nagelkerke’s coefficient of determination,
R2¼1−e−ðΔχ2Þ=N
= 1−e−χ2
R=N
; ð4Þ
where Nis the total sample size, χ2R is the chi-square test statistic for the reduced model, andΔχ2is the scaled difference in χ2 test statistics for the reduced and full models. The statistic R2 is equal to Nagelkerke’s coeffi-cient of determination if we replace χ2
R with −2 Log(LR) andΔχ2with−2 Log(LR/LF) in maximum likelihood esti-mation, where LR and LF are the likelihood of the re-duced and full models, respectively. An item was more important than all other items if it had the largest R2 amongst all items.
The importance of a covariate in the final DIF model was measured by its contribution (i.e., direct effects from the covariate to all DIF items), conditional on the contri-bution of the other model covariates. We used a similar approach to that described above to measure covariate importance in the final DIF model. First, a full model was fit to the data that include direct effects from all covariates to the DIF items, as well as direct effects of the covariates on the latent variable. Next, a series of reduced models were fit to the data that excluded the effect of each covari-ate; this was done one covariate at a time. Using the adapted Nagelkerke coefficient of determination, we mea-sured the importance of each covariate. A covariate was more important than all other covariates if it had the lar-gestR2amongst all of the covariates.
All analyses were conducted using Mplus software, version 8. In all analyses, the latent factor mean was constrained to zero and its variance was fixed to one.
Results
The study cohort included 8820 patients with complete information on all SF-12 items at the pre-operative occa-sion. Overall, 42.1% patients had THA in the observa-tion period.
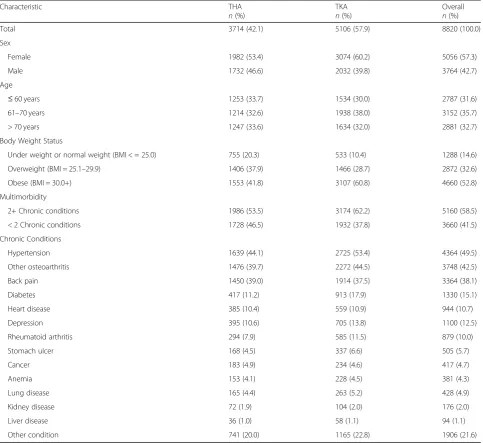
For the THA group (Table1), 53.4% were female, third (33.7%) were 60 years of age or younger, and one-third (33.6%) were more than 70 years of age. Over-weight and obese individuals accounted for 37.9% and 41.8% of the THA group, respectively. Slightly more than one-half of THA patients had multimorbidity. The most common chronic conditions were hypertension, other (i.e., secondary) osteoarthritis, and back pain.
and the most common chronic conditions were the same as for the THA group.
The frequencies of responses to the MH and PH sub-scale items are reported in Table2 for the entire cohort. For the MH sub-scale, close to half (46.4%) of patients responded “A little of the time” to M3 (“felt calm and peaceful”), while 36.0% of patients responded “None of the time” to M2 (“less careful than usual”). Furthermore, for the PH sub-scale, more than half (58.9%) of patients respond “Yes, limited a lot” to P2 (“moderate activities”) while 74.4% of patients respond“Yes, limited a lot”to P3 (“climbing several flights of stairs”).
With respect to multimorbidity, 19.0% of individuals in the cohort had no chronic conditions and 22.5% had
a single chronic condition. Almost one-quarter (24.2%) had two chronic conditions, and the remainder had three or more chronic conditions.
Exploratory factor analysis revealed that for both the PH and MH sub-scales there existed only one eigenvalue with a value greater than one. The ratio of the first to second eigenvalues was larger than four, except for the PH sub-scale in the TKA group where it was only slightly less than this criterion (r= 3.95). In addition, the second eigenvalue was similar in size to the third eigenvalue in both groups and for both sub-scales. Therefore, it was reasonable to accept uni-dimensionality of the MH and PH sub-scales for both the THA and TKA groups.
Table 1Frequency (%) of demographic and health status characteristics of study cohort, stratified by type of joint replacement
Characteristic THA
n(%)
TKA n(%)
Overall n(%)
Total 3714 (42.1) 5106 (57.9) 8820 (100.0)
Sex
Female 1982 (53.4) 3074 (60.2) 5056 (57.3)
Male 1732 (46.6) 2032 (39.8) 3764 (42.7)
Age
≤60 years 1253 (33.7) 1534 (30.0) 2787 (31.6)
61–70 years 1214 (32.6) 1938 (38.0) 3152 (35.7)
> 70 years 1247 (33.6) 1634 (32.0) 2881 (32.7)
Body Weight Status
Under weight or normal weight (BMI < = 25.0) 755 (20.3) 533 (10.4) 1288 (14.6)
Overweight (BMI = 25.1–29.9) 1406 (37.9) 1466 (28.7) 2872 (32.6)
Obese (BMI = 30.0+) 1553 (41.8) 3107 (60.8) 4660 (52.8)
Multimorbidity
2+ Chronic conditions 1986 (53.5) 3174 (62.2) 5160 (58.5)
< 2 Chronic conditions 1728 (46.5) 1932 (37.8) 3660 (41.5)
Chronic Conditions
Hypertension 1639 (44.1) 2725 (53.4) 4364 (49.5)
Other osteoarthritis 1476 (39.7) 2272 (44.5) 3748 (42.5)
Back pain 1450 (39.0) 1914 (37.5) 3364 (38.1)
Diabetes 417 (11.2) 913 (17.9) 1330 (15.1)
Heart disease 385 (10.4) 559 (10.9) 944 (10.7)
Depression 395 (10.6) 705 (13.8) 1100 (12.5)
Rheumatoid arthritis 294 (7.9) 585 (11.5) 879 (10.0)
Stomach ulcer 168 (4.5) 337 (6.6) 505 (5.7)
Cancer 183 (4.9) 234 (4.6) 417 (4.7)
Anemia 153 (4.1) 228 (4.5) 381 (4.3)
Lung disease 165 (4.4) 263 (5.2) 428 (4.9)
Kidney disease 72 (1.9) 104 (2.0) 176 (2.0)
Liver disease 36 (1.0) 58 (1.1) 94 (1.1)
Other condition 741 (20.0) 1165 (22.8) 1906 (21.6)
In the baseline model for the PH and MH sub-scales, two correlated residuals for the PH sub-scale (items P2 and P3, P4 and P5) and four correlated residuals for the MH sub-scale (items M1 and M2, M3 and M5) were con-sidered for inclusion based on the empirical results and previous research [21, 23]. Adding residual correlations for these items resulted in an acceptable model fit (Table3) . Specifically, the single-factor model fit to the MH sub-scale items for the THA group had RMSEA = 0.05, CFI =
1.00, TLI = 1.00, and WRMR = 0.62 and for the TKA group it had RMSEA = 0.03, CFI = 1.00, TLI = 1.00, and WRMR = 0.38 for the TKA group. The single-factor model fit to the PH sub-scale items had RMSEA = 0.03, CFI = 1.00, TLI = 1.00, and WRMR = 0.61 for the THA group. For the TKA group, this model had RMSEA = 0.02, CFI = 1.00, TLI = 1.00, and WRMR = 0.52.
We selected anchor items empirically for each sub-scale. We selected items M5 (“Felt downhearted and Table 2Frequencies (%) of responses to the SF-12 mental health (MH) and physical health (PH) sub-scale items
MH Sub-scale
All of the time Most of the time Some of the time A little of the time None of the time
M1: Accomplished less than would like 634 (7.2) 1324 (15.0) 2108 (23.9) 1858 (21.1) 2896 (32.8)
M2: Less careful than usual 564 (6.4) 1240 (14.1) 1998 (22.7) 1841 (20.9) 3177 (36.0)
M3: Felt calm and peaceful 373 (4.2) 1227 (13.9) 2510 (28.5) 4094 (46.4) 616 (7.0)
M4: Have a lot of energy 1017 (11.5) 2401 (27.2) 3150 (35.7) 2027 (23.0) 225 (2.6)
M5: Felt downhearted and depressed 165 (1.9) 595 (6.7) 2254 (25.6) 2860 (32.4) 2946 (33.4)
Not at all A little bit Moderately Quite a bit Extremely
M6: Have social limitations 556 (6.3) 1352 (15.3) 2545 (28.9) 1915 (21.7) 2452 (27.8)
PH Sub-scale
Excellent Very good Good Fair Poor
P1: General health 150 (1.7) 1021 (11.6) 4181 (47.4) 2892 (32.8) 576 (6.5)
Yes, limited a lot Yes, limited a little No, not limited at all
P2: Limits in moderate activity 5198 (58.9) 3031 (34.4) 591 (6.7)
P3: Climbing several flights of stairs 6563 (74.4) 1910 (21.7) 347 (3.9)
All of the time Most of the time Some of the time A little of the time None of the time
P4: Accomplished less than would like 2564 (29.1) 3199 (36.3) 2049 (23.2) 731 (8.3) 277 (3.1)
P5: Limited in work and activity 2680 (30.4) 3291 (37.3) 1989 (22.6) 633 (7.2) 227 (2.6)
P6: Have pain with normal work 1825 (20.7) 3942 (44.7) 2118 (24.0) 804 (9.1) 131 (1.5)
Table 3Goodness-of-fit statistics for the SF-12 mental health (MH) and physical health (PH) sub-scales with and without correlated residual variances, stratified by type of joint replacement
Model Joint Type RMSEA (90% CI) CFI TLI WRMR
MH Sub-scale
No residual variance correlations THA 0.22 (0.21, 0.23) 0.97 0.94 4.77
TKA 0.21 (0.21, 0.22) 0.97 0.95 5.18
With residual variance correlations: items M1 and M2, M3 and M5 THA 0.15 (0.14, 0.15) 0.99 0.97 2.47
TKA 0.14 (0.13, 0.15) 0.99 0.98 2.76
With residual variance correlations: items M1 and M2, M3 and M5, M3 and M4, M4 and M6 THA 0.05 (0.04, 0.07) 1.00 1.00 0.62
TKA 0.03 (0.02, 0.04) 1.00 1.00 0.38
PH Sub-scale
No residual variance correlations THA 0.19 (0.18, 0.20) 0.98 0.97 4.49
TKA 0.15 (0.14, 0.15) 0.98 0.97 3.95
With residual correlations: items P2 and P3, P4 and P5 THA 0.03 (0.02, 0.04) 1.00 1.00 0.61
TKA 0.02 (0.01, 0.03) 1.00 1.00 0.52
THATotal hip arthroplasty,TKATotal knee arthroplasty,RMSEARoot mean square error of approximation,CFIComparative fit index,TLITucker-Lewis index,WRMR
depressed”) and M6 (“Social limitations”) for the MH sub-scale and items P2 (“Moderate activity”) and P6 (“Have pain with normal work)” for the PH sub-scale, because they had the smallest χ2 statistics. Specifically, the χ2 statistics had values of 96.9, 157.1, 150.9, 160.1, 17.7, and 26.4 for items M1 to M6, respectively and values of 719.6, 41.0, 136.9, 62.2, 99.2, and 43.5 for items P1 to P6, respectively. .
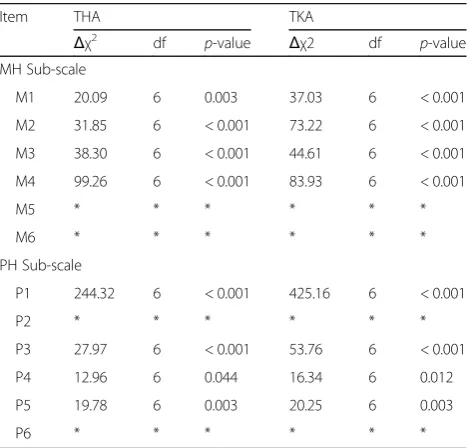
Then we tested all non-anchor items for uniform DIF. For the MH sub-scale, all of theχ2difference tests pro-duced statistically significant results for both the TKA and THA groups, suggesting uniform DIF was present in all non-anchor items (see Table 4). Furthermore, the χ2
difference tests suggested the presence of uniform DIF in all non-anchor items for the PH sub-scale for both the THA and TKA groups.
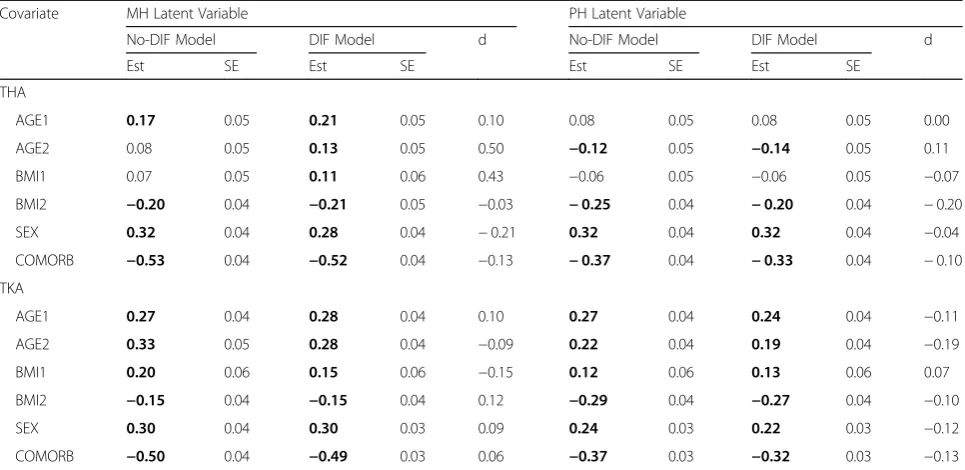
Table 5 provides estimates of the direct effects of the covariates on the latent variables. As well, differences in the estimates when there were direct effects from the covariates to the items (i.e., DIF model) versus the case when there were no direct effects from covariates to the items (i.e., No-DIF model) are provided. As Table 5 re-veals, in both the THA and TKA groups, the PH and MH latent variables were always negatively associated with the covariates COMORB and BMI2 and positively associated with sex. This indicates that patients with multimorbidity had smaller PH and MH latent variable scores on average, relative to other patients; obese pa-tients had smaller PH and MH latent variable scores
relative to non-obese patients, and the PH and MH la-tent variable scores for men were always larger than those for women. Almost all of the estimates were statis-tically significant in both the DIF and No-DIF models. The relative differences revealed that the largest effects of the covariates on the MH latent variable were ob-served for the age and body weight status covariates in the THA group. The majority of the standardized differ-ences indicate small effects; the exceptions were for the covariates AGE2 and BMI1 for the THA group, which were moderate in size. For the PH latent variable, all of the covariates had smaller relative difference statistics than for the MH latent variable in both the TKA and THA groups.
Adjustment for DIF resulted in changes in the esti-mates of the total effects for most of the SF-12 MH and PH sub-scale items (Additional file 2: Tables S1 and S2). For the MH sub-scale items, in general the largest rela-tive differences in total effect estimates for the DIF and no-DIF models were associated with the age and body weight status covariates; these differences were generally larger in size for the THA group than for the TKA group. For the PH sub-scale items, the relative differ-ences in total effect estimates for the DIF and no-DIF models were all small, except for item P1 (“General health”) in the THA group.
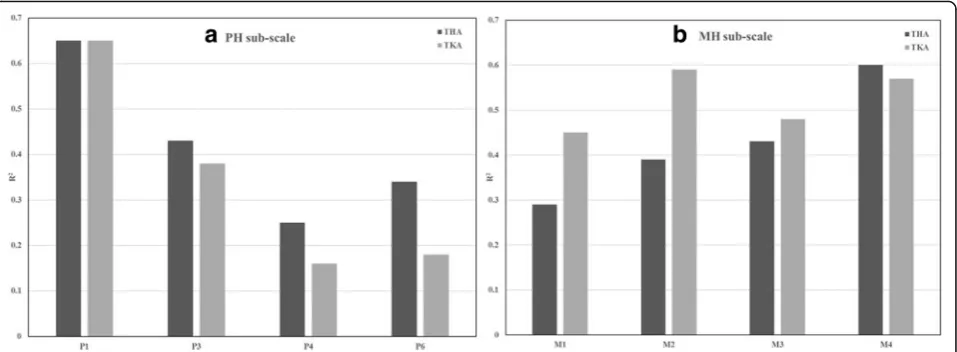
In the final DIF model for the PH sub-scale, multimor-bidity and age had the largest and smallest relative im-portance, respectively as judged by the modified coefficient of determination (Fig. 2). This finding was consistent for both the THA and TKA groups. In the final DIF model for the MH sub-scale, sex and age had the largest importance for the THA group while multi-morbidity and age had the largest R2 statistics for the TKA group.
Finally, the relative importance analyses were con-ducted for all sub-scale items (Fig. 3). For the PH sub-scale, item P1 (“General health”) had the largest contri-bution to the final DIF model while item P4 (“ Accom-plished less, physical”) had the smallest contribution. For the MH sub-scale, item M4 (“Have a lot of energy”) for the THA group and items M4 and M2 (“Less careful than usual”) for the TKA group had the largest contribu-tions to the final DIF model.
Discussion
This study tested for DIF in the PH and MH sub-scale items of the SF-12 across demographic and health status characteristics for patients having joint replacement sur-gery. We focused on responses given prior to surgery, as this is when health status measures (i.e., body weight status and presence of comorbid conditions) were col-lected, and also because pre-surgery assessments are an essential reference point for assessing the magnitude of Table 4Tests for differential item functioning on the SF-12
mental health (MH) and physical health (PH) sub-scale items, stratified by type of joint replacement
Item THA TKA
Δχ2
df p-value Δχ2 df p-value
MH Sub-scale
M1 20.09 6 0.003 37.03 6 < 0.001
M2 31.85 6 < 0.001 73.22 6 < 0.001
M3 38.30 6 < 0.001 44.61 6 < 0.001
M4 99.26 6 < 0.001 83.93 6 < 0.001
M5 * * * * * *
M6 * * * * * *
PH Sub-scale
P1 244.32 6 < 0.001 425.16 6 < 0.001
P2 * * * * * *
P3 27.97 6 < 0.001 53.76 6 < 0.001
P4 12.96 6 0.044 16.34 6 0.012
P5 19.78 6 0.003 20.25 6 0.003
P6 * * * * * *
dfDegree of freedom,Δχ2
post-surgery improvements [46]. The responses given by patients on the SF-12 items have some consistency with previous research, which has shown, for example, that older patients are more likely to report problems with moderate activities and climbing several flights of stairs [47,48].
Our findings suggest that multimorbidity is not only a source of DIF but also had the largest contribution to the DIF model for the PH sub-scale in the relative importance analysis. Other recent studies have shown a strong association between SF-12 PH sub-scale
scores and multimorbidity [49], although this covari-ate has not been explored for its effect in DIF ana-lyses. At the same time, the differences in estimates of the effect of comorbidity on the MH and PH latent variables between the No-DIF and DIF models were generally small.
Item M4 from the MH sub-scale and item P1 from the PH sub-scale were associated with the largest contribu-tions to the final DIF models. Adjustment for DIF did not change the direction of the association between the Table 5Regression model estimates for covariate associations with SF-12 mental health (MH) and physical health (PH) latent variable scores
Covariate MH Latent Variable PH Latent Variable
No-DIF Model DIF Model d No-DIF Model DIF Model d
Est SE Est SE Est SE Est SE
THA
AGE1 0.17 0.05 0.21 0.05 0.10 0.08 0.05 0.08 0.05 0.00
AGE2 0.08 0.05 0.13 0.05 0.50 −0.12 0.05 −0.14 0.05 0.11
BMI1 0.07 0.05 0.11 0.06 0.43 −0.06 0.05 −0.06 0.05 −0.07
BMI2 −0.20 0.04 −0.21 0.05 −0.03 −0.25 0.04 −0.20 0.04 −0.20
SEX 0.32 0.04 0.28 0.04 −0.21 0.32 0.04 0.32 0.04 −0.04
COMORB −0.53 0.04 −0.52 0.04 −0.13 −0.37 0.04 −0.33 0.04 −0.10
TKA
AGE1 0.27 0.04 0.28 0.04 0.10 0.27 0.04 0.24 0.04 −0.11
AGE2 0.33 0.05 0.28 0.04 −0.09 0.22 0.04 0.19 0.04 −0.19
BMI1 0.20 0.06 0.15 0.06 −0.15 0.12 0.06 0.13 0.06 0.07
BMI2 −0.15 0.04 −0.15 0.04 0.12 −0.29 0.04 −0.27 0.04 −0.10
SEX 0.30 0.04 0.30 0.03 0.09 0.24 0.03 0.22 0.03 −0.12
COMORB −0.50 0.04 −0.49 0.03 0.06 −0.37 0.03 −0.32 0.03 −0.13
AGE1 = 0 if age≤60 and 1 otherwise; AGE2 = 0 if age≤70 and 1 otherwise; BMI1 = 0 if BMI≤25.0 and 1 otherwise); BMI2 = 0 if BMI≤30.0 and 1 otherwise; COMORB = 0 if < 2 comorbid conditions and 1 otherwise;ESTEstimate,SEStandard error,dRelative difference in standardized estimates between DIF model and No-DIF models; Boldface font is used to denote statistically significant estimates atα= 0.05
covariates and the PH and MH scores. This result was consistent with other findings in the literature for the SF-12 and also for the SF-36 [9,14].
While this study investigated DIF in a population for which PROMs are of significant value for assessing surgical outcomes, further research is warranted. Since DIF may change from pre-surgery to post-surgery occasions, future studies might explore response shift [50], a change in an in-dividual’s values, internal standards, and conceptualization of QOL over time, in joint replacement populations. Re-search conducted to date [51–53] has identified the pres-ence of response shift in patients undergoing total knee replacement. As well, we only tested for uniform DIF in MH and PH. The MIMIC model cannot easily be used to investigate the presence of non-uniform DIF, which in-volves testing interactions between covariates and latent variables on the item responses. Specification of interaction terms assumes normally distributed covariates [32]. Thus, there is opportunity for opportunities to investigate new ap-proaches to test for non-uniform DIF in MIMIC models. Finally, the generalizability of the study findings regarding the measurement model fit to the data and presence of DIF should be explored in other joint replacement populations.
Conclusions
In summary, this study suggests the existence of DIF in population-based SF-12 data for joint replacement pa-tients. PH and MH sub-scale scores may not be compar-able across sub-groups defined by demographic and health status variables without considering the effects of DIF. Moreover, this study has provided evidence that having more than one chronic condition may be a source of DIF; multimorbidity should therefore be explored further in studies about DIF in other popu-lations. At the same time, associations between the latent construct and the covariates revealed generally
small differences between the DIF and no-DIF models, indicating that the effect of DIF on the la-tent construct was not substantial in either THA or TKA patients.
DIF should be given routine consideration in the ana-lysis of PROMs because it can impact the interpretation of group differences. Measurement equivalence is essen-tial to ensure accurate assessments of patient health; in-accurate assessment can result in incorrect estimates of the magnitude of group differences and can impact on clinical decision making about the effectiveness of inter-ventions, such as THA and TKA, on patient’s percep-tions of their own health.
There are a few methods to address the presence of DIF in PROMs data, although no method is recog-nized as the optimal solution [54]. Removing DIF items from the SF-12 is likely to effect the validity and accuracy of this measure. Replacing DIF items with equivalent items that do not exhibit DIF is conditional on having a resource of known DIF-free items. Exam-ining items for DIF prior to conducting analyses on the SF-12 and adjusting for DIF before comparing sub-groups may be a reasonable solution, although it can also affect the comparability of scores across pop-ulations. Sensitivity analyses, in which analyses of PROMs are conducted after accounting for DIF and then not accounting for DIF, is a feasible approach for researchers to adopt in practice.
Additional files
Additional file 1: Figure S1.Baseline model for the SF-12 mental health sub-scale.Figure S2.Baseline model for the SF-12 physical health sub-scale. (PDF 100 kb)
stratified by type of joint replacement.Table S2.Total effects of covariates on the SF-12 physical health sub-scale items for differential item functioning (DIF) and No-DIF models, stratified by type of joint replacement. (PDF 189 kb)
Abbreviations
BMI:Body mass index; COMORB: Comorbidity; DIF: Differential item functioning; HRQoL: Health-related quality of life; MH: Mental health; PH: Physical health; PROM: Patient-reported outcome measure; THA: Total hip arthroplasty; TKA: Total knee arthroplasty
Acknowledgements
Access to the data was provided by the Winnipeg Regional Health Authority. The results and conclusions are those of the authors and no official endorsement by the data providers is intended or should be inferred.
Authors’contributions
IY, OA, and LZ conducted the analysis. LML, EB, RS, TTS, and IY conceived the study and prepared the analysis plan. IY and LML prepared the draft manuscript. All authors reviewed and approved the final version of the manuscript.
Funding
Funding for this study was provided by the Canadian Institutes of Health Research (grant # MOP-142404). LML was supported by a Research Chair from Research Manitoba during the period of the study. RS is supported by a Tier 2 Canada Research Chair in Patient-Reported Outcomes.
Availability of data and materials
Data used in this article were derived from administrative health data as a secondary source. The data were provided under specific data sharing agreements only for the approved use. The original source data are not owned by the researchers and as such cannot be provided to a public repository. The original data source and approval for use has been noted in the acknowledgments of the article. Where necessary and with appropriate approvals, source data specific to this article or project may be reviewed with the consent of the original data providers, along with the required privacy and ethical review bodies.
Ethics approval and consent to participate
This study received ethical approval from the University of Manitoba Health Research Ethics Board. Consent was not received from study participants; this was a retrospective population-based cohort study that used secondary data and therefore obtaining consent was not practicable.
Consent for publication
Not applicable.
Competing interests
The authors declare that they have no competing interests.
Author details
1Department of Mathematics and Statistics, University of Ottawa, Ottawa, ON,
Canada.2Department of Community Health Sciences, University of Manitoba,
S113-750 Bannatyne Avenue, Winnipeg, MB R3E 0W3, Canada.3Department
of Surgery, University of Manitoba, Winnipeg, MB, Canada.4School of
Nursing, Trinity Western University, Langley, BC, Canada.5Department of
Community Health Sciences, University of Calgary, Calgary, AB, Canada.
Received: 6 September 2018 Accepted: 27 May 2019
References
1. Maradit Kremers H, Larson DR, Crowson CS, Kremers WK, Washington RE, Steiner CA, et al. Prevalence of total hip and knee replacement in the United States. J Bone Joint Surg Am. 2015;97(17):1386–97.
2. Slover J, Zuckerman JD. Increasing use of total knee replacement and revision surgery. JAMA. 2012;308(12):1266–8.
3. Ethgen O, Bruyere O, Richy F, Dardennes C, Reginster JY. Health-related quality of life in total hip and total knee arthroplasty. A qualitative and systematic review of the literature. J Bone Joint Surg Am. 2004;86-a(5):963–74.
4. da Silva RR, Santos AA, de Sampaio Carvalho Junior J, Matos MA. Quality of life after total knee arthroplasty: systematic review. Rev Bras Ortop. 2014;49(5):520–7.
5. Rolfson O, Wissig S, van Maasakkers L, Stowell C, Ackerman I, Ayers D, et al. Defining an international standard set of outcome measures for patients with hip or knee osteoarthritis: consensus of the international consortium for health outcomes measurement hip and knee osteoarthritis working group. Arthritis Care Res (Hoboken). 2016;68(11):1631–9.
6. Rolfson O, Bohm E, Franklin P, Lyman S, Denissen G, Dawson J, et al. Patient-reported outcome measures in arthroplasty registries report of the patient-reported outcome measures working group of the International Society of Arthroplasty Registries part II. Recommendations for selection, administration, and analysis. Acta Orthop. 2016;87(Suppl 1):9–23. 7. Rolfson O, Eresian Chenok K, Bohm E, Lubbeke A, Denissen G, Dunn J, et al.
Patient-reported outcome measures in arthroplasty registries. Acta Orthop Suppl. 2016;87(Suppl 1):3–8.
8. Sawatzky R, Chan EKH, Zumbo BD, Ahmed S, Bartlett SJ, Bingham CO, et al. Montreal accord on patient-reported outcomes (PROs) use series, paper 7: modern perspectives of measurement validation emphasize justification of inferences based on patient reported outcome scores. J Clin Epidemiol. 2017;89:154–9.
9. Lix LM, Wu X, Hopman W, Mayo N, Sajobi TT, Liu J, et al. Differential item functioning in the SF-36 physical functioning and mental health sub-scales: a population-based investigation in the Canadian multicentre osteoporosis study. PLoS One. 2016;11(3):e0151519.
10. Salyers MP, Bosworth HB, Swanson JW, Lamb-Pagone J, Osher FC. Reliability and validity of the SF-12 health survey among people with severe mental illness. Med Care. 2000;38(11):1141–50.
11. Wu X, Sawatzky R, Hopman W, Mayo N, Sajobi TT, Liu J, et al. Latent variable mixture models to test for differential item functioning: a population-based analysis. Health Qual Life Outcomes. 2017;15(1):102.
12. Bjorner JB, Kreiner S, Ware JE, Damsgaard MT, Bech P. Differential item functioning in the Danish translation of the SF-36. J Clin Epidemiol. 1998;51(11):1189–202.
13. Kwon JY, Sawatzky R. Examining gender-related differential item functioning of the veterans Rand 12-item health survey. Qual Life Res. 2017;26(10):2877–83. 14. Fleishman JA, Lawrence WF. Demographic variation in SF-12 scores: true differences or differential item functioning? Med Care. 2003;41(7 Suppl):Iii75–iii86.
15. Bourion-Bedes S, Schwan R, Laprevote V, Bedes A, Bonnet JL, Baumann C. Differential item functioning (DIF) of SF-12 and Q-LES-Q-SF items among French substance users. Health Qual Life Outcomes. 2015;13:172.
16. Hamilton CB, Maly MR, Giffin JR, Clark JM, Speechley M, Petrella RJ, et al. Validation of the questionnaire to identify knee symptoms (QuIKS) using Rasch analysis. Health Qual Life Outcomes. 2015;13:157.
17. Hermsen LA, Terwee CB, Leone SS, van der Zwaard B, Smalbrugge M, Dekker J, et al. Social participation in older adults with joint pain and comorbidity: testing the measurement properties of the Dutch Keele assessment of participation. BMJ Open. 2013;3(8):e003181.
18. Singh J, Politis A, Loucks L, Hedden DR, Bohm ER. Trends in revision hip and knee arthroplasty observations after implementation of a regional joint replacement registry. Can J Surg. 2016;59(5):304–10.
19. Dawson J, Fitzpatrick R, Carr A, Murray D. Questionnaire on the perceptions of patients about total hip replacement. J Bone Joint Surg Br. 1996;78(2):185–90.
20. Dawson J, Fitzpatrick R, Murray D, Carr A. Questionnaire on the perceptions of patients about total knee replacement. J Bone Joint Surg Br. 1998;80(1):63–9.
21. Ware J Jr, Kosinski M, Keller SD. A 12-item short-form health survey: construction of scales and preliminary tests of reliability and validity. Med Care. 1996;34(3):220–33.
22. Maurischat C, Herschbach P, Peters A, Bullinger M. Factorial validity of the Short Form 12 (SF-12) in patients with diabetes mellitus. Psychol Sci Q. 2008;50:7–20.
23. Chum A, Skosireva A, Tobon J, Hwang S. Construct validity of the SF-12v2 for the homeless population with mental illness: an instrument to measure self-reported mental and physical health. PLoS One. 2016;11(3):e0148856. 24. Fortin M, Bravo G, Hudon C, Vanasse A, Lapointe L. Prevalence of
25. Garrow JS, Webster J. Quetelet’s index (W/H2) as a measure of fatness. Int J Obes. 1985;9(2):147–53.
26. Wohlfahrt-Veje C, Tinggaard J, Winther K, Mouritsen A, Hagen CP, Mieritz MG, et al. Body fat throughout childhood in 2647 healthy Danish children: agreement of BMI, waist circumference, skinfolds with dual X-ray absorptiometry. Eur J Clin Nutr. 2014;68(6):664–70.
27. Swaminathan H, Rogers HJ. Detecting differential item functioning using logistic regression procedures. J Educ Meas. 1990;27(4):361–70.
28. Orlando Edelen MO, Thissen D, Teresi JA, Kleinman M, Ocepek-Welikson K. Identification of differential item functioning using item response theory and the likelihood-based model comparison approach. Application to the mini-mental state examination. Med Care. 2006;44(11 Suppl 3):S134–42.
29. Langer MM, Hill CD, Thissen D, Burwinkle TM, Varni JW, DeWalt DA. Item response theory detected differential item functioning between healthy and ill children in quality-of-life measures. J Clin Epidemiol. 2008;61(3):268–76. 30. Shih C-L, Wang W-C. Differential item functioning detection using the
multiple indicators, multiple causes method with a pure short anchor. Appl Psychol Meas. 2009;33(3):184–99.
31. Woods CM, Oltmanns TF, Turkheimer E. Illustration of MIMIC-model DIF testing with the schedule for nonadaptive and adaptive personality. J Psychopathol Behav Assess. 2009;31(4):320–30.
32. Woods CM, Grimm KJ. Testing for nonuniform differential item functioning with multiple indicator multiple cause models. Appl Psychol Meas. 2011;35(5):339–61.
33. Okonkwo OC, Roth DL, Pulley L, Howard G. Confirmatory factor analysis of the validity of the SF-12 for persons with and without a history of stroke. Qual Life Res. 2010;19(9):1323–31.
34. Muthen B, Asparouhov T, Muthen L. Latent variable analysis with categorical outcomes: multiple-group and growth modeling in Mplus. Mplus Web Notes: No 4 Version 5; 2002.
35. Wang W-C, Shih C-L. MIMIC methods for assessing differential item functioning in polytomous items. Appl Psychol Meas. 2010;34(3):166–80. 36. Lord FM. Applications of item response theory to practical testing problems.
Hillsdale: Erlbaum Associates; 1980.
37. Cook KF, Kallen MA, Amtmann D. Having a fit: impact of number of items and distribution of data on traditional criteria for assessing IRT’s unidimensionality assumption. Qual Life Res. 2009;18(4):447–60. 38. Hu L-t, Bentler PM. Cutoff criteria for fit indexes in covariance structure
analysis: conventional criteria versus new alternatives. Struct Equ Model. 1999;6(1):1–55.
39. Browne MW, Cudeck R. Alternative ways of assessing model fit. Sociol Methods Res. 1992;21:230–58.
40. Woods CM. Empirical selection of anchors for tests of differential item functioning. Appl Psychol Meas. 2009;33(1):42–57.
41. Cohen J. Statistical power analysis for the behavioral sciences (2nd ed.). Hillsdale: Erlbaum; 1988.
42. Budescu DV. Dominance analysis: a new approach to the problem of relative importance of predictors in multiple regression. Psychol Bull. 1993; 114(3):542–51.
43. Nagelkerke NJ. A note on a general definition of the coefficient of determination. Biometrika. 1991;78:691–2.
44. Tonidandel S, LeBreton JM. Determining the relative importance of predictors in logistic regression: an extension of relative weight analysis. Organ Res Methods. 2010;13(4):767–81.
45. Tonidandel S, LeBreton JM. Relative importance analysis: a useful supplement to regression analysis. J Bus Psychol. 2011;26(1):1–9. 46. Chiu HC, Mau LW, Hsu YC, Chang JK. Postoperative 6-month and 1-year
evaluation of health-related quality of life in total hip replacement patients. J Formosan Med Assoc. 2001;100(7):461–5.
47. Yu YF, Yu AP, Ahn J. Investigating differential item functioning by chronic diseases in the SF-36 health survey: a latent trait analysis using MIMIC models. Med Care. 2007;45(9):851–9.
48. Perkins AJ, Stump TE, Monahan PO, McHorney CA. Assessment of differential item functioning for demographic comparisons in the MOS SF-36 health survey. Qual Life Res. 2006;15(3):331–48.
49. Gonzalez-Chica DA, Hill CL, Gill TK, Hay P, Haag D, Stocks N. Individual diseases or clustering of health conditions? Association between multiple chronic diseases and health-related quality of life in adults. Health Qual Life Outcomes. 2017;15(1):244.
50. Sprangers MA, Schwartz CE. Integrating response shift into health-related quality of life research: a theoretical model. Soc Sci Med. 1999;48(11):1507–15. 51. Razmjou H, Yee A, Ford M, Finkelstein JA. Response shift in outcome
assessment in patients undergoing total knee arthroplasty. J Bone Joint Surg Am. 2006;88(12):2590–5.
52. Zhang XH, Li SC, Xie F, Lo NN, Yang KY, Yeo SJ, et al. An exploratory study of response shift in health-related quality of life and utility assessment among patients with osteoarthritis undergoing total knee replacement surgery in a tertiary hospital in Singapore. Value Health. 2012;15(Suppl 1):S72–8. 53. Razmjou H, Schwartz CE, Yee A, Finkelstein JA. Traditional assessment of
health outcome following total knee arthroplasty was confounded by response shift phenomenon. J Clin Epidemiol. 2009;62(1):91–6.
54. Teresi JA, Fleishman JA. Differential item functioning and health assessment. Qual Life Res. 2007;16(Suppl 1):33–42.
Publisher’s Note