R E S E A R C H A R T I C L E
Open Access
Development and initial evaluation of a
treatment decision dashboard
James G Dolan
1*, Peter J Veazie
1and Ann J Russ
2Abstract
Background:For many healthcare decisions, multiple alternatives are available with different combinations of advantages and disadvantages across several important dimensions. The complexity of current healthcare decisions thus presents a significant barrier to informed decision making, a key element of patient-centered care.
Interactive decision dashboards were developed to facilitate decision making in Management, a field marked by similarly complicated choices. These dashboards utilize data visualization techniques to reduce the cognitive effort needed to evaluate decision alternatives and a non-linear flow of information that enables users to review information in a self-directed fashion. Theoretically, both of these features should facilitate informed decision making by increasing user engagement with and understanding of the decision at hand. We sought to determine if the interactive decision dashboard format can be successfully adapted to create a clinically realistic prototype patient decision aid suitable for further evaluation and refinement.
Methods:We created a computerized, interactive clinical decision dashboard and performed a pilot test of its clinical feasibility and acceptability using a multi-method analysis. The dashboard summarized information about the effectiveness, risks of side effects and drug-drug interactions, out-of-pocket costs, and ease of use of nine analgesic treatment options for knee osteoarthritis. Outcome evaluations included observations of how study participants utilized the dashboard, questionnaires to assess usability, acceptability, and decisional conflict, and an open-ended qualitative analysis.
Results:The study sample consisted of 25 volunteers - 7 men and 18 women - with an average age of 51 years. The mean time spent interacting with the dashboard was 4.6 minutes. Mean evaluation scores on scales ranging from 1 (low) to 7 (high) were: mechanical ease of use 6.1, cognitive ease of use 6.2, emotional difficulty 2.7, decision-aiding effectiveness 5.9, clarification of values 6.5, reduction in decisional uncertainty 6.1, and provision of decision-related information 6.0. Qualitative findings were similarly positive.
Conclusions:Interactive decision dashboards can be adapted for clinical use and have the potential to foster informed decision making. Additional research is warranted to more rigorously test the effectiveness and efficiency of patient decision dashboards for supporting informed decision making and other aspects of patient-centered care, including shared decision making.
Background
An important component of quality healthcare is patient-centeredness, defined by the Institute of Medicine as “…care that is respectful of and responsive to individual patient preferences, needs, and values and ensuring that patient values guide all clinical decisions” [1]. Despite its
importance, providing patient-centered care is a complex task that involves integrating clinical evidence, biomedical data, and other technical information with patients’ per-sonal preferences, circumstances, and values.
Patient decision aids are intended to facilitate this process. They are “evidence-based tools designed to pre-pare clients to participate in making specific and deliber-ated choices among healthcare options” [2]. Patient decision aids have been shown to increase patients’ know-ledge, reduce decisional conflict, and foster patient in-volvement in decisions about their care [2-4]. However, * Correspondence:[email protected]
1Department of Public Health Sciences, University of Rochester School of
Medicine & Dentistry, 265 Crittenden Blvd. CU420644, Rochester, NY 14642, USA
Full list of author information is available at the end of the article
despite these promising results and growing interest in their use, the most effective way(s) to design and build patient decision aids is unknown, their effect on out-comes is uncertain, and we do not know how to most effectively integrate patient decision aids into busy prac-tice settings [5-7].
A key challenge for patient decision aids is to help pa-tients make sense of new, unfamiliar information about alternative management strategies so that they can make informed judgments about which ones they prefer [8]. Increasingly, healthcare decisions involve multiple alter-natives with varying combinations of advantages and dis-advantages. The presentation of unfamiliar information can lead to an incomplete understanding of the decision task and the consideration of multiple alternatives across various attributes is a substantial cognitive load for deci-sion makers. Circumstances like these can cause people to make sub-optimal decisions or even avoid making a choice [9,10].
The need to quickly and effectively integrate large amounts of information across several dimensions is not unique to health care decisions. Busy decision makers in many different contexts face similar challenges. Ad-vances in cognitive science and computer technology have led to increasing interest in the use of interactive visual information displays to support decision making in these circumstances [11,12]. One of the first products of these activities is the computer-based, interactive de-cision dashboard. Interactive dede-cision dashboards are being increasingly used in business settings [13]. In healthcare, dashboards have been used to advance qual-ity improvement [14-17], medication safety [18], inten-sive care unit patient management [19], implementation and monitoring of mental health care guidelines [20], and patient wellness [21].
A decision dashboard is“…a visual display of the most important information needed to achieve one or more ob-jectives; consolidated and arranged on a single screen so the information can be monitored at a glance” [13]. The key components of decision dashboards include: a visual summary of decision-related information displayed in a single view, extensive use of graphical information dis-plays, and features that allow users to easily interact with and explore the information being presented. These com-ponents allow dashboards to quickly communicate infor-mation about the pros and cons of decision alternatives by reducing the cognitive effort required by structuring the decision, highlighting factors that merit consideration, making the information more evaluable by actively en-gaging well-developed human visual capabilities to help people process and understand information, and providing information in a non-linear format to facilitate its incorp-oration in decision making deliberations [12,13,22-29]. Additionally, because dashboards allow users to control
the extent and content of information displayed, they pro-vide a means for users to self-regulate information expos-ure and avoid overload in the face of large amounts of information [22]. Theoretically, clinical decision dash-boards that are properly formatted to take maximum advantage of inherent human visual and cognitive capabil-ities could provide a way to promote informed decision making effectively and efficiently [11].
The similarity between the purpose of a patient deci-sion aid and the functionality of interactive decideci-sion dashboards suggests the dashboard format could be a useful way to create decision aids capable of facilitating informed decision making about complex, unfamiliar healthcare issues and promoting patient-centered care in busy clinical settings. To our knowledge, however, the use of interactive dashboards to support clinical decision making has not been explored. The goal of this study was determine if the interactive decision dashboard for-mat can be successfully adapted to create a clinically realistic and feasible patient decision aid prototype suit-able for further refinement and evaluation.
Methods
Patient decision aids are complex health interventions. The objective of this initial study was to complete phases one and two - theoretical development and development of the intervention - of the five phase methodology for studying the effects of complex health interventions pro-posed by the British Medical Research Council [30,31].
Development of the prototype clinical decision dashboard
We based our clinical dashboard prototype on a patient decision aid regarding selection of non-opioid pain medication for treatment of osteoarthritis pain produced by the Agency for HealthCare Research and Quality (AHRQ) [32,33]. We chose this example because deci-sions regarding medication use, particularly for patients with chronic illnesses, are among the most common clinical decisions made and frequently depend on indi-vidual patient preferences and circumstances.
about possible cardiovascular side effects and medica-tion administramedica-tion issues such as the number of daily doses and when pain medications should be taken rela-tive to food and other drugs. Based on this information, we included the following medication characteristics in the prototype decision dashboard: effectiveness in re-lieving pain, risk of side effects, possibility of drug-drug interactions, out-of-pocket cost, and how the drug is administered.
To allow for comparisons between the dashboard prototype and the AHRQ brochure we included the same treatment options in the dashboard. Data needed to describe the drug choices relative to each decision cri-terion were obtained as follows:
We used the overall effect sizes from a meta-analysis published shortly before we created the dashboard prototype to summarize effectiveness [36]. We estimated side effect risks using information
obtained from the comparative effectiveness review that served as the basis for the AHRQ decision aid, a meta-analysis of osteoarthritis pain medications, and the MEDEX®drug database [33,36,37]. We defined low risk as no serious side effects and three or fewer common side effects, moderate risk as one to three serious side effects or four to ten common side effects, and high risk as either four or more serious side effects or more than ten common side effects. We obtained information about possible drug-drug
interactions from the Lexi-Comp Online™
Interaction Lookup database [38]. We defined low risk as no known interactions, moderate risk as interactions possible but not thought to be clinically important, and high risk as some interactions possible that could affect patient care.
Cost estimates, recommended dosing schedules, and routes of administration were obtained from the Tarascon Pharmacopoeia, Mobile version [39]. We
defined low cost as patient out-of-pocket expenses of $5 to $10 per month, moderate cost as $11 to $25 per month, high cost as $26 to $50 per month, and very high cost as monthly out-of-pocket expenses of more than $50.
Table 1 summarizes the treatment-related information included in the dashboard prototype. This information was current at the time of the study (2008–09). To avoid respondent bias due to past treatment experiences or name recognition, we identified the options on the dashboard using arbitrary letters rather than the actual drug names. Note that the data indicate that two op-tions, - non-steroidal anti-inflammatory drugs plus mi-soprostol and non-steroidal anti-inflammatory drugs and proton pump inhibitors - can be considered inferior choices because other treatment options are available that are better with respect to every medication charac-teristic being considered.
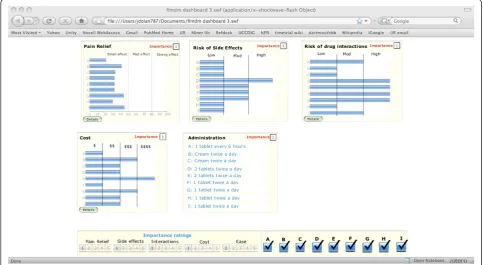
The main screen of the resulting dashboard prototype is shown in Figure 1. It consists of five windows that summarize the relative performance of the treatment al-ternatives with regard to each of the included drug in-formation categories: effectiveness in relieving pain, risk of side effects, possibility of drug-drug interactions, out-of-pocket cost, and how the drug is administered. But-tons for obtaining additional category-specific information are included within the window for every category except administration. There are also buttons at the bottom of the display that can be used to prioritize the importance of each drug information category in mak-ing a treatment choice and to determine which drugs are included in the display.
We designed the dashboard prototype following guidelines proposed by Few [13] and programmed it using Microsoft Excel and Crystal Xcelsius, a program designed to create interactive decision dashboards from Excelfiles [40,41].
Table 1 Drug-related information included in the dashboard
Drug (Dashboard abbreviation) Pain relief * Risk of side effects Risk of drug-drug interactions Cost Administration
Acetaminophen (a) 0.21 Low Moderate Low 1 tablet every 6 hours
Topical NSAID (b) 0.41 Low Low High Cream twice a day
Capsaicin (c) 0.30 Low Low Moderate Cream twice a day
NSAID + misoprostol (d) 0.32 High High Moderate 2 tablets twice a day
NSAID + PPI (e) 0.32 Moderate High Very High 2 tablets twice a day
NSAIDs (f) 0.32 Moderate High Low 1 tablet twice a day
Celecoxib (g) 0.44 Moderate High High 1 tablet twice a day
Chondroitin sulfate (h) 0.30 Low Low Moderate 1 tablet twice a day
Glucosamine sulfate (i) 0.45 Low Moderate Moderate 1 tablet twice a day
* - Pain relief summarized using reported effect size.
Prototype dashboard assessment
We tested the usability and effectiveness of the clinical dashboard prototype by recruiting study volunteers from nursing and secretarial staff working at Unity Faculty Partners (a general internal medicine resident/faculty teaching practice affiliated with Unity Health System in Rochester NY), patients from the same practice, Unity Hospital Department of Medicine support staff, and vol-unteers responding to a notice about the study posted on the University of Rochester Medical Center clinical trials website. The study was conducted over a three month period between February 12 and May 5, 2009.
After a brief introduction, study participants were asked to: a) imagine they had developed symptomatic osteoarthritis in their right knee that was interfering with their usual activities, b) that their physician had asked them to use the dashboard to review possible ini-tial treatment options in preparation for an upcoming appointment and choose a preferred medication, and c) after a brief instructional demonstration, to use it to help them identify a preferred treatment option. All par-ticipants individually reviewed the dashboard running on a personal computer equipped with a touch screen moni-tor in a private setting.
If a participant actually had arthritis, we asked them to make their treatment choice as if they had no arthritic problems other than the knee pain that was described. Otherwise, we instructed study participants to select a
preferred treatment option based on their actual per-sonal circumstances and preferences.
Evaluation
We evaluated the potential usefulness of the clinical dashboard format for creating clinically realistic and feasible patient decision aids using a multi-method pro-cedure that included observations of how the study par-ticipants used the dashboard, measures designed to assess ease of use, acceptability, and decisional conflict, and an open-ended qualitative analysis.
The observational data included the time the partici-pants spent using the dashboard before choosing a pre-ferred drug, which drug they chose, and whether they used three optional features included in the dashboard: the touch screen option, the priority boxes assigned to each consideration, and the opportunity to remove infor-mation about specific drugs from the dashboard display.
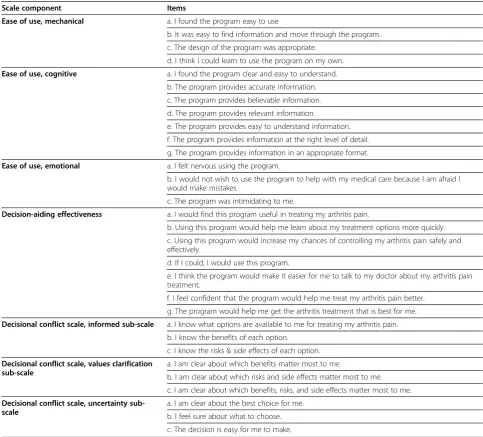
medical treatment decision context. The resulting scale in-cluded four component sub-scales: mechanical ease of use (4 items), cognitive ease of use (7 items), emotional diffi-culty (3 items), and decision-aiding effectiveness (7 items). Possible responses to all items consisted of a 7-point scale ranging from strongly disagree to strongly agree. Sub-scale scores were calculated using the mean item re-sponse. The resulting scale is shown in Table 2.
We assessed the effect of the dashboard on partici-pants’ decision making processes using the informed, values clarity, and uncertainty sub-scales from the deci-sional conflict scale modified to use a 7 rather than a 5 point scale to be consistent with the other assessment questions [44].
The qualitative analysis consisted of a series of open-ended questions exploring aspects of the participants’ experiences using the dashboard for the task of picking their preferred arthritis pain medication and to compare the dashboard with the conventionally formatted AHRQ booklet. The questions included in this phase of the ana-lysis are shown in Additional files 1 and 2.
We used participant self-reports to determine age, ra-cial background, and highest educational level attained. We measured health-related literacy and numeracy using the Rapid Estimate of Adult Literacy in Medicine (REALM), the subjective numeracy scale, and the Newest Vital Sign. The REALM is a test of word recog-nition that correlates well with other commonly used
Table 2 Quantitative outcome measures *
Scale component Items
Ease of use, mechanical a. I found the program easy to use
b. It was easy to find information and move through the program.
c. The design of the program was appropriate.
d. I think I could learn to use the program on my own.
Ease of use, cognitive a. I found the program clear and easy to understand.
b. The program provides accurate information.
c. The program provides believable information.
d. The program provides relevant information.
e. The program provides easy to understand information.
f. The program provides information at the right level of detail.
g. The program provides information in an appropriate format.
Ease of use, emotional a. I felt nervous using the program.
b. I would not wish to use the program to help with my medical care because I am afraid I would make mistakes.
c. The program was intimidating to me.
Decision-aiding effectiveness a. I would find this program useful in treating my arthritis pain.
b. Using this program would help me learn about my treatment options more quickly.
c. Using this program would increase my chances of controlling my arthritis pain safely and effectively.
d. If I could, I would use this program.
e. I think the program would make it easier for me to talk to my doctor about my arthritis pain treatment.
f. I feel confident that the program would help me treat my arthritis pain better.
g. The program would help me get the arthritis treatment that is best for me.
Decisional conflict scale, informed sub-scale a. I know what options are available to me for treating my arthritis pain.
b. I know the benefits of each option.
c. I know the risks & side effects of each option.
Decisional conflict scale, values clarification sub-scale
a. I am clear about which benefits matter most to me.
b. I am clear about which risks and side effects matter most to me.
c. I am clear about which benefits, risks, and side effects matter most to me.
Decisional conflict scale, uncertainty sub-scale
a. I am clear about the best choice for me.
b. I feel sure about what to choose.
c. The decision is easy for me to make.
health literacy measures. Results are reported as grade-level equivalents [45]. The subjective numeracy scale consists of eight items and does not require any calcu-lations. Scores range from 1 to 6 with higher scores in-dicating greater numeracy skills [46]. The Newest Vital Sign involves reading and interpreting information provided about the nutritional information of a con-tainer of ice cream. It has been shown to be a quick and reliable assessment of health literacy in primary care settings [47].
The study was approved by the institutional review boards of the University of Rochester and Unity Health System.
Data analysis
We summarized quantitative data using standard de-scriptive statistical methods and evaluated the qualitative data using a thematic approach. The reliability of the outcome questionnaires was assessed using Cronbach’s alpha. All statistical analyses were done using MedCalc 12[48].
Results
Study sample
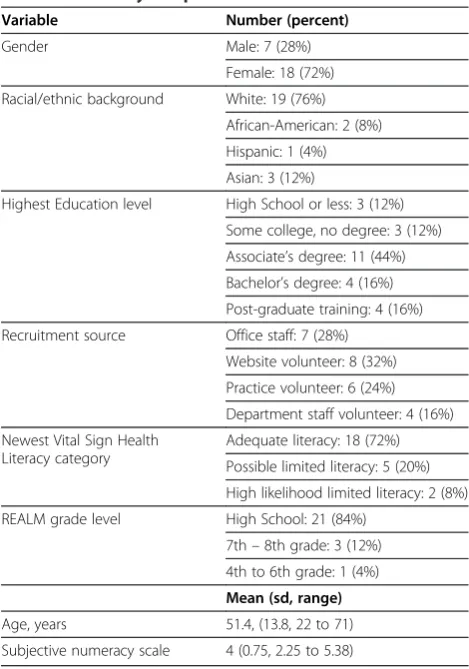
The characteristics of the study sample are summarized in Table 3. The majority were white women with at least an Associate’s degree and good to excellent literacy and numeracy skills. They were recruited in almost equal proportions from office and departmental staff, patient volunteers, and clinical trial website respondents.
Dashboard use
The average time participants spent interacting with the dashboard was 4.6 minutes (range 0.4 to 11.7). The most commonly used extra feature of the dashboard was the option to delete the display of information about indi-vidual treatment options which was utilized by 14 (56%) participants. The other extra features were used less often. Five (25%) participants used the importance boxes and two (10%) of twenty who had the opportunity to use a touchscreen used it instead of a mouse to interact with the dashboard. (A working touchscreen was not available for the other five participants).
Decision outcomes
The most commonly preferred drug was chondroitin sulfate, selected by 11 (48%) participants. The drug pref-erences of the other 14 participants were divided across six of the remaining eight options. Overall, seven (78%) of the nine treatment alternatives included in the dash-board were preferred by at least one participant. Only one patient selected an apparently inferior treatment choice (non-steroidal anti-inflammatory drugs and pro-ton pump inhibitor, NSAIDS + PPI).
Quantitative decision making process evaluations
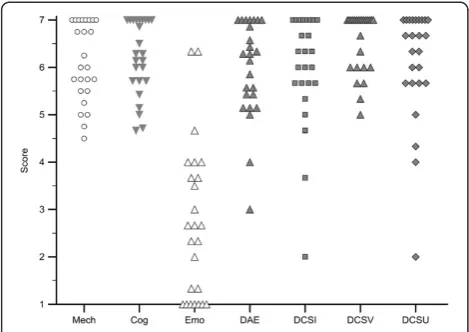
The results of the quantitative evaluation are summa-rized in Figure 2. Detailed results are included in a Add-itional files 1 and 2. The response rates were 100% for 17 (57%) of the 30 individual questions, 96% for 7 ques-tions, and 92% for the other 6. The responses are con-sistently positive for questions concerning mechanical and cognitive ease of use, decision aiding effectiveness, and effectiveness in reducing decisional conflict by pro-viding needed information, clarifying values, and easing uncertainty. There was no evidence of adverse emotional consequences. The Cronbach’s alpha coefficient for the 21-item adapted ease of use and acceptability scale was 0.90; for the three combined decisional conflict subscales it was 0.89.
Qualitative decision making process evaluation
All participants answered the open-ended questions. By and large, they reported finding the computerized dash-board easy to use and helpful in evaluating medication choices for osteoarthritis pain and, potentially, for treat-ment decision-making more generally. Participants appre-ciated the simplicity of the tool, the graphic display of information, and the ability to compare specific treatment Table 3 The study sample
Variable Number (percent)
Gender Male: 7 (28%)
Female: 18 (72%)
Racial/ethnic background White: 19 (76%)
African-American: 2 (8%)
Hispanic: 1 (4%)
Asian: 3 (12%)
Highest Education level High School or less: 3 (12%)
Some college, no degree: 3 (12%)
Associate’s degree: 11 (44%)
Bachelor’s degree: 4 (16%)
Post-graduate training: 4 (16%)
Recruitment source Office staff: 7 (28%)
Website volunteer: 8 (32%)
Practice volunteer: 6 (24%)
Department staff volunteer: 4 (16%)
Newest Vital Sign Health Literacy category
Adequate literacy: 18 (72%)
Possible limited literacy: 5 (20%)
High likelihood limited literacy: 2 (8%)
REALM grade level High School: 21 (84%)
7th–8th grade: 3 (12%)
4th to 6th grade: 1 (4%)
Mean (sd, range)
Age, years 51.4, (13.8, 22 to 71)
details and features via the side by side display (as well as the ability to“turn off” information they deemed person-ally irrelevant or unimportant). Some were surprised by the ways the dashboard revealed and helped prioritize their values regarding specific kinds of pain medication, their administration, and their cost.
Some respondents desired more evidence-based infor-mation about specific medications, including how long they had been in use, potential serious or long-term side effects, and how the drugs actually work in the body (in-cluding how quickly they take effect). Additionally, some questioned the source of the information (about the dif-ferent medications) displayed on the dashboard and its accuracy.
Uniformly, respondents expressed that they would like ultimate choices about their pain medication to be made in collaboration with a doctor. In other words, they would not want to rely on their own judgment, even if assisted by a brochure or a computerized aid, to come to treatment decisions. Rather, they saw the utility of the computerized aid as educational and preparatory for their discussions with a doctor which would lead to final decisions about treatment choices through a shared de-cision making process.
When asked to choose between using the dashboard and the AHRQ brochure as a decision aid, 12 (48%) par-ticipants preferred the dashboard, 5 (20%) preferred the AHRQ brochure, and 8 (32%) preferred a combined approach.
Discussion
These results suggest that the interactive decision dash-board format can be adapted to serve as a patient deci-sion aid. The majority of our study participants were able to use the clinical dashboard prototype to work through a complicated decision problem in a remarkably efficient manner with excellent results in terms of ease-of-use, information provided, clarification of decision-related values, resolution of uncertainty about the treat-ment choice, and overall usefulness. As demonstrated by the positive responses to the usability and decisional conflict scales, we did not find evidence that the dash-board induced information overload. In fact, partici-pants’ frequent use of the dashboard to eliminate less desirable options to focus attention on more promising alternatives suggests that the dashboard format provided a useful way for them to work through a large amount of information without being overwhelmed by it. There was no evidence of adverse emotional effects. A number of participants specifically commented that they found the dashboard display especially useful in identifying the key trade-offs involved in the decision, and 80% felt that a decision dashboard would be a valuable educational tool, either alone or in conjunction with complementary written material, to prepare them to participate in a shared decision making process with their health care provider.
These results are consistent with those of previous studies that have examined important features of the interactive dashboard format in isolation. Comparative studies have shown graphic formats more effective than numeric information for comparing the likelihoods of different outcomes, minimizing decision biases due to vivid anecdotal information, and promoting under-standing of information by patients, including those over 75 years of age [49-53]. These studies all provide evidence supporting the theoretical advantages of visual information formats for supporting human decision making processes. There is also evidence that data about alternatives presented in a single side by side view promotes more effective comparisons and differenti-ation among decision alternatives [8,54-56]. Finally, positive results have been found using patient decision boards - which are essentially static, non-interactive dashboards - to support clinical decision making in On-cology [57,58].
This study has several limitations. Because the deci-sion task involved a hypothetical situation, participant responses were not made in the context of making an actual clinical decision. The study sample was a small convenience sample of volunteers and the stability of their preferences was not assessed. Consequently, the re-sults of this study may not adequately reflect findings from the general patient population. Finally, we made no Figure 2Results of the quantitative decision making process
attempt to assess how to integrate a clinical decision dashboard into routine patient care. None of these limi-tations, however, negates the primary finding of the study, i.e., that the interactive dashboard format can be successfully adapted to create a patient decision aid cap-able of quickly and efficiently helping at least some people identify preferred decision alternatives based on a large amount of complex data.
It is important to note that this study was designed to assess the feasibility of creating a patient decision aid using the interactive dashboard format rather than to evaluate the effectiveness of this approach or examine treatment preferences for osteoarthritis pain. Conse-quently, additional research is needed to determine ef-fectiveness in a general patient population. Moreover, additional studies are needed to determine the amount and type of information clinical decision dashboards should contain, how to effectively involve busy prac-titioners in their use, and to explore the efficiency, ef-fectiveness, and cost-effectiveness of using interactive dashboards to support patient-centered shared decision making in routine practice settings.
Conclusions
In conclusion, these results suggest that an interactive clinical decision dashboard, either used alone or in con-junction with more traditional print-based reference ma-terials, has the potential to be an effective and efficient format for creating clinical decision aids capable of fos-tering informed patient decision making and patient-centered care.
Additional files
Additional file 1:Qualitative evaluation questions. Additional file 2:Results of evaluation questionnaire.
Abbreviations
AHRQ:Agency for Heathcare Research and Quality; UTAUT: Unified Theory of Acceptance and Use of Technology; REALM: Rapid Estimation of Literacy in Medicine; NSAIDS: Non-Steroidal Anti-inflammatory Drugs; PPI: Proton pump inhibitors.
Competing interests
The authors declare they have no competing interests.
Authors’contributions
JD conceived the study, helped design it and the dashboard prototype, collected and analyzed the non-qualitative data, and drafted the manuscript. PV helped conceive and design the study and assisted with manuscript preparation. AR helped conceive and design the study, performed the qualitative analysis, and assisted with manuscript preparation. All authors read and approved the final manuscript.
Acknowledgments
This study was supported by grant 0095–1 from the Foundation for Informed Medical Decision Making and grant number 1 K24 RR024198-02, Multi-criteria clinical decision support: A comparative evaluation, from the National Heart, Lung, and Blood Institute.
Author details
1
Department of Public Health Sciences, University of Rochester School of Medicine & Dentistry, 265 Crittenden Blvd. CU420644, Rochester, NY 14642, USA.2Department of Psychiatry, University of Rochester School of Medicine & Dentistry, 300 E. River Road, Box 278703, Rochester, NY 14627, USA.
Received: 4 October 2012 Accepted: 15 April 2013 Published: 21 April 2013
References
1. Committee on quality of health care in America, Institute of Medicine: Crossing the Quality Chasm: A New Health System for the 21st Century. Washington, D.C.: National Academy Press; 2001.
2. Stacey D, Bennett CL, Barry MJ, Col NF, Eden KB, Holmes-Rovner M, Llewellyn-Thomas H, Lyddiatt A, Légaré F, Thomson R:Decision aids for people facing health treatment or screening decisions.Cochrane Database Syst Rev2011, (10): CD001431. doi:10.1002/14651858.CD001431. pub3.
3. O’Connor AM, Wennberg JE, Legare F, Llewellyn-Thomas HA, Moulton BW, Sepucha KR, Sodano AG, King JS:Toward The“Tipping Point”: decision aids and informed patient choice.Health Aff2007,26:716–725. 4. O’Connor AM, Llewellyn-Thomas HA, Flood AB:Modifying unwarranted
variations in health care: shared decision making using patient decision aids.Health Aff2004,Suppl Variation:VAR63. 72.
5. Nelson WL, Han PKJ, Fagerlin A, Stefanek M, Ubel PA:Rethinking the objectives of decision aids: a call for conceptual clarity.Med Decis Making 2007,27:609–618.
6. Légaré F, Ratté S, Gravel K, Graham ID:Barriers and facilitators to implementing shared decision-making in clinical practice: update of a systematic review of health professionals’perceptions.Patient Educ Couns 2008,73:526–535.
7. Légaré F, Ratté S, Stacey D, Kryworuchko J, Gravel K, Graham ID, Turcotte S:
Interventions for improving the adoption of shared decision making by healthcare professionals.Cochrane Database Syst Rev2010,5.
8. Feldmanstewart D:Challenges for designing and implementing decision aids.Patient Educ Counseling2004,54:265–273.
9. Redelmeier DA, Shafir E:Medical decision making in situations that offer multiple alternatives.JAMA1995,273:302–5.
10. Hastie R, Dawes RM:Rational Choice in an Uncertain World: The Psychology of Judgment and Decision Making. Second edition.Thousand Oaks CA: Sage Publications, Inc; 2009.
11. Few S:Now you see it.Oakland, CA: Analytics Press; 2009.
12. Chen C:Information visualization.Wiley Interdisciplinary Rev: Computational Stat2010,2:387–403.
13. Few S:Information dashboard design.Sebastopol, CA: O’Reilly Media; 2005. 14. Conway WA, Hawkins S, Jordan J, Voutt-Goos MJ:2011 John M. Eisenberg
Patient Safety and Quality Awards. The Henry Ford Health System No Harm Campaign: a comprehensive model to reduce harm and save lives. innovation in patient safety and quality at the local level.Jt Comm J Qual Patient Saf2012,38:318–327.
15. Donaldson N, Brown DS, Aydin CE, Bolton MLB, Rutledge DN:Leveraging nurse-related dashboard benchmarks to expedite performance improvement and document excellence.J Nurs Adm2005,35:163–172. 16. Koopman RJ, Kochendorfer KM, Moore JL, Mehr DR, Wakefield DS,
Yadamsuren B, Coberly JS, Kruse RL, Wakefield BJ, Belden JL:A diabetes dashboard and physician efficiency and accuracy in accessing data needed for high-quality diabetes care.Ann Family Med2011,9:398–405. 17. Olsha-Yehiav M, Einbinder JS, Jung E, Linder JA, Greim J, Li Q, Schnipper JL,
Middleton B:Quality Dashboards: technical and architectural considerations of an actionable reporting tool for population management.AMIA Annual Symposium Proceedings2006:1052. 18. Waitman LR, Phillips IE, McCoy AB, Danciu I, Halpenny RM, Nelsen CL,
Johnson DC, Starmer JM, Peterson JF:Adopting real-time surveillance dashboards as a component of an enterprisewide medication safety strategy.Jt Comm J Qual Patient Saf2011,37:326–332.
19. Egan M:Clinical dashboards: impact on workflow, care quality, and patient safety.Crit Care Nurs Q2006,29:354–361.
21. Kailas A, Chong C-C, Watanabe F:From mobile phones to personal wellness dashboards.IEEE Pulse2010,1:57–63.
22. Hibbard JH, Peters E:Supporting informed consumer health care decisions: data presentation approaches that facilitate the use of information in choice.Annu Rev Public Health2003,24:413–33. 23. Ware C:Information visualization.2nd edition. San Francisco: Morgan
Kaufmann Publishers Inc; 2004.
24. Vessey I:Cognitive fit: a theory-based analysis of the graphs versus tables literature.Decis Sci1991,22:219–240.
25. Oppenheimer DM, Frank MC:A rose in any other font would not smell as sweet: effects of perceptual fluency on categorization.Cognition2008,
106:1178–1194.
26. Reber R, Schwarz N:Effects of perceptual fluency on judgments of truth.
Conscious Cogn1999,8:338–342.
27. Shah AK, Oppenheimer DM:Easy does it: the role of fluency in cue weighting.Judgment and Decision Making2007,2:371–379. KW. 28. Hansen J, Dechêne A, Wänke M:Discrepant fluency increases subjective
truth.J Exp Soc Psychol2008,44:687–691.
29. Reyna VF:Theories of medical decision making and health: an evidence-based approach.Med Decis Making2008,28:829–833.
30. Campbell M:Framework for design and evaluation of complex interventions to improve health.BMJ2000,321:694–696. 31. Craig P, Dieppe P, Macintyre S, Michie S, Nazareth I, Petticrew M:
Developing and evaluating complex interventions: the new Medical Research Council guidance.BMJ2008,337:a1655–a1655.
32. Choosing Pain Medicine For Osteoarthritis - Consumer Guide | AHRQ Effective Health Care Program.http://www.effectivehealthcare.ahrq.gov/repFiles/ Osteoarthritis_Consumer_Guide.pdf.
33. Chou R, Helfand M, Peterson K, Dana T, Roberts C:Comparative Effectiveness and Safety of Analgesics for Osteoarthritis. Comparative Effectiveness Review No. 4.Rockville, MD: Agency for Healthcare Research and Quality; 2006. Available at: http://www.effectivehealthcare.ahrq.gov/repFiles/ AnalgesicsFinal.pdf. 2006.
34. Fraenkel L, Bogardus ST, Concato J, Wittink DR:Treatment options in knee osteoarthritis: the patient’s perspective.Arch Intern Med2004,
164:1299–304.
35. Carnes D, Anwer Y, Underwood M, Harding G, Parsons S, on behalf of the TOIB study team:Influences on older people’s decision making regarding choice of topical or oral NSAIDs for knee pain: qualitative study.BMJ 2008,336:142–145.
36. Zhang W, Moskowitz RW, Nuki G, Abramson S, Altman RD, Arden N, Bierma-Zeinstra S, Brandt KD, Croft P, Doherty M, Dougados M, Hochberg M, Hunter DJ, Kwoh K, Lohmander LS, Tugwell P:OARSI recommendations for the management of hip and knee osteoarthritis, Part I: critical appraisal of existing treatment guidelines and systematic review of current research evidence.Osteoarthr Cartil2007,15:981–1000.
37. Zhang W, Moskowitz RW, Nuki G, Abramson S, Altman RD, Arden N, Bierma-Zeinstra S, Brandt KD, Croft P, Doherty M, Dougados M, Hochberg M, Hunter DJ, Kwoh K, Lohmander LS, Tugwell P:OARSI recommendations for the management of hip and knee osteoarthritis, Part II: OARSI evidence-based, expert consensus guidelines.Osteoarthr Cartil2008,16:137–62. 38. Lexi-Comp ONLINE.Login www.lexi.com.
39. Tarascon Pocket Pharmacopoeia Mobile Edition.Tarascon Publishing. http://www.tarascon.com/products/details.aspx/7381-6.
40. Excel.Redmond WA: Microsoft Corporation. 41. Xcelsius.Newtown Square, PA: SAP Corporation.
42. Venkatesh V, Morris M, Davis G, Davis F:User acceptance of information technology: toward a unified view.MIS Q,27:425–478.
43. Loiacono E, Watson R, Goodhue D:WebQual: an instrument for consumer evaluation of web sites.Int J Electron Commer2007,11:51–87.
44. O’Connor AM:Validation of a decisional conflict scale.Med Decis Making 1995,15:25–30.
45. Davis TC, Long SW, Jackson RH, Mayeaux EJ, George RB, Murphy PW, Crouch MA:Rapid estimate of adult literacy in medicine: a shortened screening instrument.Family Medicine1993,25:391.
46. Fagerlin A, Zikmund-Fisher BJ, Ubel PA, Jankovic A, Derry HA, Smith DM:
Measuring numeracy without a math test: development of the subjective numeracy scale.Med Decis Making2007,27:672–680. 47. Weiss BD, Mays MZ, Martz W, Castro KM, DeWalt DA, Pignone MP, Mockbee J,
Hale FA:Quick assessment of literacy in primary care: the newest vital sign.
Ann Fam Med2005,3:514–522.
48. MedCalc.Mariakerke, Belgium: MedCalc Software.
49. Feldman-Stewart D, Kocovski N, McConnell BA, Brundage MD, MacKillop WJ:
Perception of quantitative information for treatment decisions.Med Decis Making2000,20:228–38.
50. Feldman-Stewart D, Brundage MD, Zotov V:Further insight into the perception of quantitative information: judgments of gist in treatment decisions.Med Decis Making2007,27:34–43.
51. Waters EA, Weinstein ND, Colditz GA, Emmons K:Formats for improving risk communication in medical tradeoff decisions.J Health Commun2006,
11:167–82.
52. Fagerlin A, Wang C, Ubel PA:Reducing the influence of anecdotal reasoning on people’s health care decisions: is a picture worth a thousand statistics?Med Decis Making2005,25:398–405.
53. Fuller R, Dudley N, Blacktop J:Older people’s understanding of cumulative risks when provided with annual stroke risk information.Postgrad Med J 2004,80:677–8.
54. Meyer J, Shamo MK, Gopher D:Information structure and the relative efficacy of tables and graphs.Human Factors1999,41:570.
55. Speier C:The influence of information presentation formats on complex task decision-making performance.Int J Hum Comput Stud2006,
64:1115–1131.
56. Speier C, Morris MG:The influence of query interface design on decision-making performance.MIS Q2003:397–423.
57. Whelan T, LeVine M, Willan A, Gafni A, Sanders K, Mirsky D, Chambers S, O’Brien MA, Reid S, Dubois S:Effect of a decision aid on knowledge and treatment decision making for breast cancer surgery: a randomized trial.
JAMA2004,292:435–441.
58. Whelan T, Sawka C, LeVine M, Gafni A, Reyno L, Willan A, Julian J, Dent S, Abu-Zahra H, Chouinard E, Tozer R, Pritchard K, Bodendorfer I:Helping patients make informed choices: a randomized trial of a decision aid for adjuvant chemotherapy in lymph node-negative breast cancer.J Natl Cancer Inst2003,95:581–587.
doi:10.1186/1472-6947-13-51
Cite this article as:Dolanet al.:Development and initial evaluation of a treatment decision dashboard.BMC Medical Informatics and Decision Making201313:51.
Submit your next manuscript to BioMed Central and take full advantage of:
• Convenient online submission
• Thorough peer review
• No space constraints or color figure charges
• Immediate publication on acceptance
• Inclusion in PubMed, CAS, Scopus and Google Scholar
• Research which is freely available for redistribution