METHODOLOGY
Disease control programme support
costs: an update of WHO-CHOICE methodology,
price databases and quantity assumptions
Melanie Y. Bertram
*, Karin Stenberg, Callum Brindley, Jina Li, Juliana Serje, Rory Watts
and Tessa Tan‑Torres Edejer
Abstract
Background: Estimating health care costs, either in the context of understanding resource utilization in the imple‑ mentation of a health plan, or in the context of economic evaluation, has become a common activity of health plan‑ ners, health technology assessment agencies and academic groups. However, data sources for costs outside of direct service delivery are often scarce. WHO‑CHOICE produces global price databases and guidance on quantity assump‑ tions to support country level costing exercises. This paper presents updates to the WHO‑CHOICE methodology and price databases for programme costs.
Methods: We collated publicly available databases for 14 non‑traded cost variables, as well as a set of traded items used within health systems (traded goods are those which can be purchased from anywhere in the world, whereas non‑traded goods are those which must be produced locally, such as human resources). Within each of the variables, missing data was present for some proportion of the WHO member states. For each variables statistical or economet‑ ric models were used to model prices for each of the 194 WHO member states in 2010 International Dollars. Literature reviews were used to update quantity assumptions associated with each variable to contribute to the support costs of disease control programmes.
Results: A full database of prices for disease control programme support costs is available for country‑specific costing purposes. Human resources are the largest driver of disease control programme support costs, followed by supervision costs.
Conclusions: Despite major advances in the availability of data since the previous version of this work, there are still some limitations in data availability to respond to the needs of those wishing to develop cost and cost‑effectiveness estimates. Greater attention to programme support costs in cost data collection activities would contribute to an understanding of how these costs contribute to quality of health service delivery and should be encouraged.
© The Author(s) 2017. This article is distributed under the terms of the Creative Commons Attribution 4.0 International License (http://creativecommons.org/licenses/by/4.0/), which permits unrestricted use, distribution, and reproduction in any medium, provided you give appropriate credit to the original author(s) and the source, provide a link to the Creative Commons license, and indicate if changes were made. The Creative Commons Public Domain Dedication waiver (http://creativecommons.org/ publicdomain/zero/1.0/) applies to the data made available in this article, unless otherwise stated.
Background
Estimating health care costs, either in the context of understanding resource utilization in the implementation of a health plan, or in the context of economic evaluation, has become a common activity of health planners, health technology assessment agencies and academic groups. A critical component of health care costing is the
estimation of resource utilization linked to activities of a disease control programme aimed at supporting the quality of delivery or encouraging the uptake of a specific set of services, but which do not occur as part of direct service provision. Johns et al. [1] defined programme costs as those “incurred at the administrative levels out-side the point of delivery of health care to beneficiaries” and included categories of costs such as personnel, media and utilities. Other studies report on “above-facility-level” costs (e.g., Galarraga et al. [2]) as any relevant costs occurring at a higher administrative level than the facility
Open Access
*Correspondence: [email protected]
(i.e., district/provincial/national program management). Here, we expand the definition provided by Johns et al. and define programme support costs as costs that (a) reflect a set of activities that are specific to, and designed in relation to, a group of identified health interventions and/or technologies1 usually for the same disease/health condition and aimed at improving the quality of delivery or encouraging the uptake of services, and (b) incurred at an administrative level that is outside the point of delivery.
We define programme support costs are those which occur outside of direct service delivery, such as the drugs and tests associated with an intervention, but are not shared health system costs such as supply chain and infrastructure. Programme support costs are for those activities taking place at the national, district and prov-ince level which are directed towards enhancing the qual-ity of a programme, for example training, supervision visits and monitoring and evaluation. A programme is considered a set of interventions which contribute to the prevention and control of a common health outcome— for example, HIV, maternal and newborn health, non-communicable diseases.
Since its conception in 1998, the WHO-CHOICE pro-gramme has advocated the use of an ingredients based approach identifying all resources required to deliver a health care intervention, quantifying the resource requirements q and assigning a price to each resource p. The multiplication of p and q then gives us the cost.
WHO-CHOICE takes the costing perspective of “the health system”, by which is meant the ensemble of actions and actors whose primary intent is to improve human health. CHOICE therefore includes all direct, market-valued costs, whether public or private, that are required to deliver the intervention, regardless of payer. WHO-CHOICE does not account for non-monetary patient contributions such as travel time, time off work, or lost income—nor do we account for costs outside of the health system, such as the cost of social services whose aim is not primarily health oriented. So the costing per-spective of CHOICE is broader than the health sector per se, and is health system focused according to accepted international definitions of the health system. Other sec-tor costs (e.g. legislation) are included to the extent that they are a direct component of the intervention that is intended to improve human health.
Intervention costs are divided into patient and pro-gramme levels, and where relevant complemented by
1 Defined as the application of organized knowledge and skills in the form of devices, medicines, vaccines, procedures and systems developed to solve a health problem and improve quality of lives.
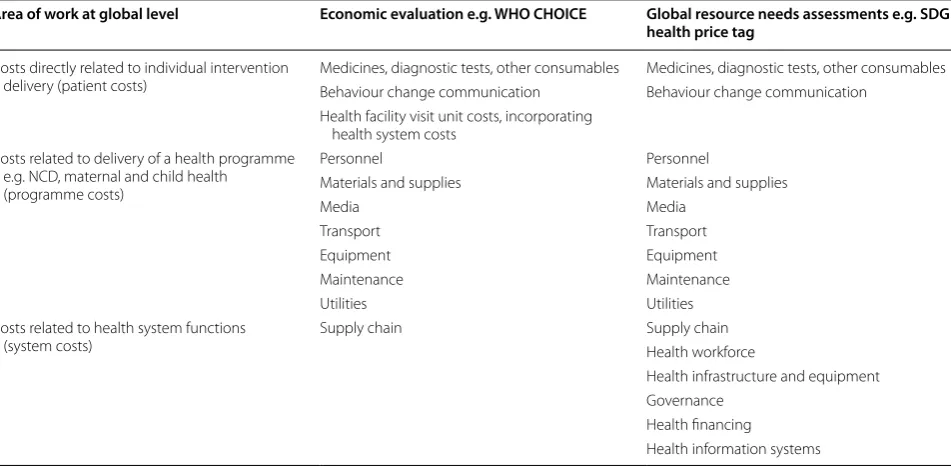
health system costs. The WHO-CHOICE programme cost database is primarily set up to support generalised cost effectiveness analysis (GCEA), but it is also used for other purposes such as the production of global resource needs assessments and investment cases, both of which require processing data for multiple interventions using a standardised format for p and q. WHO-CHOICE GCEA includes patient level costs incurred at the point of delivery, i.e., medicines, tests and health facility visits (including human resources); as well as programme sup-port costs which reflect the additional activities required to run a disease control programme, such as administra-tion, monitoring and evaluaadministra-tion, supervision, legislaadministra-tion, training and law enforcement (Table 1). The scope is defined by the need to do an economic evaluation of sin-gle interventions or combinations of interventions, there-fore only intervention-specific resources are considered for the GCEA.
Within WHO CHOICE, programme costs are included in GCEA as the comparison of single interventions is only the starting point. In constructing an expansion path, the programme costs will change as more inter-ventions are added to the pathway, creating a difference in marginal costs between each additional intervention. The only time when programme costs would not be rel-evant is in a marginal decision between two interventions which act within the same programme area—for example a choice between metformin and sulfonylurea for treat-ment of diabetes, where only the costs of the drugs dif-fer. Programme costs are important as they are part of the full cost of delivering the intervention. Without their inclusion the cost-effectiveness ratio calculated could be misleading.
A disease control programme within this context is a set of interventions addressing a common need (epide-miological or population group). Disease control pro-grammes may differ significantly in their cost drivers, with those aiming for behaviour change requiring more programme-level costs and less direct patient-level resources, e.g., tobacco control programmes. Similarly, interventions introducing new technologies may require more intense upfront investments in specific components such as training and supervision. Examining programme-level costs is therefore essential to understand the full resource need. In 2005 WHO-CHOICE produced a global price database to facilitate the estimation of pro-gramme costs, with a reference year of 2000, along with generic costing templates with quantity assumptions. While quantity assumptions are standardised, the data-base provides prices at the level of WHO region2 and
2 WHO geographical regions are described here http://www.who.int/about/
countries for a range of goods such as salaries, utilities, transportation, telecommunications, media and consum-ables. Many analysts still rely on the WHO-CHOICE price databases and estimates of quantity assumptions for programme cost estimation.
In 2013 a process to update the WHO-CHOICE price database, to a reference year of 2010, along with a review of the quantity assumptions, was started. This paper reports the data sources and methodologies used in the update of the price databases, the new quantity assump-tions and suggested scaling factors for programme support costs based on the number and coverage of interventions delivered by a programme.
This paper seeks to achieve two aims: (i) to describe the methods used to derive updated estimates for prices of inputs that go into programme costs; and (ii) to define the scope of a set of programme costs that go with a WHO-CHOICE CEA application, and describe new quantity assumptions for the typical WHO-CHOICE CEA application, including newly developed scaling factors.
Methods
The starting point of the 2010 update of the price data-base was a review of the 2000 datadata-base, including data sources and methodology. Table 2 replicates the cost categories reported on in the 2003 publication [1]. This article reports on data used for the estimation of the data points in Table 2 with the exception of personnel costs which are reported separately. In an advance from
the earlier methodology, prices are now reported at the country level rather than the regional level.
Estimation of price databases
For each data point, we searched the internet to identify global price databases covering as many WHO mem-ber states as possible. This section reports, for each data point, the data reported in the WHO-CHOICE price database and the methodology used to extract data and estimate missing values.
WHO member state meta‑data
The database contains the following general information on each WHO member state:
• WHO region.
• Population.
• Total GDP.
• World Bank income level classification.
• USD exchange rate and GDP deflators.
• Number of administrative divisions within each member state.
• Number of certain types of healthcare facilities including health posts and hospitals.
• Density of health care facilities per 100,000 people.
The general information including population, GDP and price deflators for each WHO member state is sourced from WHO’s Global Health Expenditure Database [3]. The number of administrative divisions is taken from
Table 1 Scope of programme support costs vis-a-vis other cost categories within two types of WHO-CHOICE analysis Area of work at global level Economic evaluation e.g. WHO CHOICE Global resource needs assessments e.g. SDG
health price tag
Costs directly related to individual intervention
delivery (patient costs) Medicines, diagnostic tests, other consumablesBehaviour change communication Medicines, diagnostic tests, other consumablesBehaviour change communication Health facility visit unit costs, incorporating
health system costs Costs related to delivery of a health programme
e.g. NCD, maternal and child health (programme costs)
Personnel Personnel
Materials and supplies Materials and supplies
Media Media
Transport Transport
Equipment Equipment
Maintenance Maintenance
Utilities Utilities
Costs related to health system functions
(system costs) Supply chain Supply chainHealth workforce
Health infrastructure and equipment Governance
Health financing
the website Statoids: Administrative Divisions of Coun-tries [4]. The terminology first sub-national division and second sub-national division is used to allow for differ-ences in nomenclature for administrative divisions. These sub-national divisions may differ considerably in terms of geographical size and population depending on the country. The number and density of health care facilities is taken from WHO’s 2013 Country Survey on Medical Devices and Health Care Facilities [5], and may include both public and private sector facilities. Unlike elsewhere in this update, the information on healthcare facilities is based on data for the year 2013 rather than 2010, due to the year of data availability. The year on which the infor-mation on administrative divisions is based also varies. This information, which is sourced from the website Sta-toids: Administrative Divisions of Countries, uses the most recent national survey and usually dates to sometime in the past 5–6 years. Missing data were imputed using itera-tive robust model based imputation [6].
Travel allowance and per diem rates
The database contains for each WHO Member State a daily subsistence allowance and accommodation rate in USD at 2010 prices for the capital city and a lower and upper range for other parts of the country where avail-able. The average daily cost of living rates for a number of cities was calculated from an online database of cost of living values on numbeo.com [7]. These data points were compared to travel allowance and per diem rates sourced from the International Civil Service Commission (ICSC) DSA Circular Report for July 2010 [8]. The local cost of living rates from numbeo approximated 20% of the ICSC travel allowance and per diem rates, thus a scaling factor of 0.2 was applied to the ICSC rates to approximate local per-diem values. A further 5% of the value was added to account for economic costs associated with meetings, such as room hire fees. The ICSC database provides per diems for all WHO member states, thus no estimation of missing values was required.
Table 2 Cost categories required for programme costing
A. Recurrent cost
A.1 Personnel Personnel time allocated to each intervention is assessed from time spent by those personnel in other inter‑ ventions. Personnel time used in the start‑up and post start‑up periods is expressed in person‑months A.2. Materials and supplies Materials and supplies in terms of the quantities used for the programme. Examples are office supplies (e.g.
stationary) that are used by the programme
A.3. Media operating costs Media inputs such as radio or television time, leaflets or posters are provided in terms of their unit of measure‑ ment (e.g. minutes for radio, or quarter page ads in newspapers)
A.4. Transport operating costs Transport is measured in terms of total kilometres travelled per mode of transport
A.5. Equipment operating cost In cases where equipment is rented, the amount of equipment and the duration of rental (in months) are reported
A.6. Maintenance Maintenance costs are listed as a percentage of annual costs
A.7. Utilities The amounts of utility items allocated to the programme are listed here. Examples of utility items are electric‑ ity, gas, and water. The allocation of the quantities used by the programme is based on the square meter surface area used by the programme, then applying any further allocation needed if the space is shared with other programmes
A.8. Others
A.8.1. Rented buildings In case where buildings are rented, both the total square meter surface area of the buildings and the duration of rental (in months) are used
A.8.2. Per diems and travel allow‑
ances The types of personnel who are entitled for per diems and travel are listed. The types reflect the activity they are involved in, e.g. trainers, trainees, support staff in meetings, participants of meetings, supervisors visiting health facilities etc. Reported by the number of days per type of personnel
A.8.3. Miscellaneous items Any other category of recurrent resources used that is not provided in the list are reported here by identifying the item and the quantities used
B. Capital costs
B.1. Building Spaces used by the programme are reported in terms of the total square meter surface area allocated to that programme, i.e., if a space used by the programme is shared with other activities, the share of the space used for the programme under study is estimated and the value is entered here
B.2. Transport The number of modes of transport used by the programme is listed here. If they are only partly used, the estimated share of their use are entered
B.3. Equipment and implements The quantity of office equipment, storage and distribution, maintenance, cleaning and other capital equip‑ ment are reported here. If they are only partly used, appropriate allocation is made, using the same alloca‑ tion factors used for building space
B.4. Furniture See point B.3 above
Vehicle and transportation costs
The database contains new vehicle costs for several modes of transport used in the field for health interven-tions, including sedans, four-wheel drives, utility trucks, motorcycles, mini-buses and refrigerator vehicles. The database also includes their approximate per kilome-tre operating costs. Prices and vehicle specifications for a set range of vehicles were sourced from UNOPS curement website, UN Web Buy [9]. These prices pro-vided are roughly illustrative of the market prices faced by medium-sized international organisations or govern-ments of low-income countries. Where available, ex-stock prices were selected over ex-factory prices since they are closer to the final price paid by the buyer. Specifically, they include free carrier charge to move the vehicle to a port ready for export. Freight, insurance and customs duties to export the vehicle are not included in the price because they are likely to vary significantly between des-tination countries. Operating cost per kilometre is esti-mated as the sum of the following three expenses.
1. Fuel economy = fuel price/L × fuel consumption/ km.
2. Tyre cost/km = cost of four new tyres/average lifes-pan of tyre in km.
3. Cost of basic maintenance/km (0.5% of new vehicle value/20,000 km).
Fuel price was sourced from the World Bank Indica-tor database [10], fuel consumption level/km from the US Environmental Protection Agency [11], and tyre costs and tyre lifespans were estimated with reference to auto-motive websites such as Michelin and Dunlop. Missing data were imputed using Iterative Robust Model Based Imputation [6].
Cold chain storage and distribution
The database contains the costs of an assortment of cold-chain equipment and devices relevant to health interven-tions. The list of cold-chain equipment and devices was compiled based on the general requirements of immu-nisation programmes, which use cold-chain storage and distribution extensively. As such, these products can also be applied to other disease control programmes requir-ing cold-chain management. The list was prepared in consultation with the WHO prequalification team (PQT) and with reference to:
• WHO (2002) Guidelines for Estimating Costs of Introducing New Vaccines into the National Immu-nization System [12].
• WHO’s Performance, Quality and Safety (PQS) Cata-logue [13] and,
• UNICEF’s Supply Catalogue [14].
These cold-chain products are relevant in a variety of contexts, such as different climates and varying health care infrastructure quality. Where a product, such as a cold room or cold box, might have several models vary-ing in characteristics such as size, a svary-ingle representative model, which is of high quality and value for money, is listed for simplification. This choice was made in con-sultation with WHO PQT. As of December 2013, all of these products were pre-qualified under WHO’s PQS system. The prices of the specified models were col-lected from WHO’s PQS Catalogue and UNICEF’s Sup-ply Catalogue. The prices in these catalogues are listed in principal international currencies such as USD, EUR and CHF. In most cases, a price year was also included which varied from 2007 to 2013. Non-USD prices were converted into USD using the WHO’s Global Health Expenditure Database exchange rate for years up to 2011 [3]. For the price years 2012, 2013, and those that were unknown, the World Bank’s average exchange rate for 2012 was used. When different prices for the same prod-uct were listed in the WHO and UNICEF catalogues, the WHO listed price was used. The inclusion of specific products in this list is for the purpose of more accurately estimating the costs of inputs using a consistent meth-odology across programmes. In no way does this imply an endorsement or promotion of the companies making these products.
Power generation and utility prices
The database contains the costs associated with power generation and general utilities for electricity (via mains power, diesel generators and solar panels) and water.
The electricity dataset contained data for only 26% of WHO Member States, thus it was not suitable to be included in the Iterative Robust Model Based Imputation. Instead, a simple linear regression using GDP/capita as the explanatory variable was used to estimate missing values.
Data on water prices was sourced from the Global Water Intelligence (GWI) Survey, conducted in August, 2011 [16]. The GWI survey includes water and waste-water prices from 309 cities in 106 countries and is the most comprehensive single source of information on water prices. The price of water/m3 in the local currency
is calculated based on the use of 15 m3 of water/month
and converted to USD. For further information see the GWI survey’s methodology. A water price for each coun-try in the GWI survey was compiled based on the average price of water in its surveyed cities. This national price for 2011 given in USD was converted into a 2010 price using the survey’s available information about the pre-vious year’s price increases. The dataset covered 52% of WHO Member States, and the Iterative Robust Model Based Imputation was used to estimate missing values.
Telecommunication data
The database contains 14 telecommunications variables:
• Fixed (wired) broadband connection charge in USD.
• Fixed (wired) broadband monthly subscription charge.
• Monthly subscription for business telephone service (USD).
• Installation fee for business telephone service.
• Price of a 3-min local call to a fixed-telephone line (peak rate),
• Price of a 3-min local call to a fixed-telephone line (off-peak rate),
• Mobile prepaid—1-min local call (off-peak, on-net-work).
• Mobile-prepaid—1-min local call (peak, on-net-work).
• Mobile prepaid—1-min local call (peak, to fixed).
• Mobile prepaid—1-min local call (off-peak, to fixed).
• Mobile prepaid—price of SMS (on network).
• Mobile prepaid—1 min local call (off-peak, off-net).
• Mobile prepaid—1 min local call (peak, off-net).
• Mobile prepaid—SMS (off-net).
Data was obtained from the International Telecommu-nications Union (ITU) Information, Communication and Technology (ICT) indicators database [17], with data for the period 2008–2012 used in this analysis. Between 13 and 42% of values were missing for each variable. Multi-ple imputation by chained equations was used to fill miss-ing values, so that data was available for each country. An
econometric pricing model was then developed for each telecommunication variable, using a system generalized method of moments approach for dynamic panel mod-els. The data presented in the WHO-CHOICE dataset are modelled data from the econometric pricing model, and thus may differ from those presented in the ITU dataset. Further information on the estimation of this dataset is available in the Masters Thesis [18].
Office supplies
The database contains costs associated with office fur-niture and supplies such as stationery and basic ICT hardware. The list of office supplies, ICT equipment and furniture was prepared by considering the basic resources required to operate a small office. If necessary, these resources were treated as tradable goods that could be imported at a cheaper price than what is locally avail-able. The costs of the office supplies and furniture were sourced from the 2014 Global Supply Catalogue of the US General Services Administration (GSA), which is accessible to US government agencies and eligible NGOs and International Organisations including the United Nations [19]. Using this source has the following benefits:
• Prices are based on a competitive procurement pro-cess and economies of scale.
• Reliable supply of goods at stated price is guaranteed.
• Large range of goods are costed from a single, up-to-date source.
• Prices listed included freight and insurance to desti-nation port.
Advertising
The average costs of advertising could not be found for any set of countries despite an extensive search. Most information publicly available pertains to estimates of the value of different segments of the advertising indus-try. That is, the revenue that it raises. The key publication on this is the PricewaterhouseCoopers (PWC) annual report, Global Entertainment and Media Outlook [20].
In 2000 an econometric model estimating advertis-ing prices (per 30 s of TV or radio time, per half page newspaper advertisement and per A4 page printed) as a proportion of GDP/capita was created. No new data was available to contribute to an updated econometric model, thus this model was applied to 2010 GDP/capita by coun-try to estimate updated media prices.
Estimation of quantity assumptions
Administration requirements
Despite recent strong focus on planning for Human Resources for Health, there is scant quantitative evidence on staffing requirements. At a minimum, WHO has esti-mated 4.45 “health workers” (doctors, nurses and mid-wives) per 1000 population will be required by the end of the SDG period [21]. However, these ratios do not touch on broader policy, administrative, training etc. related to health personnel. For staff requirements at the program-matic level (administration, management etc.) we use a combination of assumptions from a costing study carried out for the 2005 World Health Report and a 2008 NCD costing study undertaken within WHO [22, 23]. Both studies used expert groups to gain consensus around staffing requirements and ratios.
Materials and supplies (e.g. consumables such as sta-tionary) build off of previous WHO-CHOICE estimates with some important updates. Assumptions around computer storage devices have been updated in line with current technology. However, computer and printing equipment assumptions have remained constant, includ-ing useful life of devices, ratio of printers and photocopi-ers required per pphotocopi-erson. Also important to note is that computer prices have not increased in line with inflation. Again, there were no quantitative references available to base the quantity assumptions for this section of the pro-gramme support costs; therefore expert assumption and consensus was the basis for the quantity assumptions.
Utilities
In line with the previous WHO CHOICE methodology, quantity assumptions for electricity are based on 3 peo-ple occupying a work space using an average of 64 kWh/ month. Water consumption is assumed at 10 m3/office of
3 people/year. Telephone calls are assumed as 2 calls/per-son/work day [1].
Information, education and communication (IEC)
Radios are present in at least 75% of households in devel-oping countries [24]. Radios account for 86% of listen-ing to an audio platform, with the remainder belisten-ing web based or satellite radio [25]. Online searches indicate that in order to impact individuals, an advertisement needs to be heard between 5 and 7 times [26]. In order to calculate how many times to run an advertisement to reach listen-ers with this frequency, the following formula is proposed [27].
Quarter hour listeners/Cumulative weekly listeners = X
Frequency of hearing required/X
= number of times to run the spot
In order to use this data for our quantity assumptions, we require data on listenership for each of the regions included in our analysis, or average listenership in low and middle income countries.
Radio ownership and listenership was found for a selection of African countries. Similar data have not been identified for other global regions, so the assumptions are based on Africa alone. The amount of time/day that each person listens, on average, was not identified. Calcula-tions for the number of advertising minutes required are based on the assumption that 56–78% of people listen to the radio daily [28]. We assume each person listens for at least 60 min/day, and that there were 12 h/day within which an individual could listen to the radio. Between 87 and 90% of people own a radio.
Thus a radio advertisement of 30 s, played 82 times/ week would achieve the required listenership over the 30 day schedule as recommended in the marketing literature.
The same information applies to television as radio advertising—individuals need to see an advertisement five times to remember it. Television ownership in low and middle income countries is lower than radio own-ership; however, this statistic has large variation across regions. We assume the same intensity is required but that the proportion of the population reached is lower than for radio advertisements due to lower ownership.
Supervision
Supervision is carried out for the programme as a whole. The staff carrying out supervision visits are those whose wages are already accounted for in the human resources segment. We assume each province, district and facility is visited twice per year for 2 days at a time.
Training
At the programme level the model assumes that each programme conducts one in-service/refresher training at the provincial level per year, and one per district every 3 years. A training of trainers workshop is required each year. Specific interventions, such as newly implemented interventions, may require more intense training but we assume these costs to be analysed as part of the interven-tion implementainterven-tion cost.
Vehicles
Scaling of programme and delivery costs to account for economies of scale and scope
Scaling programme support costs by number of interventions We make the assumption that a programme running at full capacity can support the implementation of ten inter-ventions at full coverage. This assumption is based on the experience of the authors working in countries develop-ing costed national health plans. No literature was found in support of such an assumption, thus country users of the methodology are strongly encouraged to evaluate the appropriateness of this assumption in their setting. If running at a lower capacity, the human resources, vehi-cles and office running costs are reduced. We assume that to implement a single intervention, 30% of these resources would be required, with a linear increase to 100% resource requirement for ten interventions. Follow-ing the 10th intervention a marginal 3% increase is added for each additional intervention. Costs for training and supervision are assumed to be constant regardless of the number of interventions delivered.
Scaling programme support costs by coverage (current, 50,80,95)
We assume that human resource and office running costs remain constant regardless of the coverage level of interventions delivered by the programme however are influenced by the quantity of interventions delivered by the programme. In-service training and training of train-ers are scaled to coverage. This assumes clients seeking care will be seen by the right trained health worker when they access health services—e.g., as in a geographically targeted scale-up. However, development of training programmes and materials remains a fixed investment at 100% regardless of coverage level. Supervision visits to staff are scaled to coverage (i.e. fewer visits are required for lower capacity, as fewer patients are seen). All other costs are assumed to remain at 100% regardless of the coverage level.
Scaling costs of drugs to account for supply chain costs Supply chain costs per se are not theoretically covered under programme support costs, but the WHO-CHOICE model for GCEA applies a mark-up ratio in order to cap-ture these health systems costs as part of this economic evaluation. We assume a constant supply chain multiplier regardless of coverage level, as we were not able to find adequate evidence of increasing logistical costs as cover-age increases. We apply the multipliers below based on data reported for countries which are deemed to have a fairly well functioning systems [29]. Overall commodities (other than ITNs): apply 13% mark-up.
• ITNs: apply 26% mark-up (as they are more bulky).
• Cold chain costs: apply an additional 6%.
Results
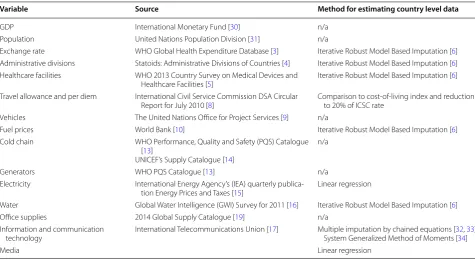
Table 3 shows a summary of data sources and method-ologies used in the estimation of the programme cost-ing database. The full database is contained in Annex 1 to this paper, and available for download online at http:// www.who.int/choice/costs/en. The data is presented at the country level for 194 WHO member states.
The main imputation dataset contained 24 variables, of which 9 had complete data available and 15 had var-ying levels of missingness. The first step in the analysis was to correlate all variables with missing data against the 9 complete observations, to test the relationship of the missing variable against the complete variables. This indicated that there was a lack of consistent correlation against the 9 complete variables, such as GDP/capita, population size and area. This implied that the use of lin-ear regression or conditional mean to impute variables was not an ideal estimation method. Of the options avail-able related to missingness, missing completely at ran-dom was considered too strong an assumption as this is rarely the case in real world data, and missing not at ran-dom was not felt to be a valid assumption as there was no systematic appearance to the missing data. Thus missing at random (MAR) was assumed.
Following imputation, the upper and lower bounds along with the mean value of the observed data was com-pared to the completed dataset for each variable. We observed consistency between the observed and com-pleted datasets for all three metrics, indicating the impu-tation method is acceptable. In a further test, we checked the conditional distribution assumption of each variable with missing values—each variable containing missing values is normally distributed conditional on all the other variables. To test this, we regressed the observed part of one variable on the corresponding values of the other variables in the completed dataset. The residuals for all the variables that went through this test turned out to be approximately normal, indicating our assumptions had been met.
assumptions. The file differentiates between ongoing costs (expected to occur each year to maintain a current level of service) and set-up costs (costs that are associ-ated with the introduction of a new programme or with the scaling up of an existing programme). This calcula-tion workbook is used in the computacalcula-tion of programme support costs for WHO-CHOICE GCEA analyses. It also maps to the programme costing menus in the OneHealth Tool (http://who.int/choice/onehealthtool/en/), enabling compatibility between the two tools.
Note that this workbook is designed for the express purpose of calculating programme support costs for use in economic evaluation. Applying the calculation work-book as used in the computation of programme support costs for WHO-CHOICE GCEA analyses for a global price tag would not be appropriate since it computes eco-nomic costs, and not financial costs. Thus, capital invest-ments are annuitized within the calculation workbook whereas the WHO global price tags do not annuatise such costs since doing so would not adequately illustrate financial outlays for capital purchases, which may form a considerable share of start-up costs.
For a hypothetical country in Asia of 20 million peo-ple, with a GDP/capita of approximately $2300 USD, Fig. 1 shows the programme support costs as calculated using this approach for a generic programme, including the scaling based on number of interventions and cover-age level. The programme support costs differ between
diseases due to intensity of training, supervision and media campaigns.
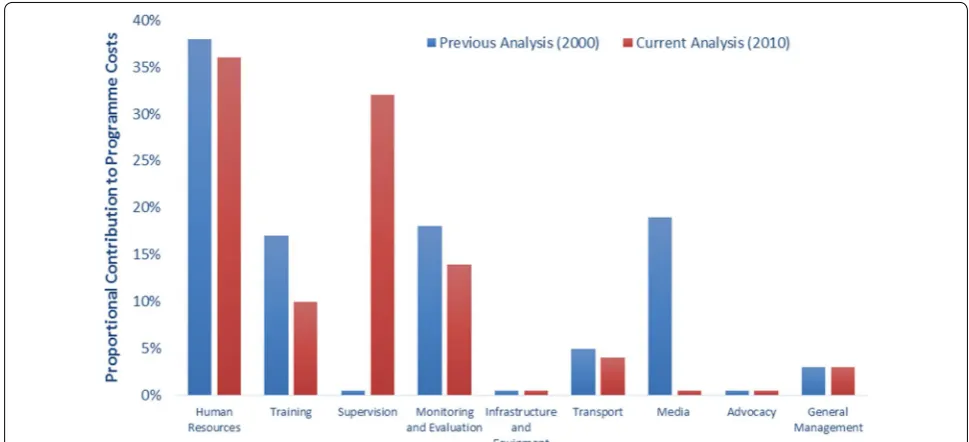
Comparing the analysis of programme support costs to the previous analysis from 2000 (expressed in GDP-inflated 2010 USD), both similarities and differences are present (Fig. 2). Firstly, programme specific human resource costs have remained consistent at almost 40% of the overall cost. Due to their major contribution, and the expert opinion used to define quantity assump-tions, a sensitivity analysis was undertaken on the quan-tity data. If human resource requirements are half of
Table 3 Summary of data sources and methodology for missing value imputation
Variable Source Method for estimating country level data
GDP International Monetary Fund [30] n/a
Population United Nations Population Division [31] n/a
Exchange rate WHO Global Health Expenditure Database [3] Iterative Robust Model Based Imputation [6] Administrative divisions Statoids: Administrative Divisions of Countries [4] Iterative Robust Model Based Imputation [6] Healthcare facilities WHO 2013 Country Survey on Medical Devices and
Healthcare Facilities [5] Iterative Robust Model Based Imputation [6] Travel allowance and per diem International Civil Service Commission DSA Circular
Report for July 2010 [8] Comparison to cost‑of‑living index and reduction to 20% of ICSC rate Vehicles The United Nations Office for Project Services [9] n/a
Fuel prices World Bank [10] Iterative Robust Model Based Imputation [6] Cold chain WHO Performance, Quality and Safety (PQS) Catalogue
[13]
UNICEF’s Supply Catalogue [14]
n/a
Generators WHO PQS Catalogue [13] n/a
Electricity International Energy Agency’s (IEA) quarterly publica‑
tion Energy Prices and Taxes [15] Linear regression
Water Global Water Intelligence (GWI) Survey for 2011 [16] Iterative Robust Model Based Imputation [6] Office supplies 2014 Global Supply Catalogue [19] n/a
Information and communication
technology International Telecommunications Union [17] Multiple imputation by chained equations [System Generalized Method of Moments [3234, ]33],
Media Linear regression
Fig. 1 Programme support costs by coverage level, for a hypothetical
that estimated, the contribution to overall costs would decrease to approximately 20%, whereas doubling the quantity needs would increase human resources to 55% of total programme support costs. Media costs have reduced significantly, previously representing almost 20% of total costs and now 0.5%. This difference is driven by a conceptual change in WHO-CHOICE methodology. In 2000, media costs associated with a behaviour change communication intervention—i.e. those which have a direct impact on health outcomes—were included as pro-gramme costs, now they are considered intervention spe-cific costs for GCEA and calculated as such, for example so that a mass media campaign to prompt smoking cessa-tion is regarded as an individual intervencessa-tion. We made this change to foster “fair comparisons” when undertak-ing economic evaluation of media-intensive behaviour change interventions compared with other interventions which include only basic programme advocacy costs. Media costs now included in programme support costs are for basic advocacy purposes only. Monitoring and evaluation costs have dropped in overall share, however, supervision has increased sharply. Previously, supervision costs were incorporated into human resource and trans-portation costs. With a growing body of evidence that highlights the important contribution of supervision to programme success, it is now being calculated explicitly. These types of changes in conceptual thinking, as well as a combination of changing prices and quantity assump-tions, make drawing overall conclusions on comparability between the databases and analyses uninformative.
Discussion
All data modelled by WHO-CHOICE is available for download from the website http://www.who.int/choice and is available as an Annex to this paper. A tool to undertake programme costing, incorporating the quan-tity assumptions in this paper is also available. Estimates are specific to each country and should be considered as normative, global costs that have not been validated by countries.
This work represents the most comprehensive update of the WHO-CHOICE programme costing prices and quantity assumptions since they were first published in 2003. Between 2000 and 2010, global prices have under-gone substantial changes, and continuing to inflate prices from 2000 to the present ignores underlying changes in cost structures that can be complex. Given the substan-tial contribution programme costing can have on the total resource allocation for implementing health care interventions, ideally data such as these would be con-tinually updated to keep track with these changes in the global economy.
Compared to the 2000 estimates, a greater amount of data was able to be sourced from online databases, with econometric or statistical models used to generate miss-ing values. However, for some variables, such as media and construction, freely available global databases do not exist. The development of a global database report-ing prices and quantity assumptions collected in costreport-ing studies would be a helpful contribution to future updates of this work.
Fig. 2 Share of total programme costs contributed by major categories, for a hypothetical country in Asia of 20 million people, with a GDP/capita of
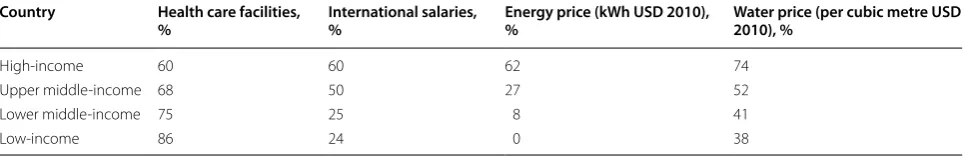
Despite major advances in the availability of data since the previous version of this work, there are still some limitations in data availability to respond to the needs of those wishing to develop cost and cost-effectiveness esti-mates. Firstly, global price databases on prices present missing values for up to 60% of countries, with many of the gaps seen in low income countries, where the great-est need for accurate cost data is present (Table 4). This increases the uncertainty in estimating country specific prices and reduces methodological consistency across the data points within each cost category. Secondly, not all data points that would be desired are available in accessible databases, with high access costs associated, thereby limiting the ability of researchers to access the data. Thirdly, limited information exists regarding quan-tity assumptions of human resources needed to support the implementation of health care programmes. Quan-tity assumptions in this area are based on published expert opinions. Quantification of the requirements at the country level is essential to strengthen these estimates.
We were unable to use published costing data to fur-ther develop quantity assumptions and unit prices due to the general lack of detail provided in such studies. The majority of published costing studies present unit costs, without separating quantity assumptions and unit prices. In order to understand what drives differ-ences in prices across countries we must understand the quantities and prices making up these unit costs. Reporting standards in this area towards greater dis-aggregation of cost data would drive improvements in programme costing analysis. Similarly, despite com-mon consensus on the increasing marginal costs of implementing interventions in the final phases of scale up [35], there is a dearth of literature supporting this quantitatively [36].
Conclusions
Future costing studies should consider the benefits of integrated approaches to programme delivery [37]. A stronger focus on the operational costs of the health sys-tem at varying levels of capacity and in situations where interventions are at differing coverage levels would be
desirable to support improvements in future costing work, and would help support the transferability of find-ings from one disease area to others. More effort should be also be geared towards evaluating differences in the quality of service delivery corresponding to varying levels of programme investments in order to inform quantity assumptions.
Authors’ contributions
MB provided project oversight, researched quantity assumptions and drafted the manuscript. KS provided conceptual input and quality control. CB devel‑ oped the database used in the analysis. JS, JL and RW undertook analyses to contribute to the overall development of the database. All authors read and approved the final manuscript.
Authors’ information
MB, KS, and CB are all employees of the World Health Organization. RW is a consultant for the World Health Organization. JS and JL undertook the analysis as Interns for the World Health Organization. The views expressed in this manuscript are those of the authors and they do not necessarily represent the views of the WHO.
Acknowledgements
Not applicable.
Competing interests
The authors declare that they have no competing interests.
Availability of data and materials
The datasets supporting the conclusions of this article are available at http:// www.who.int/choice/en.
Consent for publication
Not applicable.
Ethics approval and consent to participate
Not applicable.
Funding
No funding was received for this analysis.
Publisher’s Note
Springer Nature remains neutral with regard to jurisdictional claims in pub‑ lished maps and institutional affiliations.
Received: 6 March 2017 Accepted: 4 October 2017
References
1. Johns B, Baltussen R, Hutubessy R. Programme costs in the economic evaluation of health interventions. Cost Eff Resour Alloc. 2003;1:1.
Table 4 Percentage of countries with available data for selected variables, by income level Country Health care facilities,
% International salaries, % Energy price (kWh USD 2010), % Water price (per cubic metre USD 2010), %
High‑income 60 60 62 74
Upper middle‑income 68 50 27 52
Lower middle‑income 75 25 8 41
• We accept pre-submission inquiries
• Our selector tool helps you to find the most relevant journal
• We provide round the clock customer support
• Convenient online submission
• Thorough peer review
• Inclusion in PubMed and all major indexing services
• Maximum visibility for your research
Submit your manuscript at www.biomedcentral.com/submit
Submit your next manuscript to BioMed Central
and we will help you at every step:
2. Galárraga O, Wirtz VJ, Figueroa‑Lara A, Santa‑Ana‑Tellez Y, Coulibaly I, Viisainen K, Medina‑Lara A, Korenromp EL. Unit costs for delivery of antiretroviral treatment and prevention of mother‑to‑child transmis‑ sion of HIV: a systematic review for low‑ and middle‑income countries. Pharmacoeconomics. 2011;29:579–99.
3. World Health Organization. Global health expenditure database. Geneva: World Health Organization; 2014.
4. http://www.statoids.com. Accessed 14 July 2015.
5. World Health Organization. Country survey on medical devices and healthcare facilities 2013. Organization WH ed. 2014.
6. Templ M, Kowarik A, Filzmoser P. Iterative stepwise regression imputa‑ tion using standard and robust methods. Comput Stat Data Anal. 2011;55:2793–806.
7. https://www.numbeo.com/cost‑of‑living/. Accessed 12 Nov 2015. 8. International Civil Servants Commission. DSA circular report. Rhodes KP
ed. 2010.
9. UN Web Buy. https://www.unwebbuyplus.org. Accessed 10 Dec 2014. 10. http://data.worldbank.org/indicator. Accessed 13 July 2015. 11. http://fueleconomy.gov. Accessed 19 Aug 2015.
12. World Health Organization. Guidelines for estimating costs of introduc‑ ing new vaccines into the national immunization system. Geneva: World Health Orgnanization; 2002.
13. Performance Quality and Safety Prequalification Catalogue. 2014 version accessed. http://apps.who.int/immunization_standards/vaccine_quality/ pqs_catalogue/.
14. UNICEF Supply Catalogue. https://supply.unicef.org/unicef_b2c/app/ displayApp/(layout=7.0‑12_1_66_67_115&carea=%24ROOT)/.do?rf=y. Accessed 10 Dec 2014.
15. IEA. Energy prices and taxes, vol. 2011, No. 3. Paris: OECD Publishing. 16. Global Water Intelligence. Global water market. Oxford: Oxford University
Press; 2011.
17. Union IT. World telecommunication/ICT indicator database. Union IT ed.; 2012.
18. Serje J. Towards a cost analysis of a health intervention delivered with mobile technology: a costing tool and estimation of ICT prices. Lausanne: University of Lausanne, Department of Economics; 2015.
19. US General Services Administration. Supply catalog 2014. 2014. 20. Price Waterhouse Coopers. Global entertainment and media outlook,
2010–2014. 11th ed. 2010.
21. World Health Organization. Working for health and growth: investing in the health workforce. Report of the High‑Level Commission on Health Employment and Economic Growth. 2017.
22. Chisholm D, Abagunde D, Mendis S. Scaling up action against noncom‑ municable diseases: how much will it cost?. Geneva: World Health Organization; 2011.
23. World Health Organization. Methodology and assumptions used to estimate the cost of scaling up selected child health interventions. 2005. 24. UNESCO. EFA global monitoring report. Youth and skills: putting educa‑
tion to work. 2012.
25. Rose B. Where radio fits. Radios strengths in the media landscape. Arbitron ed. 2012.
26. http://greencrest.com/marketingprose/advertising‑frequency‑is‑there‑a‑ magic‑number. Accessed 23 Sept 2015.
27. http://avenueright.com/entries/71/optimum‑scheduling‑for‑radio‑adver‑ tising‑frequency‑is‑key. Accessed 23 Sept 2015.
28. Act B. African broadcast and film markets. London: Balancing Act; 2008. 29. Project UD. Estimating the global in‑country supply chain costs of meet‑
ing the MDGs by 2015. USAID ed. 2009.
30. http://www.imf.org/external/data.htm. Accessed 14 July 2015.
31. http://www.un.org/en/development/desa/population/. Accessed 14 July 2015.
32. van Buuren S, Boshuizen HC, Knook DL. Multiple imputation of missing blood pressure covariates in survival anaysis. Stat Med. 1999;18:681–94. 33. Rubin DB. Inference and missing data. Biometrika. 1976;63:581–92. 34. Arellano M, Bond SR. Some tests of specification for panel data: Monte
Carlo evidence and an application to employment equations. Rev Econ Stud. 1991;58:277–97.
35. Johns B, Torres TT. WHO‑CHOICE: costs of scaling up health interventions: a systematic review. Health Policy Plan. 2005;20:1–13.
36. Guinness L, Kumaranayake L, Hanson K. A cost function for HIV preven‑ tion services: is there a ‘u’—shape? Cost Eff Resour Alloc. 2007;5:13. 37. Obure CD, Guinness L, Sweeney S, Initiative I, Vassall A. Does integration