R E S E A R C H A R T I C L E
Open Access
Combining EEG signal processing with
supervised methods for Alzheimer’s patients
classification
Giulia Fiscon
1,2*†, Emanuel Weitschek
1,3†, Alessio Cialini
1, Giovanni Felici
1, Paola Bertolazzi
1, Simona
De Salvo
4, Alessia Bramanti
4, Placido Bramanti
4and Maria Cristina De Cola
4Abstract
Background: Alzheimer’s Disease (AD) is a neurodegenaritive disorder characterized by a progressive dementia, for which actually no cure is known. An early detection of patients affected by AD can be obtained by analyzing their electroencephalography (EEG) signals, which show a reduction of the complexity, a perturbation of the synchrony, and a slowing down of the rhythms.
Methods: In this work, we apply a procedure that exploits feature extraction and classification techniques to EEG signals, whose aim is to distinguish patient affected by AD from the ones affected by Mild Cognitive Impairment (MCI) and healthy control (HC) samples. Specifically, we perform a time-frequency analysis by applying both the Fourier and Wavelet Transforms on 109 samples belonging to AD, MCI, and HC classes. The classification procedure is designed with the following steps: (i) preprocessing of EEG signals; (ii) feature extraction by means of the Discrete Fourier and Wavelet Transforms; and (iii) classification with tree-based supervised methods.
Results: By applying our procedure, we are able to extract reliable human-interpretable classification models that allow to automatically assign the patients into their belonging class. In particular, by exploiting a Wavelet feature extraction we achieve 83%, 92%, and 79% of accuracy when dealing with HCvsAD, HCvsMCI, and MCIvsAD classification problems, respectively.
Conclusions: Finally, by comparing the classification performances with both feature extraction methods, we find out that Wavelets analysis outperforms Fourier. Hence, we suggest it in combination with supervised methods for automatic patients classification based on their EEG signals for aiding the medical diagnosis of dementia.
Keywords: Alzheimer’s disease, Feature extraction, Electroencephalography signals, Classification
Background
Dementia is a broad group of brain disorders leading to a cognitive impairment because of a gradual dysfunction and death of brain cells. The World Alzheimer Report 2015 has been estimated that 36 million people were liv-ing with dementia in 2010, nearly doublliv-ing every 20 years to 66 million by 2030 and to 115 million by 2050 [1]. Given the continuous growth of incidence of this illness,
*Correspondence:[email protected]
†Giulia Fiscon and Emanuel Weitschek contributed equally to this work.
1Institute of Systems Analysis and Computer Science A. Ruberti (IASI), National
Research Council (CNR), Via dei Taurini 19, 00185 Rome, Italy
2SysBio Centre for Systems Biology, Rome, Italy
Full list of author information is available at the end of the article
dementia represents one of the major plague for the mod-ern society. The most widespread cause of dementia is the Alzheimer’s disease (AD), which involves serious mem-ory loss, cognitive impairment, and behavioural changes. Thus, AD interferes with daily, social and professional functioning of patients, also affecting the daily life of their families [2]. The intermediate stage between the normal cognitive deficit due to aging and dementia is defined as Mild Cognitive Impairment (MCI). Several symptoms dis-tinguish MCI, but the loss of memory is a risk factor to develop AD [3]. In Europe, only 50% of the patients with dementia receive a diagnosis by a specialist centre, and tests for dementia are carried out after the patient has already started showing symptoms and the disease has
progressed [4]. Usually, the process for obtaining a clinical diagnosis for dementia of a patient is mainly based on the delivery of a questionnaire in order to assess its cognitive abilities. However, a timely diagnosis would facilitate care, reduce the progression of the disease, and improve the patient’s management to alleviate the burden. This might be achieved through a combination of diagnosis criteria and reliable biomarkers.
In the past years, significant progresses have been made to detect the early stages of dementia through bio-chemical, genetic, neuroimaging, and neurophysiological biomarkers such as Electroencephalography (EEG) [5–
9]. EEG provides the electrical activity of the brain by tracking the connectivity of neurons in the recording sites of the scalp [10], processing it with milliseconds precision. The condition of the brain physiology can be inferred from the EEG signals recorded, and thus abnor-malities can be identified through the detection of unusual frequency patterns [11]. Indeed, different rhythms with diverse frequency bands describe the activity of the brain and can be recorded by EEG. Among them, the main ones arealpha(8-13 Hz, 30-50μVamplitude),beta(13-30 Hz, 5-30μV amplitude),gamma(≥30 Hz),delta(0.5-4 Hz), andtheta(4-7 Hz,≥20μVamplitude).
Although it is characterized by a lower spatial resolution than other neuroimaging techniques, EEG provides high temporal resolution [12]. Moreover, EEG is non-invasive, ease and faster to use and able to differentiate severity of dementia at a lower cost than other imaging devices [13,
14]. Thanks to its reduced costs EEG can be easily imple-mented for population screening to detect pre-clinical biomarkers.
EEG signal analysis may provide useful indications of the patterns of brain activity and predict the stages of dementia [15, 16] because of its significant capacity to detect brain rhythm abnormalities, generally correlated with the severity of cognitive impairment [17]. In par-ticular, different clinical studies confirm EEG as suitable technique to early detect AD [18–20], due to the follow-ing effects on EEG signals: reduction of the complexity, perturbation of the synchrony, and slowingdown of the rhythms [19,21,22]. The slowing of the rhythms in the EEG signals of subjects affected by AD can be explained by a gain of the activity in the theta and delta frequency ranges, and a reduction of the activity in the alpha and beta frequency ranges [23–26]. The reduction of complex-ity in the EEG temporal patterns can be explained by a modification of the neural network architecture observed in subjects affected by AD [27, 28] due to loss of neu-rons and functional interaction alteration which make the activity of the brain more predictable, more regular, and simpler than in healthy control samples (HC) [29]. There-fore, we can state that EEG signals related to healthy controls subjects can be distinguished from those ones of
subjects affected by neurodegenerative diseases (e.g., AD) or other pathologies (e.g., epilepsy).
Nevertheless, AD and MCI subjects are characterized by a huge variability and thus discriminating artifacts and patterns similarities to physiological brain activity still remain a crucial issue. In this regard, EEG signal pro-cessing integrated with computational algorithms based on machine learning methods may contribute to a deeper comprehension of the disease and simplify the work of neurologists providing an additional tool to diagnose the stage of dementia [20,30–33].
In this paper, we propose a procedure based on EEG-signal preprocessing and automatic classification with supervised learning methods, and its application to dis-criminate subjects belonging to AD, or MCI, or HC classes. This is an extension of a preliminary work [34] in which we processed an EEG data set composed of 49 AD, 37 MCI and 14 healthy controls subjects (HC) by means of a spectrum analysis based on the Fourier Transforma-tion, and we automatically classified them with supervised machine learning methods. Here, we have increased the number of HC subjects of the data set to 23 in order to balance the number of samples for each category. We have also improved the EEG-signal preprocessing and spectrum analysis techniques through the application of the Wavelet Transform as an efficient method for noise reduction and feature extraction, obtaining a more reliable method to distinguish healthy from diseased subjects.
Methods
We apply a procedure that encompasses the following steps summarized in Fig. 1: (i) data collection (subjects recruitment, EEG recording) and preprocessing, (ii) fea-ture extraction (Fast Fourier and Wavelet Analysis), and (iii) classification (supervised machine learning to distin-guish the AD, MCI, and HC classes).
Data collection and preprocessing
chi-Fig. 1Flowchart of the EEG signal analysis procedure
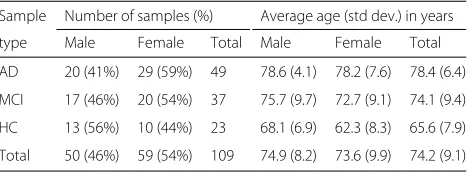
square test (p-value>0.05). Additionally, the difference in terms of age between men and women is not statis-tically significant according to the two-tailed Student’s T Test (p-value >0.05 for each class). Thus, the hypothe-sis of homogeneity for age and gender among etiological classes cannot be rejected. Table1provides an overview of the enrolled subjects that can be divided in three main eti-ological classes: (i) patients with Alzheimer’s disease (AD), (ii) patients with Mild Cognitive Impairment (MCI), and (iii) healthy control samples (CT).
EEG recording We acquired multi-channel EEG sig-nals by using 19 electrodes, by setting their placement according to the International 10-20 System [35], and by exploiting monopolar connections with earlobe electrode landmark [10]. The brain activity of the subjects in rest-ing condition and closed eyes was measured in terms of electrical potential (μV). We recorded the EEG sig-nals by capturing 300 seconds with 256 or 1024 sampling frequency (Hz).
Preprocessing For each signal we select the central 180 seconds (i.e., from 60 to 240 seconds) to avoid initial and final EEG recording artifacts. Additionally, to normalize the sampling frequency we convert each signal to 256 Hz.
Feature extraction
Extracting features from EEG signals in frequency domain has been proven to be effective for analyzing the electrical brain activity with computational models [31,36]. Thus, in order to obtain a set of informative features from the
Table 1Overview of the recruited subjects
Sample Number of samples (%) Average age (std dev.) in years
type Male Female Total Male Female Total
AD 20 (41%) 29 (59%) 49 78.6 (4.1) 78.2 (7.6) 78.4 (6.4)
MCI 17 (46%) 20 (54%) 37 75.7 (9.7) 72.7 (9.1) 74.1 (9.4)
HC 13 (56%) 10 (44%) 23 68.1 (6.9) 62.3 (8.3) 65.6 (7.9)
Total 50 (46%) 59 (54%) 109 74.9 (8.2) 73.6 (9.9) 74.2 (9.1)
preprocessed EEG signals, we apply the Fourier and the Wavelet Transform for estimating their spectrum [37].
Firstly, the Fast Fourier Transform (FFT) is applied to each EEG signal of 180 seconds providingMFourier Coef-ficients for each electrode (Mequal to 16). Hence, for each sample we obtain 304 features (16 coefficients·19 elec-trodes) and we arrange them in a matrix with 109 rows (referring to the samples) and 305 columns (304 referring to the features, and one referring to the sample type).
Secondly, the Discrete Wavelet Transform (DWT) is applied to each EEG signal of 180 seconds providingM Wavelet Coefficients for each electrode (Mequal to 48). Hence, for each sample we obtain 912 features (48 coef-ficients·19 electrodes) and we arrange them in a matrix with 109 rows (referring to the samples) and 913 columns (912 referring to the features, and one referring to the sample type).
We provide in Table2a schematic representation of the matrices.
The spectral analysis (Wavelet and Fourier) of the EEG signals has been performed by using the high level com-puting language provided by MATLAB˝oR2014a [38].
Fourier analysis
We apply the Fast Fourier Transform (FFT) to obtain the spectrum of the EEG signals [37]. The FFT relies on the Discrete Fourier Transform (DFT) computed as follows:
X[k]=
S−1
s=0
x[s]ek[s] (1)
Table 2Schema of the matrix obtained after the feature extraction phase
Sample Coefficient(1,1) · · · Coefficient(E,E·M) Sample type
sample1 a(1,1) · · · a(1,E·M) HC
sample2 a(2,1) · · · a(2,E·M) MCI
· · · ·
sampleN a(N,1) · · · a(N,E·M) AD
N= number of samples,M= number of coefficients,M+1 = number of features,E
withsrepresenting the s-thsample in the time domain;x corresponding to the signal time series (s=0, 1, 2,· · ·,S− 1); X referring to the representation of th frequency domain for the time-series signalx;Srepresenting the the whole number of samples of the signalx;k correspond-ing to k-thfrequency component (k = 0, 1,. . .,S− 1); ek[s]=e−
jks2π
S referring to the k-thbasis function.
ek[s] is calculated simultaneously during the sampling
phase. Such a formula yields as output one complex num-berX[k] for eachkcomponent. The output of the FFT analysis are the Fourier Coefficients arranged in a matrix as shown in Table2.
Wavelet analysis
A more effective way for decomposing time and frequency of the EEG signal, and for processing it is provided by the Wavelet Transform (WT). WT is a time-frequency repre-sentation of the signal, which is decomposed in different windows of variable size, i.e., sub-bands. Conversely to the FFT, the WT is able to catch the transient features of the analyzed signal [39], i.e., it enables to keep both the temporal (spatial duration) and frequency information of the signal. Indeed, WT allows to represent when tran-sient events occur in the signal and with what intensity, as well as the time variations of the frequency contents [40]. Given a signal, WT decomposes it in simpler oscillating functions called wavelets. A family of wavelets (ψa,b(t))
are derived from a unique mother waveletψ(t)by scal-ing (dilatscal-ing and contractscal-ing) and by shiftscal-ing it to different time positions [40,41].
ψa,b(t)=
1 √|
a|ψ
t−b a
(2)
In Eq. 2 t is the time variable, a ∈ R\ 0 is the scal-ing parameter, andb ∈ Ris the shifting parameter. The wavelets are localized in both time and frequency with respect to the sinusoidal waves of Fourier, which are bet-ter localized in frequency, but infinitely extended in time [40]. Additionally, the former are limited in band, i.e., they are composed of a defined range of frequencies.
When dealing with digital signals that are frequency band-limited, the continuous form of WT can be dis-cretized according to the sampling theorem [42]. The Discrete Wavelet Transform (DWT) allows to process dig-ital signals by keeping enough information in reasonable computational time. A relevant feature of the DWT is the combination with high and low pass filters, through which the signals can be processed to filter the high and low frequencies in order to compress and reduce the noise [43], e.g., hidden artifacts and background noise during the EEG signals recording. Indeed, the WT is a well-established signal representation and feature extraction technique for EEG processing [44].
In this work, we adopt the DWT in order to per-form the spectral analysis on the previously described dataset (see section Data collection and preprocessing). The choice of a simple DWT stems from the need of obtaining good performances over an arbitrary num-ber of feature elements per channel and from the sam-pling frequency of the input signals (256 Hz). We adopt two types of discrete wavelet families: Daubechies (db) and Symlets (sym). Daubechies are compactly supported orthonormal wavelets [45], while Symlets are symmetrical wavelets proposed by Daubechies as modifications to the db family [46].
Given a single set of signals, each one is processed according to a feature extraction procedure composed of two main phases: noise reduction and feature extraction. Firstly, we perform a noise reduction phase, where each EEG signal is decomposed in n levels (i.e., sub-bands) by applying a DWT (Symlets order 3 wavelet type). For every sub-band xan upper and lower threshold value is calculated as:
Thrup(x)=avg(x)+1.5·stdev(x) (3)
Thrdwn(x)=avg(x)−1.5·stdev(x) (4)
The values of each samplesiare then compared according
to the defined thresholds (3) and (4) and ifsi > Thrupor
si <Thrdwnthensiis reduced as follows:si∗(Thrup(x)−
Thrdwn(x))/100. This step is performed in order to obtain
an effective artifact reduction and to avoid possible infor-mation loss. The artifact removal phase operates on two levels of signal decomposition: level 5 and level 8. We choose these decomposition levels, because their ranges take into account the alpha, theta, beta, and delta band-widths, which are widely adopted for EEG analysis and have been proven to be effective when dealing with Alzheimer’s diseased patients (see “Background” section for more details). The channel signal is then reconstructed with the obtained values, which are given as input to the feature extraction phase.
noise/artifact removal to the main bandwidths (i.e., alpha, theta, beta, delta). We extract 16 features per channel when considering the combination of only two band-widths, i.e., alpha - theta or beta - delta, and 12 features per channel when taking into account all the four brainwaves. The output of the DWT analysis are the Wavelet Coef-ficients arranged in a matrix as shown in Table2.
Classification
We perform a supervised learning analysis in order to automatically classify the samples to their types (HC, MCI, AD) by processing their associated features [48,49]. Supervised learning automatically assigns a sample into a class by inferring a classification model from labeled data (training set). Our aim is to extract a human readable model specific for each type (HC, MCI, AD) of sample containing a small subset of features, e.g., ‘ifWavelet10 >
0.3 andWavelet16<0.6 then the sample can be classified
as MCI”). This model can support clinicians to identify pivotal features related to the investigated neurodegen-erative disease and to diagnose new cases. In particular, we address the following classification problems: (i) HC vs AD; (ii) HC vs MCI; (iii) MCI vs AD; (iv) HC vs CASE (MCI+AD), where the CASE class is composed of AD joint to MCI samples in order to test the recogni-tion of the diseased patients with respect to the healthy ones. Among the plethora of classification methods we use Decision Trees classifiers (i.e., C4.5 [50]), because they allow to handle noisy datasets and over-fitting with an ad-hoc parameters tuning. Additionally, Decision Trees provide the investigator with a compact, clear, and human readable classification model. C4.5 is an algorithm for the generation of decision trees used for classification. A deci-sion tree is a structure similar to a flow chart, where each node denotes a test on an attribute, each branch repre-sents a result of a test, and every leaf is labeled by a class. Indeed a node with outgoing edges is termed test node and the final nodes are the leaves.
In decision trees the classification model permits to pre-dict the class of a sample based on its features. The algorithm takes as input a set of classified data (train-ing set) and the output is composed by leaf nodes, which define the belonging to a class attribute. Indeed, the path from the root to a specific leaf means that all the pred-icates applied to the features of the sample are verified. The validity of the three is verified on a set of labeled samples (test set), but whose class is taken into account only for verification of the class assignments. In this work, we use the J48 Java based implementation of C4.5 avail-able in the Weka package [51]. In addition, we performed a large battery of tests with other families of classifiers (function-based, rule-based, naive-based, and Bayesian-based), whose performances are not satisfying and hence not reported. The classification performance is evaluated
by computing standard statistical metrics, as accuracy, precision, sensitivity, specificity, and F-measure and by adopting a leave-one-out cross validation sampling proce-dure [48]. It is worth to note that the classification models can be adopted to classify new subjects whose diagnosis has not been already assessed and that could constitute an independent validation set for further verifying the extracted models.
Finally, in order to prove the validity of the extracted models we performed random permutations of class membership for each classification problem and each sig-nal processing technique (Fourier and Wavelet). We test if our procedure is able to extract meaningful classification models regardless of the class partition imposed on the training set. This would be verified only in the presence of a marked overfitting behavior.
Results
In this section, we provide the classification results rely-ing on the features extracted with the Fourier and Wavelet Transforms applied on EEG signals of 180 s. Tables3and4
present the results of the Decision Tree classifier consid-ering the Fourier Transform and the Wavelet Transform, respectively.
In particular, Table3presents the results of the Decision Tree C4.5 classifier concerning the EEG signals withM= 16 extracted Fourier Coefficients. We obtain 72%, 72%, 80%, 75% of accuracy when dealing with HCvsAD, HC vsMCI, MCIvsAD, HCvsCASE classification problems, respectively.
Table4presents the performance of the Decision Tree C4.5 classifier concerning the EEG signals processed with the Wavelet Transform. In all classification tasks, the fea-ture extraction based on the Wavelet Transform achieves high classification performance in all metrics, obtaining 83%, 92%, 79%, and 73% of accuracy when dealing with HCvsAD, HCvsMCI, MCIvsAD, HCvsCASE classi-fication problems, respectively. In particular, the Wavelet spectral analysis outperforms the Fourier analysis when dealing with EEG signals classification of HCvsAD, HC vsMCI, and HCvsCASE. Conversely, for MCIvsAD both
Table 3Classification performance [%] by usingM=16 Fourier Coefficients as features and a leave-one-out sampling with 72, 60, 86, 109 folds for HCvsAD, HCvsMCI, MCIvsAD, HCvsCASE, respectively
HCvsAD HCvsMCI MCIvsAD HCvsCASE
Accuracy 72.2 71.7 80.2 74.7
Precision 71.1 78.9 80.2 74.0
Sensitivity 72.2 71.7 80.2 74.7
Specificity 59.0 79.0 78.5 46.3
Table 4Classification performance [%] by usingM=48 Wavelet Coefficients as features and a leave-one-out sampling with 72, 60, 86, 109 folds for HCvsAD, HCvsMCI, MCIvsAD, HCvsCASE, respectively
HCvsAD HCvsMCI MCIvsAD HCvsCASE
Accuracy 83.3 91.7 79.1 73.4
Precision 83.3 91.8 79.3 74.7
Sensitivity 83.3 91.7 79.1 73.4
Specificity 78.0 91.5 79.1 51.5
F-measure 83.3 91.7 79.1 74.0
signal processing methods lead to comparable classifica-tion performances.
Another validation of the proposed procedure is based on the variation of the adopted sampling schema and by applying also a feature selection step with theInformation Gain (InfoGain)filter as evaluation measure followed by the Ranker search method, which reached good perfor-mance in our previous study [52]. We perform both 10-fold cross validation sampling and holdout (90% training and 10% test percentage split) combined with Information Gain filter [53] obtaining again satisfying classification performance. We observe an improvement of the HC vs CASE and HC vs MCI classification tasks both for Fourier and Wavelet transforms reaching even more than 80 and 90% of accuracy, respectively. Conversely, a perfor-mance decreasing is observed when distinguishing MCI vsAD, probably due to the similarity of the two classes. Classification results are detailed in Table5.
For validating our results and the extracted classifica-tion models we apply the procedure to data with random permutations of class labels. This validation test is per-formed on 100 different random permutations for each classification problem and for each EEG signal process-ing technique (Fourier and Wavelet). In particular, when using the Fourier (Wavelet) transform we achieve 56.5% (52.5%), 45.0% (50.5%), 49.5% (45.9%), and 54.5% (50.4%) of average accuracy considering HCvsAD, HCvsMCI,
Table 5Classification performance (Accuracy [%]) by using 10-fold cross validation (CV) sampling and holdout (90% training and 10% test percentage split) for HCvsAD, HCvsMCI, MCIvs
AD, HCvsCASE, taking into account Wavelet (WT) and Fourier (FT) Coefficients as features
Wavelet Fourier
10-fold CV Holdout 10-fold CV Holdout
HCvsAD 76.4 71.4 80.6 85.7
HCvsMCI 93.3 83.3 83.3 83.3
MCIvsAD 66.3 88.9 66.7 77.2
HCvsCASE 81.7 81.8 84.4 90.9
MCIvsAD, HCvsCASE permutated classification prob-lems, respectively. Therefore, we obtain an overall average classification accuracy of 50.6%.
We also test other classification methods, such as function-based, rule-function-based, naive-function-based, and Bayesian-based (e.g., RIPPER [54], SVM [55], the MultiLayer Perceptron [56]), whose performances are not satisfying and hence are not reported. For instance, we performed a large num-ber of tests with SVMs by tuning the parameters and by setting the complexity, the epsilon for round-off error, the random seed, the tolerance to many different com-bination of values, but results were not above 65% of accuracy.
Furthermore, we remark that the adopted C4.5 algo-rithm provides a classification model, a tree built on Wavelet/Fourier Coefficients, from which the investiga-tor can derive the corresponding set of EEG electrodes. Here, the classification trees extracted in our performed analyses mainly involve the electrodes T, O, F, Fp and the wavebands alpha, theta, and delta.
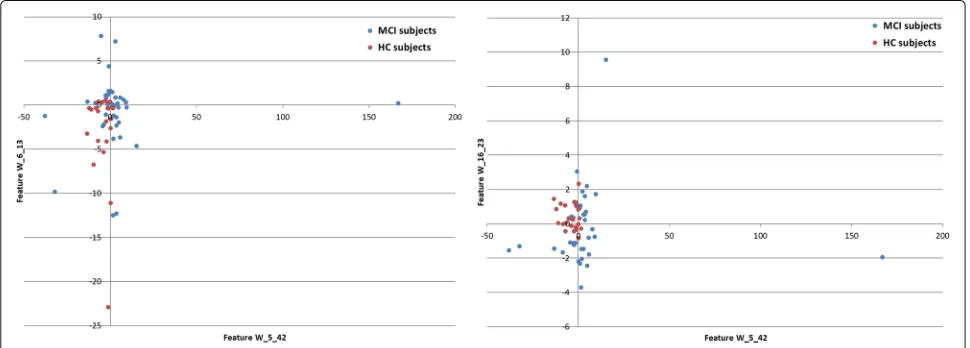
Figure 2depicts an example of such a tree and Fig. 3
shows the scatter plot of the features extracted from this tree and related to the considered classes (MCI and HC).
Discussion
Although different neuroimaging techniques (e.g., Magnetic Resonance Imaging, Positron Emission Tomography) can be used for aiding the diagnosis of dementia providing quantitative data about the brain abnormalities [57,58], EEG is non-invasive, besides being cheaper, simpler and faster to use than other imaging devices [13, 14]. For this reason, automated EEG signal analysis plays an important role in detecting dementia in the early stages, as well as in classifying disease severity [59–61]. Supervised learning is doubtless one of the most popular methods to classify brain disorders with EEG [62–66].
Fig. 2C4.5 tree for HCvsMCI of size 7 with 4 leaves. Each path from the root to a leaf represents a classification rule. Each leaf is associated to a class and two numbers. The first number is the total number of instances recognized by the rule, while the second optional number represents how many ones (if any) are misclassified
The choice of using three 2-class classification mod-els instead of a single 3-class one is motivated by two main considerations: first, we want to identify if the 3 sets have specific characteristics that single them out with respect to the rest of the data; second, the nature of the adopted classifier is intrinsically binary and therefore they are expected to perform better. Indeed, we obtain poorer performances when 3-classes are used (accuracy below 50%).
Additionally, the overall classification accuracy of 50.6% on 100 different random permutations, for each clas-sification problem and for each EEG signal processing technique, confirms the reliability of our classification models and the absence of over-fitting when considering real classes.
Furthermore, we tested two other sampling schemes (i.e., 10-fold cross validation, and holdout) on the considered classification problems combined with an Information Gain feature selection [53]. The results show a performance decrease when classifying MCI vs AD, this can be caused by the similarity of the two stages of dementia. Indeed, Mild Cognitive Impair-ment become increasingly prone to develop Alzheimer’s or another type of dementia. On the other hand, an improvement of the HC vs CASE and HC vs MCI classification tasks were observed reaching even more than 80% of accuracy. Notably, distinguishing MCI from healthy control cases can be useful to aid the prediction of the development of later stages of dementia.
In line with most previous studies of EEG classification [23–26], the electrodes mainly discriminant to classify are T, O, F, Fp, whereas the wavebands more recurring are alpha, theta, and delta. After all, an enhanced activity in the theta and delta wavebands, as well as a decreased activity in the alpha and beta ones. Indeed, during cogni-tive impairment, beta waves (observed in the parietal and frontal region of the scalp) replace alpha waves, whereas theta waves are associated with decreased cognitive activ-ities such as focusing and attention [68].
To conclude, the results on the new and extended data set are improved with respect to our previous study on fewer subjects [34]. Thanks to the Wavelet Trans-form we obtain promising results also with an enhanced number of HC subjects that are more challenging to discriminate.
Conclusions
In this work, we proposed an analysis procedure for EEG signals classification of samples affected by neurodegenar-ative diseases, i.e., Mild Cognitive Impairment (MCI) and Alzheimer Disease (AD), with respect to Healthy Control samples (HC). The analysis is based on a preprocess-ing phase followed by a feature extraction (Fast Fourier and Wavelet Analysis), and a classification procedure that relies on the well-known supervised learning approach to distinguish the AD, MCI, and HC classes. We tested our procedure on EEG signals recorded on 109 human sam-ples (23 HC, 37 MCI, 49 AD). Through the combination of the Wavelet-based signal analysis and the tree-based classifier C4.5, we effectively identified HC, MCI, and AD experimental samples with better accuracy than the spectral analysis with Fast Fourier Transform.
Finally, we plan to extend the analysis on a new cohort of patients by further increasing the number of consid-ered samples, in particular for the less represented classes, to apply more advanced artifact removal techniques [69], and to study the extracted classification models for identi-fying further electrodes and wavebands that are related to the investigated diseases.
Abbreviations
AD: Alzheimer’s disease; DWT: Discrete wavelet transform (DWT); EEG: Electroencephalography; FFT: Fast fourier transform; FT: Fourier transform; HC: Healthy control; MCI: Mild cognitive impairment; WT: Wavelet transform
Acknowledgements
EW and AC wish to thank Riccardo Torlone for proposing the topic during its big data course.
Funding
The authors were partially supported the Nanomax flagship project (B81J12006270001) and by the EPIGEN flagship project (PB.P01). These funding sources had no role in the design of the study and collection, analysis, and interpretation of data, and in writing the manuscript.
Availability of data and materials
The data sets analyzed during the current study are available upon request from the IRCCS Centro Neurolesi “Bonino-Pulejo” (MCDC).
Authors’ contributions
MCDC, EW, GF conceived and designed the work. PBr, SD, AB acquired, collected, and organized the data. GF, EW, AC implemented the computational pipeline and analyzed the data. GF, EW, MCDC, GFel, PB interpreted the results. PBr, AB validated medical research. PB and GFel validated machine learning research. GF, EW, MCDC drafted the manuscript. All authors critically revised the manuscript, approved the final manuscript and take responsibility for the accuracy and integrity of the work.
Ethics approval and consent to participate
The Ethical Committee of the IRCCS Centro Neurolesi “Bonino-Pulejo” approved the study after an informed consent to participate to the study was signed by the enrolled subjects (reference number 40/2013).
Competing interests
The authors declare that they have no competing interests.
Publisher’s Note
Springer Nature remains neutral with regard to jurisdictional claims in published maps and institutional affiliations.
Author details
1Institute of Systems Analysis and Computer Science A. Ruberti (IASI), National
Research Council (CNR), Via dei Taurini 19, 00185 Rome, Italy.2SysBio Centre for Systems Biology, Rome, Italy.3Department of Engineering, Uninettuno International University, Corso Vittorio Emanuele II 39, 00186 Rome, Italy. 4IRCCS Centro Neurolesi “Bonino-Pulejo”, Contrada Casazza, SS113, 98124
Messina, Italy.
Received: 24 July 2017 Accepted: 22 May 2018
References
1. Prince M, Wimo A, Guerchet M, Ali G, Wu Y, Prina M. World Alzheimer Report 2015. The global impact of dementia. An analysis of prevalence, incidence, cost & trends; Alzheimer’s Disease International: London. London: Alzheimer’s Disease International (ADI); 2015.
2. Winblad B, Amouyel P, Andrieu S, Ballard C, Brayne C, Brodaty H, Cedazo-Minguez A, Dubois B, Edvardsson D, Feldman H, et al. Defeating alzheimer’s disease and other dementias: a priority for european science and society. Lancet Neurol. 2016;15(5):455.
3. Grundman M, Petersen RC, Ferris SH, Thomas RG, Aisen PS, Bennett DA, Foster NL, Jack Jr CR, Galasko DR, Doody R, et al. Mild cognitive impairment can be distinguished from alzheimer disease and normal aging for clinical trials. Arch Neurol. 2004;61(1):59–66.
4. Brooker D, Fontaine JL, Evans S, Bray J, Saad K. Public health guidance to facilitate timely diagnosis of dementia: Alzheimer’s cooperative valuation in europe recommendations. Int J Geriatr Psychiatr. 2014;29(7):682–93. 5. Cedazo-Minguez A, Winblad B. Biomarkers for alzheimer’s disease and other forms of dementia: clinical needs, limitations and future aspects. Exp Gerontol. 2010;45(1):5–14.
6. Hampel H, Frank R, Broich K, Teipel SJ, Katz RG, Hardy J, Herholz K, Bokde AL, Jessen F, Hoessler YC, et al. Biomarkers for alzheimer’s disease: academic, industry and regulatory perspectives. Nat Rev Drug Discov. 2010;9(7):560.
7. DeKosky ST, Marek K. Looking backward to move forward: early detection of neurodegenerative disorders. Science. 2003;302(5646):830–4. 8. Jackson CE, Snyder PJ. Electroencephalography and event-related
potentials as biomarkers of mild cognitive impairment and mild Alzheimer’s disease. Cambridge: Elsevier; 2008.
9. Poil S-S, De Haan W, van der Flier WM, Mansvelder HD, Scheltens P, Linkenkaer-Hansen K. Integrative eeg biomarkers predict progression to alzheimer’s disease at the mci stage. Front Aging Neurosci. 2013;5:58. 10. Jasper HH. The ten twenty electrode system of the international
federation. Electroencephalogr Clin Neurophysiol. 1958;10:371–5. 11. Elbert T, Lutzenberger W, Rockstroh B, Berg P, Cohen R. Physical aspects
of the eeg in schizophrenics. Biol Psychiatry. 1992;32(7):595–606. 12. Davidson PR, Jones RD, Peiris MT. Eeg-based lapse detection with high
temporal resolution. IEEE Trans Biomed Eng. 2007;54(5):832–9.
14. Snyder SM, Hall JR, Cornwell SL, Falk JD. Addition of eeg improves accuracy of a logistic model that uses neuropsychological and cardiovascular factors to identify dementia and mci. Psychiatry Res. 2011;186(1):97–102.
15. Hampel H, Lista S, Teipel SJ, Garaci F, Nisticò R, Blennow K, Zetterberg H, Bertram L, Duyckaerts C, Bakardjian H, et al. Perspective on future role of biological markers in clinical therapy trials of alzheimer’s disease: a long-range point of view beyond 2020. Biochem Pharmacol. 2014;88(4): 426–49.
16. Rossini PM, Rossi S, Babiloni C, Polich J. Clinical neurophysiology of aging brain: from normal aging to neurodegeneration. Prog Neurobiol. 2007;83(6):375–400.
17. Jeong J. Eeg dynamics in patients with alzheimer’s disease. Clin Neurophysiol. 2004;115(7):1490–505.
18. Falk TH, Fraga FJ, Trambaiolli L, Anghinah R. Eeg amplitude modulation analysis for semi-automated diagnosis of alzheimer’s disease. EURASIP J Adv Signal Proc. 2012;2012(1):1–9.
19. Dauwels J, Vialatte F, Cichocki A. Diagnosis of alzheimers disease from eeg signals: Where are we standing?. Curr Alzheimer Res. 2010;7(6): 487–505.
20. Lehmann C, Koenig T, Jelic V, Prichep L, John RE, Wahlund L-O, Dodge Y, Dierks T. Application and comparison of classification algorithms for recognition of alzheimer’s disease in electrical brain activity (eeg). J Neurosci Methods. 2007;161(2):342–50.
21. Dunkin JJ, Leuchter AF, Newton TF, Cook IA. Reduced eeg coherence in dementia: state or trait marker?. Biol Psychiatry. 1994;35(11):870–9. 22. Giaquinto S, Nolfe G, Vitali S. Eeg changes induced by oxiracetam on
diazepam-medicated volunteers. Clin Neuropharmacol. 1986;9:79. 23. Cibils D. Dementia and qeeg (alzheimer’s disease). Suppl Clin
Neurophysiol. 2002;54:289–94.
24. Kowalski JW, Gawel M, Pfeffer A, Barcikowska M. The diagnostic value of eeg in alzheimer disease: correlation with the severity of mental impairment. J Clin Neurophysiol. 2001;18(6):570–5.
25. Arenas A, Brenner R, Reynolds CF. Temporal slowing in the elderly revisited. Am J EEG Technol. 1986;26:105–14.
26. Coben LA, Danziger WL, Berg L. Frequency analysis of the resting awake eeg in mild senile dementia of alzheimer type. Electroencephalogr Clin Neurophysiol. 1983;55(4):372–80.
27. Locatelli T, Cursi M, Liberati D, Franceschi M, Comi G. Eeg coherence in alzheimer’s disease. Electroencephalogr Clin Neurophysiol. 1998;106(3): 229–37.
28. Besthorn C, Förstl H, Geiger-Kabisch C, Sattel H, Gasser T, Schreiter-Gasser U. Eeg coherence in alzheimer disease. Electroencephalogr Clin Neurophysiol. 1994;90(3):242–5.
29. Dauwels J, Srinivasan K, Ramasubba Reddy M, Musha T, Vialatte F-B, Latchoumane C, Jeong J, Cichocki A. Slowing and loss of complexity in alzheimer’s eeg: two sides of the same coin?. Int J Alzheimer’s Dis. 2011;2011:. 30. Polat K, Güne¸s S. Classification of epileptiform eeg using a hybrid system
based on decision tree classifier and fast fourier transform. Appl Math Comput. 2007;187(2):1017–26.
31. Akrami A, Solhjoo S, Motie-Nasrabadi A, Hashemi-Golpayegani M-R. Eeg-based mental task classification: linear and nonlinear classification of movement imagery. In: Engineering in Medicine and Biology Society, 2005. IEEE-EMBS 2005. 27th Annual International Conference of The. Shanghai: IEEE; 2006. p. 4626–9.
32. Huang C, Wahlund L-O, Dierks T, Julin P, Winblad B, Jelic V. Discrimination of alzheimer’s disease and mild cognitive impairment by equivalent eeg sources: a cross-sectional and longitudinal study. Clin Neurophysiol. 2000;111(11):1961–7.
33. Mohammadi M, Al-Azab F, Raahemi B, Richards G, Jaworska N, Smith D, de la Salle S, Blier P, Knott V. Data mining eeg signals in depression for their diagnostic value. BMC Med Inform Decis Mak. 2015;15(1):108. 34. Fiscon G, Weitschek E, Felici G, Bertolazzi P, De Salvo S, Bramanti P,
De Cola MC. Alzheimer’s disease patients classification through eeg signals processing. In: Computational Intelligence and Data Mining (CIDM), 2014 IEEE Symposium On. Orlando: IEEE; 2014. p. 105–12. 35. Homan RW, Herman J, Purdy P. Cerebral location of international 10–20
system electrode placement. Electroencephalogr Clin Neurophysiol. 1987;66(4):376–82.
36. Adeli H, Zhou Z, Dadmehr N. Analysis of eeg records in an epileptic patient using wavelet transform. J Neurosci Methods. 2003;123(1):69–87.
37. Powell G, Percival I. A spectral entropy method for distinguishing regular and irregular motion of hamiltonian systems. J Phys A Math Gen. 1979;12(11):2053.
38. MATLAB: Version 7.10.0 (R2010a). Natick: The MathWorks Inc.; 2010. 39. Tumari SM, Sudirman R, Ahmad A. Selection of a suitable wavelet for
cognitive memory using electroencephalograph signal. California: Scientific Research Publishing. Engineering. 2013;5(05):15. 40. Rosso O, Martin M, Figliola A, Keller K, Plastino A. Eeg analysis using
wavelet-based information tools. J Neurosci Methods. 2006;153(2): 163–82.
41. Hazarika N, Chen JZ, Tsoi AC, Sergejew A. Classification of eeg signals using the wavelet transform. In: Digital Signal Processing Proceedings, 1997. DSP 97., 1997 13th International Conference On, vol. 1. Santorini: IEEE; 1997. p. 89–92.
42. Sanei S, Chambers JA. EEG Signal Processing. River Street, Hoboken: John Wiley & Sons; 2013.
43. Subha DP, Joseph PK, Acharya R, Lim CM. Eeg signal analysis: a survey. J Med Syst. 2010;34(2):195–212.
44. Kumar PS, Arumuganathan R, Sivakumar K, Vimal C. Removal of ocular artifacts in the eeg through wavelet transform without using an eog reference channel. Int J Open Problems Compt Math. 2008;1(3):188–200. 45. Daubechies I, et al. Ten Lectures on Wavelets vol. 61. Portland: SIAM,
Society for Industrial & Applied Mathematics; 1992.
46. Swee E, Elangovan M. Applications of symlets for denoising and load forecasting. In: Higher-Order Statistics, 1999. Proceedings of the IEEE Signal Processing Workshop On. Caesarea: IEEE; 1999. p. 165–169. 47. Subasi A. Eeg signal classification using wavelet feature extraction and a
mixture of expert model. Expert Syst Appl. 2007;32(4):1084–93. 48. Tan P, Steinbach M, Kumar V. Introduction to Data Mining. Boston:
Addison Wesley; 2005.
49. Weitschek E, Felici G, Bertolazzi P. Clinical Data Mining: Problems, Pitfalls and Solutions. Los Alamitos: IEEE Computer Society; 2013. p. 90–94.
http://doi.org/10.1109/DEXA.2013.42.
50. Quinlan JR. Improved use of continuous attributes in c4. 5. Journal of artificial intelligence research. 1996;4:77–90.
51. Hall M, Frank E, Holmes G, Pfahringer B, Reutemann P, Witten IH. The weka data mining software: an update. SIGKDD Explor Newsl. 2009;11(1): 10–18.http://doi.org/10.1145/1656274.1656278.
52. Bertolazzi P, Felici G, Festa P, Fiscon G, Weitschek E. Integer programming models for feature selection: New extensions and a randomized solution algorithm. Eur J Oper Res. 2016;250(2):389–99. 53. Hall MA, Smith LA. Practical feature subset selection for machine
learning. In: In Proceedings of the 21st Australian Computer Science Conference. New York: Springer; 1998. p. 181–91.
54. Cohen WW. Fast effective rule induction. In: In Proceedings of the Twelfth International Conference on Machine Learning. Burlington: Morgan Kaufmann; 1995. p. 115–23.
55. Cristianini N, Shawe-Taylor J. An Introduction to Support Vector Machines and Other Kernel-based Learning Methods. Cambridge: Cambridge University Press; 2000.
56. Bishop CM. Neural Networks for Pattern Recognition. Oxford: Oxford University Press; 1995.
57. Trzepacz PT, Yu P, Sun J, Schuh K, Case M, Witte MM, Hochstetler H, Hake A, Initiative ADN, et al. Comparison of neuroimaging modalities for the prediction of conversion from mild cognitive impairment to alzheimer’s dementia. Neurobiol Aging. 2014;35(1):143–51. 58. Previtali F, Bertolazzi P, Felici G, Weitschek E. A novel method and
software for automatically classifying alzheimer’s disease patients by magnetic resonance imaging analysis. Comput Methods Prog Biomed. 2017;143:89–95.
59. Jackson CE, Snyder PJ. Electroencephalography and event-related potentials as biomarkers of mild cognitive impairment and mild alzheimer’s disease. Alzheimer’s and Dementia. 2008;4(1):137–43. 60. Hampel H, Lista S, Teipel SJ, Garaci F, Nisticò R, Blennow K, Zetterberg
H, Bertram L, Duyckaerts C, Bakardjian H, et al. Perspective on future role of biological markers in clinical therapy trials of alzheimer’s disease: a long-range point of view beyond 2020. Biochem Pharmacol. 2014;88(4): 426–49.
62. Chowdhury RH, Reaz MB, Ali MABM, Bakar AA, Chellappan K, Chang TG. Surface electromyography signal processing and classification
techniques. Sensors. 2013;13(9):12431–12466.
63. Al-Timemy AH, Bugmann G, Escudero J, Outram N. Classification of finger movements for the dexterous hand prosthesis control with surface electromyography. IEEE J Biomed Health Inform. 2013;17(3):608–18. 64. Mahajan K, Rajput SM. A comparative study of ann and svm for eeg
classification. Int J Eng Res Technol. 2012;1:1–6.
65. Costantini G, Casali D, Todisco M. An svm based classification method for eeg signals. In: Proceedings of the 14th WSEAS International Conference on Circuits, Corfu Island, Greece, vol. 2224. New York: WSEAS World Scientific and Engineering Academy; 2010.
66. Wu T, Yang B, Sun H. Eeg classification based on artificial neural network in brain computer interface. In: Life System Modeling and Intelligent Computing. New York: Springer; 2010. p. 154–62.
67. Jeong J. Eeg dynamics in patients with alzheimer’s disease. Clin Neurophysiol. 2004;115(7):1490–505.
68. Pizzagalli DA. Electroencephalography and high-density electrophysiological source localization. Handb Psychophysiology. 2007;3:56–84.
![Table 3 Classification performance [%] by using M = 16 FourierCoefficients as features and a leave-one-out sampling with 72, 60,86, 109 folds for HC vs AD, HC vs MCI, MCI vs AD, HC vs CASE,respectively](https://thumb-us.123doks.com/thumbv2/123dok_us/509757.1545487/5.595.306.541.646.733/table-classification-performance-fouriercoefficients-features-leave-sampling-respectively.webp)
![Table 4 Classification performance [%] by using M = 48 WaveletCoefficients as features and a leave-one-out sampling with 72, 60,86, 109 folds for HC vs AD, HC vs MCI, MCI vs AD, HC vs CASE,respectively](https://thumb-us.123doks.com/thumbv2/123dok_us/509757.1545487/6.595.56.290.131.217/table-classification-performance-waveletcoefficients-features-leave-sampling-respectively.webp)