1381
The Development Of Higher Education In
Indonesia
Kumba Digdowiseiso
Abstract: This study tries to analyze the debates with regards to higher education issues in Indonesia such as the problem of enrollment, equality of education, capacity, the selection of college student acceptance, financing, cross-border education, as well as unemployment. In the end, the debate will lead to a strategic issue between the quality and the quantity in higher education.
Index Terms: Higher Education, Quantity of Education, Quality of Education, Indonesia
—————————— ——————————
1.
INTRODUCTION
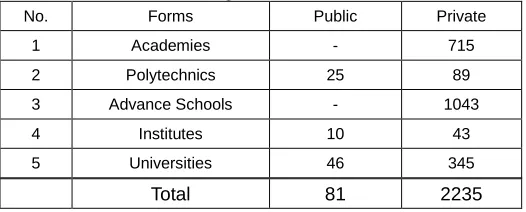
Education is the basic human rights to which everyone is entitled. Yet, the gaps in the education sector at the Indonesian regions are staggering [1]. Since education creates new assets and enhances the welfare for the whole layer of society, an equitable distribution of education is more preferable to either incomes or assets equality. Hence, ensuring access to education is a trade-off policy for each of central government in a bid to meddle with the objectivity and relevance of the industrial requirements. According to the Law No. 20/2003 on National Education System, the Indonesian higher education system consists of: (1). Academies; (2). Polytechnics; (3). Advanced schools; (4). Institutes; and (5). Universities. Academies only provide one particular discipline, either science, engineering, or art. Polytechnics focus on either applied education or some special knowledge. Meanwhile, advanced schools, similar to academies, put more emphasis on one specific knowledge. Institutes pay particular attention to one knowledge discipline. While universities concentrate on training and higher education in various disciplines. Table 1 shows that private institutions dominate most of higher educations in Indonesia. Yet, only 3.5 percent are managed by the government. According to Nizam, there was a significant increase in the enrolment rate of the tertiary education in Indonesia from about 3 percent in 2005 to more than 13 percent in 2014 [2]. There are two factors that contribute to this phenomenon, namely: (1). A sustained condition of economic growth within the Indonesian regions; and (2). The demand of the current job market.
Table 1. The Number of Higher Education Institutions in 2018
No. Forms Public Private
1 Academies - 715
2 Polytechnics 25 89
3 Advance Schools - 1043
4 Institutes 10 43
5 Universities 46 345
Total 81 2235
Source: DGHE, 2018
Despite the private organization in Indonesia has significantly
more schools than the public one, some of them have problems related to the quality of education [3]. In developed countries, those at the private sector receive a high-quality learning system and environment. Thus, the demands of the private-owned institutions has increased over time. But, the opposite condition applies in Indonesia. In this context, the private schools are a second-best choice after public schools. Higher education becomes the main priority in many developed countries since there is a robust and significant association between the investment of tertiary school and the competitiveness of countries‘ economics [4]. In developing countries, however, there is a trade-off whether to allocate sufficient financial resources in higher education or maximizing these resources on other sectors such as health improvement and poverty elimination. This paper thus examines higher education issues in Indonesia and explains why these issues become so debatable in this country.
2
CHALLENGES
IN
HIGHER
EDUCATION
2.1 Enrollment, Equity, and Capacity
Table 2 shows that the enrollment rates in Indonesian higher education increased steadily. Recently, the participation rate of higher education was considerably lower, compared to that of primary and secondary education. Yet, the rate of enrollment in Indonesia higher education is still higher than in some countries such as India, Vietnam, and Pakistan [5].
Table 2. The Development in Enrollment Rate Enrolment Rate 2011 2012 2013 2014 2015
Primary 92.3 92.4 92.5 92.6 92.8
Secondary 0.51 0.51 0.54 0.55 0.56 Higher Education 0.14 0.15 0.16 0.17 0.18 Source: SUSENAS, 2011-2015
According to Fahmi, the Indonesian tertiary enrollment rate is lower than in some other developing countries, for instance, Mexico, Malaysia, and Thailand [5]. Moreover, the Republic of Korea, one of the countries that were called ‗the emerging market countries‘ in the 1990s, has a higher rate than Indonesia, Japan, Australia, and the USA. In terms of region, there was a significant improvement in the Gini coefficient of education (see table 3). Between 2009 and 2015, national Gini decreased steadily from 0.35 to 0.32. Besides, both rural and urban Gini coefficient of education fell significantly from 0.29 and 0.36 in 2009 to 0.27 and 0.32 in 2015, respectively. ————————————————
1382 Digdowiseiso argues both local and state government mostly
put their financial resources to improve the quality of education, mainly for school infrastructure at rural area. This can stimulate the demand of education, which in turn, there is a tendency that rural area grows faster than the urban area [6].
Table 3. The Development in Education Gini
Area 2009 2011 2013 2015
Indonesia 0.35 0.35 0.33 0.32
Rural 0.36 0.35 0.34 0.32
Urban 0.29 0.30 0.28 0.27
Source: Author‘s Calculation based on SUSENAS 2009-2015 In Table 4, we can see that there is a significant improvement in average years of schooling (AYS). However, there is a dramatic improvement in the changes of rural AYS. This is due to an innate ability of students at rural area [6]. However, it might not always be true as an increasing quantity of education can lead to a significant rise in AYS [7].
Table 4. The Development in Average Years of Schooling
Area 2009 2011 2013 2015
Indonesia 6.30 6.33 6.57 6.79
Rural 5.08 5.17 5.47 5.75
Urban 7.80 7.68 8.10 8.27
Source: Author‘s Calculation based on SUSENAS 2009-2015 Table 5 shows that increasing (decreasing) standard deviations of schooling (SDS) will give an impact on decreasing (increasing) the level of education inequality [6]. Thus, SDS cannot fully gauge the equality of education in rural, urban, and Indonesia appropriately.
Table 5. The Development in Standard Deviations of Schooling
Area 2009 2011 2013 2015
Indonesia 3.94 3.92 3.90 3.99
Rural 3.35 3.40 3.36 3.58
Urban 4.07 4.12 4.08 4.14
Source: Author‘s Calculation based on SUSENAS 2009-2015 Table 6 implies that the total population in urban areas has a bigger chance to receive education than that in rural. Similarly, the male has a more substantial opportunity to extend their education than women. This is due to the possibility of the parents to give the larger opportunities of schooling to male children [6].
Table 6. The Development in Education Gini Based on Gender
Gender Region 2009 2011 2013 2015
Male
Rural 0.32 0.32 0.31 0.31
Urban 0.27 0.27 0.27 0.26
Female
Rural 0.38 0.38 0.36 0.36
Urban 0.31 0.31 0.30 0.29
Total
Rural 0.37 0.38 0.35 0.35
Urban 0.32 0.32 0.30 0.30
Source: Author‘s Calculation based on SUSENAS 2009-2015 Table 7 shows that the difference in the increment in female AYS is more tremendous than that in males. Digdowiseiso argued that improving female education is far more complex than male [6]. This is because the social preferences and parental decisions may hamper investment in female education and thus, functioning inequality.
Table 7. The Development in Average Years of Schooling Based on Gender
Gender 2009 2011 2013 2015
Indonesia 6.30 6.33 6.57 6.79
Male 6.85 6.82 7.03 7.25
Female 5.88 5.94 6.24 6.46
Source: Author‘s Calculation based on SUSENAS 2009-2015 In Table 8, there was an improvement in male SDS and a decrease in female SDS. Intuitively, this result should give a positive and negative impact on the male Gini and the female Gini, respectively. However, both male and female Gini education falls significantly in Table 6. Hence, this finding corroborates the results in Table 5.
Table 8. The Development in Standard Deviations of Schooling Based on Gender
Gender 2009 2011 2013 2015
Indonesia 3.94 3.92 3.90 3.99
Male 3.92 3.96 3.82 3.95
Female 3.99 4.02 3.96 3.98
Source: Author‘s Calculation based on SUSENAS 2009-2015
2.2 Admission in Public University
1383 universities' management is not under the authority of the
government or the ministry of national education, as they change to become more privatize universities in their admission system. For example, the University of Gadjah Mada, one of the first legal public universities, has opened an independent admission examination since 2003. This path of admission is similar to the private university admission system as it requires an extra financial contribution. The maximum contribution is IDR 100 million (US$ 7,143) for students who enrolled in medicine faculty whereas the faculty that required the smallest contribution is science faculty, IDR 8 million (US$ 571). This condition becomes a big blow for those who come from low socio-economic backgrounds, while the number of scholarships is limited. At present, the number of students on scholarship is only around 11 percent of the total number of students.
2.3 Financing
Financing is the most crucial indicator of education. Psacharopoulos‘s study (cited in Digdowiseiso) on financing in higher education provides an astonishing result where the average cost of a university student in developing countries is 88 times bigger than that of a primary school student [6]. In fact, this circumstance is different from developed countries (e.g. the U.S., the U.K., and Australia) where their ratio is about 17.6. From the government of developing countries perspective, another issue is that there is a dilemma whether they either maximize their education budget on higher education and spend less on primary and secondary education or give both primary and secondary education more funds than higher education or provide the same proportion of the fund in these three sectors. According to Selvaratnam (cited in Fahmi), the lack of funding becomes the main problem in most developing countries to expand access to higher education [5]. Therefore, he suggests that the government must give first priority to primary education and the subsidy for higher education have to be yanked out. He believes that privatization on higher education enhances efficiency and reduces inequality as in the fact the wealthier gains more from this subsidy. However, Mohamedbhai (cited in Fahmi) refutes this claim and argued that privatization on higher education and subsidy retraction in developing countries lower people‘s participation due to the increase in tuition fees [5]. Thus, the opportunity of developing countries to pursue the technology and knowledge becomes small and the gap becomes big. Despite the low enrollment rate, Indonesia's government has a similar pattern with some developed countries such as Australia and the USA in the proportion of educational expenditure in higher education. Indonesia's proportion of public expenditure in higher education is higher than in Japan, the Republic of Korea, Mexico, and India. Nevertheless, Indonesia's public expenditure per person as a percentage of GDP per capita is lower than in most countries. Indonesia is merely slightly higher than in the Republic of Korea. Aside from government expenditure, funds from agencies such as the World Bank and Asian Development Bank appear to be the significant sources of funding [5].
Table 9. Public Expenditure on Higher Education in Some Countries
Exp Aus Ina Japan Malay Korea Mex US India Public 22.48 13.27 19.61 93.69 9.34 44.07 26.68 68.57
Educ 23.92 23.16 16.80 34.99 13.60 16.86 26.25 20.09 Source: World Development Indicator (WDI), 2017.
Meanwhile, the main source of financing in public universities is from the government budget, which gives a contribution of 60 percent, besides the funds from students‘ tuition fees (40 percent). According to the government's calculation, one student in public university needs about US$ 2,500 per year to achieve a high-quality education, whereas the government just provides US$ 1,000 per year averagely [8]. Moreover, a student in a public university normally pays the tuition fees from US$ 50 to US$ 500 per year. On the other hand, another student from the private university has to spend between US$ 500 and US$ 7,000 per year. Thus, many universities seek to open special or extension programs to cover the high cost of quality in education. However, this program has been criticized because most of public universities tend to lower their quality of education by giving the different curriculum and academic staff. Another problem relating to financing on higher education is capital flight [8]. If the government gives a lower priority of funding in higher education, this could hamper the quality of higher education itself and most importantly, the gap between higher education quality in domestic countries and that in foreign countries becomes much wider than the previous period. Thus, many parents tend to invest higher education in institutions in foreign countries that offer a high quality of education and this circumstance takes place in Indonesia where the trend has increased over time.
2.4 Cross-Border Education
1384 host countries should also take into account the pros and cons
of implementing cross-border education when they make a plan to diffuse the system into their higher education programs. The society in the host countries should also be informed about cross-border education and how to evaluate the different programs offered, because only when the public can make informed decisions will cross-border education be beneficial and have an added value for the host countries. Third, most people in developing host countries cannot differentiate amongst cross-border education programs. For instance, most cross-border programs advertise that their programs are accredited without mentioning by which accreditation body, so that one cannot know whether that accreditation body can be trusted. Last, cross-border education in this era of globalization should become a ‗means of sharing‘. Without adequate quality assurance, system of sharing and development of networks, the host countries will be put under great pressure and sufferance.
2.5 Unemployment
According to the Statistic Agency of Indonesia (BPS), in 2009, 740,200 (7.1%) was categorized as educated unemployment. In 2018, the number of educated unemployment rose significantly at 10.02%. Some blame the curriculum that is not relevant to the needs of society. Moreover, there is an external efficiency where many graduates work in areas outside their area of competencies and knowledge. Although some feel that they have been well educated to be able to work outside their ‗comfort zone‘, others feel that such a condition is a waste of resources. At present, only 25 percent of higher education graduates got a job that matches with their expertise. In terms of macro perspective, the rise on the number of educated unemployment and the emerging of external efficiency phenomenon are caused by several factors: (1). An education policy that is not oriented with market needs; (2). Economic policy, particularly investment, that is not capable to provide occupations for this type of unemployment; (3). Development economic policy that tends to capital intensive rather than labor-intensive; (4). Market becomes ―saturated‖ with some of the courses; and (5). Supply induce symptom where a lot of educated workers gives strong pressure to a small number of formal sectors. On the other hand, in terms of micro perspective, those problems are caused by the character and student‘s academic potential. Denison and Chung (cited in Digdowiseiso) argued that educated unemployment must answer the challenge to create their own job without over-reliance on the job market conditions or employers [1]. In other words, he strongly supports the argument of creating entrepreneurship culture in students. Also, the government has to give an incentive for the informal sector as it has unlimited ability to absorb many workers. Some argue that the curriculum is blamed for what happens in Indonesia. From primary school to a degree, many students are taught in terms of the theoretical framework without combining a practical aspect. Thus, we create a graduate who does not ready and is less competitive in the job market. The government of Indonesia reintroduced the ‗link and match‘ concept that focuses on how education policy, especially the curriculum, fits with the industry needs. However, the problem of this concept is to what extent this concept can be poured forth in a more operational framework. In terms of functional, some private universities have applied this program where many industry practitioners become lectures. Moreover, an internship may be
one of the quick and appropriate alternative solutions for the above problems.
3 CONCLUDING
REMARKS
The economic crisis blamed by the government affects the decline of the household income and government's budget. The decline of household income is followed by a decrease in the educational expenditure of households in low socio-economic status. The limitation of the budget forces the government to provide more priority in basic and secondary education. The Indonesia Constitution explains the government's responsibility to allocate a minimum of 20% of the national budget or a minimum of 5% of GDP on the education sector. Yet, it is impossible to reach this kind of expectation while we need a breakthrough to improve quality assurance, equality access on education, capacity, and enrollment. The government has to create a tax deduction policy for both individuals and firms so that they can contribute to an endowment fund in education institutions. Unfortunately, this is just an expression due to both the law of the National Education System have not touched a social capital mobilization in the context to enhance transformation in the national education system. There are some arguments that to achieve a high quality of education the government can either provide more scholarships for students and academic staff overseas or builds high-quality institutions in the domestic country. However, the latter does not fit in the context of higher education development in Indonesia due to political economy problems such as a costly bureaucracy. On the other hand, the former will be applicable in Indonesia in the sense that they receive knowledge from what they got during the period of schooling and implement the programs in higher education institutions in Indonesia.
ACKNOWLEDGMENT
The authors wish to thank University of National, Jakarta, Indonesia for the funding, and several colleagues within Department of Economics and Department of Public Administration for the inputs and comments.
REFERENCES
[1] Digdowise, K. 2018. ―Reexamining the Economic Growth – Education Inequality – Income Distribution Nexus in Indonesia‖. Journal of Applied Economic Sciences, 58(4): 987-996
[2] Buchori, M. and Malik, A. 2014. Asian Universities: Historical Perspectives and Contemporary Challenges. Baltimore: Johns Hopkins University Press
[3] Nizam. 2016. The Need for Higher Education Reform in Higher Education in East Asia. Paris: UNESCO
[4] Hurley, D., Mcbain, L., Harnisch, T., and Russell, A. 2018. Top 10 State Policy Issues for Higher Education in 2008. Washington, D.C.: American Association of State Colleges and Universities
[5] Fahmi, M. 2007. Indonesian Higher Education: Chronicle, Recent Development, and New Legal Entities Universities. Victoria: La Trobe University Press
[6] Digdowiseiso, K. 2010. ―Measuring Gini Coefficient of Education‖. MPRA Paper, No. 19865. Retrieved from
https://mpra.ub.uni-muenchen.de/19865/1/MPRA_paper_19865.pdf
1385 Evidence from an Unusual Policy Experiment‖. The
American Economic Review, 91(4): 795-813
[8] Tadjudin, M. K. 2005. ―Country Paper on Indonesia Higher education in Indonesia and the role of cross-border higher
education‖. Retrieved from