Canopy Removal On Satellite Images Using
Classification And Contrast Enhancement
Dr. M. Prabu
Abstract : The increasing the usage of satellite remote sensing for a civilian purpose has proved to be the most cost-effective mapping environmental changes with regard to natural resources, particularly in developing countries. Forests as one part of the wildlife of human societies in economic growth and permanency of natural resources in the countries of the world. But because of various details such as the growth of population, progressively varying forest to the other unfitting applications such as agriculture, providing energy and fuel, millions of hectares from the natural means are destroyed every year, and the remainder of the surface changes quantitatively and qualitatively. For better management of the forests, the evolution of forest area and rate of forest concentration should be examined. It is achievable that, there isn’t any change in the field of the forest during the time, but the density of forest canopy is changed. Estimation of forest canopy cover has recently become an essential part of the forest. Therefore, the research study is to develop Forest Canopy Remover, which is used to get an accurate result of Forest and deforested area from the satellite earth images. It is used to calculate forest density using vegetation. Then, the changes in area and forest density during a particular period can be distinguished.
Keywords: Remote Sensing, Image Processing, Canopy removal, Land use, Data mining.
—————————— —————————
1. INTRODUCTION
There are many techniques to remove the cloud from the raw satellite image. The study proposing a new method for canopy or cloud removal of satellite images efficiently. In satellite images, there will be a removing of shadows, noises, contrast, and cloud. From this, the study going to do remove the cloud only for the particular area from the image as the study has taken. Satellite images used in many ways, such as mapping landcover changes, deforestation, and agriculture change detection. In spite of all these advantages, the study has a disadvantage of the cloud in the images, due to that the image quality will be affected. To overcome this, the study proposes canopy removal, which can remove all the clouds and get a clear image of that area. In the study propose a satellite image to show in which area the cloud is affected. Using canopy removal, the study can get the accurate result of the area from the image as well as the study getting a clear vision without any cloud disturbances.
2. LITERATURE SURVEY
Cloud filtering methodology for the use of optical satellite images in the sustainable management of tea plantations. The study describes remote sensing that can be used for estimating the area of cultivation in the cloud. The cloud is one of the significant to extract information from tea lands using remote sensing images. The data used in this paper is LANDSAT 7 (ETM+) raw images (2001 and 2003) Aster.The methodology used in this process is pre-processing, processing and validation. In pre-pre-processing, they used data acquisition, importing the images, image to image registration and subset images. For processing the satellite image, the study used cloud filtering and filling out missing information in satellite images used to gives the absolute pixel values. The accurate result of this study is, performing better shadow detection and it provides a high sensitivity to cloud areas. It can identify the dense clouds as well as thin clouds. The conclusion of this paper is used
in three different variations they are NDVI, DVI, RVI maps. The thermal band can detect large clouds as well as thin clouds. Study is more beneficial on change detection using satellite image processing [1]. Removal of cloud cover in image data processing paper describes a cloud cover is a persistent problem with image processing in tropical regions of the world. Srilanka is also facing the same problem in acquiring cloud-free satellite imageries. In optical satellite imageries, there is always a problem with clouds. Whenever the study purchase satellite images, it is complicated to find cloud-free images. Hence, making some hindrance in data extraction on the area where the cloud is covered. A simple way of overcoming this problem with substitute temporal cloud-free Satellite images. It belongs to some imagery and taken on the same locality. The procedure of this paper is easy to overcome this problem. The satellite images are now widely used in almost all fields of studies and the optical multispectral satellite imageries such as TM-Landsat, Quick bird, Ikonos, etc. And there are many methods to developed for removing cloud cover from the imageries. This method is used to remove clouds in Quick bird images using temporal substitute images of cloud-free. The whole process is carried out through image processing Software Called GeoView. The methodology used in this process is here the study merges two images, cloud, and temporal image. These two images are made as forming blocks, and then it will go to geometric and radiometric correction. And finally the study gets the input from the cloud image then it will be given in the form of mosaicking that as done to have a block as single image. The conclusion of this paper is only applicable when there is an overlapping in temporal images of the same locality having the free cloud portion of the image [2] . Partially automated cloud/shadow removal and land cover change detection using satellite imagery study described multi-platforms and multi-temporal satellite data facilities to analysis the successive change over the more extended period by forest biomass with helping of the REDD (Reducing Emissions from Deforestation and forest Degradation) mechanism. In this study, a semi-automated method has been devised for cloud, haze removal, and land cover detection. In this method, cloud pixels are replaced by free pixels of the same image with the help of the PALSAR image. Optical, as well as SAR sensors, these two ————————————————
350 sensors are suitable for ALOS (Advanced Land observe
Satellite) satellite imagery. The land cover opens a new application, such as REDD. Remote sensing is a main information basis for land cover and forest assessment, and it provides image as wider area like faster and cost-efficient manner [3]. There are several satellites have been launched such as optical and SAR (Synthetic Aperture Radar). The data used in this paper is LANDSAT 5 Thematic Mapper (TM), LANDSAT 7 Enhanced Thematic Mapper Plus (ETM+), and ALOS AVNIR-2. The methodology used in this paper is Analyzed the optical satellite images that produce the shadow area, clear area, and haze area. The conclusion of this paper is cloud, haze removal and land cover change detection has good result. The study involves less human intervention, and the study can easily classify the imagery for extracting the land cover in wide variety of landscapes. The semi-automated methodology allows a large number of imageries in less time [4][5]. Forest canopy density monitoring using satellite images study described a satellite remote sensing plays a crucial role in determining, enhancing, and monitoring the overall carrying capacity. Remote sensing has playing a essential role in generating information about forest cover, vegetation type, and land-use changes. The conventional methods for forest density estimation are measurements with instruments, aerial photos, and satellite image interpretation, and satellite-based approach. There are different conventional remote sensing methods such as slicing, image arithmetic, segmentation, and multispectral image classification [6]. The data used in this paper is TM and ETM+. In this they used a model called FCD (Forest Canopy Density Model). There are four indexes methodology used in this paper they are Advanced Vegetation Index (AVI), Bare Soil Index (BI), Shadow index (SI), and Thermal Index (TI). The conclusion of this paper indicates a higher correlation and accuracy compared to the conventional remote sensing method. The FCD model is beneficial for monitoring and management with less ground truth survey [7]. Assessment of urban forest canopy cover mapping study describes in an urbanized region otherwise called a developed region were the area covered by tree and shrub canopies. The fundamental measure of urban forest structure determines the ecologic functioning as well as influencing actions needed to manage the forest. The methodology used in this paper is, they used three photograph interpretation result were compared to estimate. The first estimation was taken directly from Rowntree which is used for photographic prints, there are two types of canopies used for random point locations they are tree canopy and nontree canopy, and the amount of the area covered by the tree canopy was recorded, and it was calculated the standard sampling error. The conclusion of this paper is, it provides useful data on the distribution of urban forest resources as well as estimating various ecosystem services. The usage of airborne to assess urban forest canopy cover and offers reliable results. But limitations and accuracy of the imagery and classifications processes are understood [8]. Cloud-free satellite image mosaics with regression trees and histogram matching paper described the cloud-free optical satellite imagery to simplify remote sensing, but the land cover phenology limits existing solutions to persistent cloudiness to compositing temporally resolute and spatially coarser imagery. In optical
multispectral, monoscopic and stereoscopic images of the earth surface. The algorithm used in this paper is threshold algorithm. The methodology used is Hall’s and Histogram. The conclusion of this paper is the satellite images have proposed a technique for relative radiometric correction of cloudy multitemporal. It successfully normalizes the cloudy image[14] [15]. The study of shadow analysis in high-resolution satellite imagery of urban areas described the possibility of urban mapping in high-resolution satellite imagery. This paper tests about removing shadows. After removing the shadow from the image, the image will be shown in good quality. The methodology used in this is shadow detection and shadow removal. The shadow in an image depends on the reflective of the object. The conclusion of this paper is used to remove and detect the shadows in high-resolution satellite imagery. Removing the shadow from the image is a very difficult challenge to separate. But in this paper, they have proven the problem must be resolved with the help of high-resolution satellite imagery [16].
3. METHODOLOGY
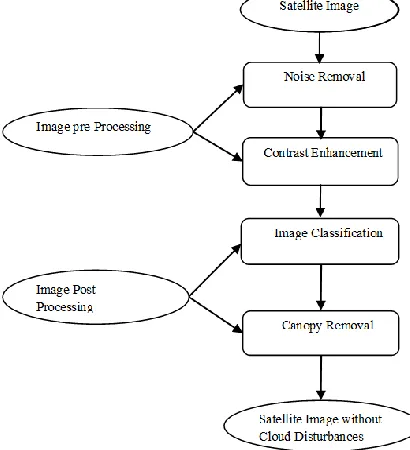
In a satellite image, image features get from the image pre-processing. In this, the study can easily remove the noise of the image as well as the study can equalize the contrast enhancement from two different images. After completion of image pre-processing, the study uses the image post-processing. The study can easily classify the images as well as use the canopy removal. If cloud affects an image in any of the area the study can easily remove that cloud with the help of canopy removal. The image will be shown without affect any cloud disturbances. In this paper the study proposes a canopy removal to remove the cloud for the particular area from the image. After removing the cloud the study gets an accurate result of the particular area from the image.
Figure 1: Architecture diagram of proposed method.
3.1 Data used
Google Earth is a great addition to growing a set of software solutions to viewing the satellite image data
around the world. While the Google Earth satellite image does not match the quality of traditional high-resolution satellite images. And it is an useful way to determine the coordinates of the location. Google Earth images exists in different formats such as Google Earth Plus, which adds to support for the GPS device, data importing, and better way to printing, and Google Earth pro, which includes other enhancements, performance is faster and better measurement tools. And a module to create the fly-in movies. Nowadays, many television news networks will utilize the fly-in movies and the feature used to zoom the location. Google has an application that uses the same satellite data called Google Earth.
3.2 Image pre-processing
The image processing toolbox provides the standard algorithms for pre-processing and post-processing tasks that solve the frequent system problems such as interfering noises, low dynamic range and the difference between the color representation of input and output devices. The study discusses only pre-processing. The pre-processing images commonly involves removing the low frequency background noise, the intensity of individual images will be normalizing, removing reflections, and masking the portions of images. The pre-processing is the technique of enhancing the data images before computational processing.
3.2.1 Noise Removal
Imagine in an image with noise is corrupted with the binary image (black and white). Half of the pixels are thrown away and replaced by the random gray values ranging from black to white. The image restoration is used to removing the noise from the image in such a way that the original image is discernible. The existing features is used to decide that the very small scale in the image are noise and that removing these while maintaining the more extensive features might help clean things up. The simplest image is replacing in each pixel by the average of the neighboring pixel values.
3.2.2 Image Enhancement-Contrast
The image enhancement is used to improve the interpretability or perception of information in images for human viewers. In image processing technique the image enhancement is used to provide better input. A method of improving by the definition of video picture in the point of view by the computer program, which reduces the lowest grey values to black and the highest grey level to white, and it is used for pictures from microscopes, cameras, and scanners. The techniques in image processing toolbox is used to enable you to increase the signal-to-noise ratio and accentuate image features by modifying the colors or intensities of an image. Enhancement technique to improvise the satellite image is divided into two methods they are, spatial domain method and frequency domain method.
3.3 Image Post-Processing
352 3.3.1 Image Classifications
Image Classification is perhaps an essential part of digital image analysis. It is beneficial to have a ―pretty picture‖ in an image. And it showing the magnitude of colors illustrating the various features. But it is quite useless and unless to know what the color mean. There are two main methods can be divided into image classification they are supervised classification and unsupervised classification. The image classification is used to refers to the task of extracting the information classes from a multiband raster image.
3.3.2 Canopy Removal
The canopy removal is used to remove the covering clouds in an image. In the image, they are so many clouds that are affected. As per affecting the cloud in an image, the quality of image will not be clear. To avoid this, the study using a cloud removal so that the study are getting good image as well as a precise image without any cloud disturbances.
Figure 2: Original color satellite image before processing.
This is the original color image, and this image is affected by the cloud. This image will take from the google earth satellite image. From this image the study finds the grayscale image, histogram values, matching colors, and non-matching colors.
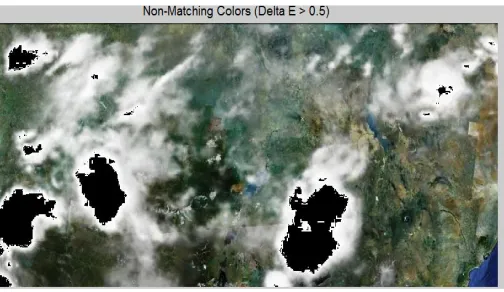
Figure 3: Non matching satellite image after processing
This is the non-matching color display where the cloud is affected based on the region drawn. And it gives the cloud a binary color image. This image shows some of the clouds only.
Figure 4: Satellite image of after post processing to catch disturbing regions.
4. RESULTS AND DISCUSSION
The result is to display the image without any cloud disturbances so that the image quality will not affect any cloud and it gives a clear image. In this paper, the study uses a domain called Image processing. In this paper, the study discussed about how to remove the clouds from the google earth satellite image. The MATLAB coding is easy to understand line by line as well as easy to run the program. First the study took the image with clouds that is an original image. From that, the study drew a particular place where the cloud is affected. The next step is, the image will display only where the clouds are affected. Then it shows the histogram values as the study drew a particular place.
5. CONCLUSION
In this paper the study discusses about how to remove the cloud from the google earth satellite image. In that image there are so many clouds are affected due to that the image quality will be affected. To achieve this, the study proposes ―canopy removal‖, through which can remove all the clouds and get a clear image of that area. In this paper the study proposed a satellite image to show in which area the cloud is affected. Using canopy removal, work can get the accurate result of the area from the image as well as getting a clear image without any cloud disturbances.
6. REFERENCES
[1] R. Premalal and D. S. Head, ―Cloud Filtering Methodology for the Use of Optical Satellite Images in Sustainable Management of Tea Plantations.‖ [2] P. G. Aroos, Mohamed, ―Removal of Cloud Cover in
Image Data Processing,‖ ACRS, 2008.
[3] N. S. Kumar, M. Prabu, and S. Assistant, ―DEFORESTATION IDENTIFICATION MODEL USING,‖ pp. 2–7.
[4] A. K. Sah, B. P. Sah, K. Honji, N. Kubo, and S. Senthil, ―Semi-Automated Cloud/Shadow Removal and Land Cover Change Detection Using Satellite Imagery,‖ ISPRS - Int. Arch. Photogramm. Remote Sens. Spat. Inf. Sci., vol. XXXIX-B7, no. September, pp. 335–340, 2012.
vol. 25, no. 1, pp. 1–2, 2014.
[6] S. Area, V. District, and T. Nadu, ―Application of Satellite Remote Sensing to find Soil Fertilization by using Soil Colour,‖ Int. J. Online Eng., vol. 9, no. 2, pp. 44–49, 2013.
[7] M. S. Jamalabad and A. A. Abkar, ―Forest Canopy Density Monitoring , Using Satellite Images - Semantic Scholar,‖ Proc. XXth ISPRS Congr., 2004. [8] E. M. Barnes et al., ―Remote- and Ground-Based Sensor Techniques to Map Soil Properties,‖ Photogramm. Eng. Remote Sens., vol. 69, no. 6, pp. 619–630, 2003.
[9] M. Prabu and S. M. Anouncia, ―Prediction of Land Cover Changes in Vellore District of Tamil Nadu by Using Satellite Image Processing,‖ in Knowledge Computing and its Applications, Springer, 2018, pp. 87–100.
[10] E. H. Helmer and B. Ruefenacht, ―Cloud-free satellite image mosaics with regression trees and histogram matching,‖ Photogramm. Eng. Remote Sensing, vol. 71, no. 9, pp. 1079–1089, 2005. [11] N. -, A. Nasr, M. ElSaban, and H. Onsi, ―Spatial
Cloud Detection and Retrieval System for Satellite Images,‖ Int. J. Adv. Comput. Sci. Appl., vol. 3, no. 12, pp. 212–217, 2012.
[12] M. Prabu and S. Margret Anouncia, ―NDVI generation of chlorophyll from OCM data for the Indian ocean region using multispectral images,‖ Res. J. Pharm. Biol. Chem. Sci., vol. 7, no. 5, 2016. [13] M. G. V. Kannan, ―Paddy Yield Estimation Using
Remote Sensing and Geographical Information System,‖ J. Mod. Biotechnol., vol. 1, no. 1, pp. 26– 30, 2012.
[14] S. M. Anouncia and M. Prabu, ―Distributed Computing Model of Multispectral Time Series Data Analysis for Chlorophyll Concentration Determination Using Ocean Color Monitor-2 Data,‖ J. Test. Eval., vol. 47, no. 6, 2019.
[15] S. Biday and U. Bhosle, ―Relative radiometric correction of cloudy multitemporal satellite imagery,‖ World Acad. Sci. Eng. Technol., vol. 39, pp. 254– 258, 2009.