795
Development Of RP-HPLC Procedure And Forced
Stability Studies For Lotion Formulations Of
Tazarotene And Halobetasol
T. Sravanthi, N. Madhavi
Abstract : In the current research, an isocratic, novel RP-HPLC method was developed for quantifying tazarotene and halobetasol simultaneously. The HPLC method was optimized using the Waters C18 column (150 mm × 4.5 mm; 5 µm), employing simple isocratic method. Experimental parameters were standardized, including mobile phase, pH, wavelength detection and flow rate. The method has been validated in conformance with the guideline frame of ICH. This method was apt for determination of tazarotene and halobetasol in bulk and lotion formulation samples with suitable precision (relative standard deviation: 0.135-0.189% for tazarotene and 0.229-0.472% for halobetasol), accuracy (recovery: 98.66-100.70% for tazarotene and 98.21-100.09% for halobetasol) and linearity (2.25-11.25 μg/ml for tazarotene and 0.5-2.5 µg/ml for halobestol). This method has a better ability in the routine analysis of tazarotene and halobetasol in bulk and lotion formulations. The present method was successfully applied to l otion formulations for assessment of stability of tazarotene and halobetasol under basic, acidic, oxidative, photolytic and thermal conditions.
Index Terms : Tazarotene, Halobetasol, Topical lotion, Analysis, Stability study
—————————— ——————————
1
INTRODUCTION
Tazarotene is a representative of the retinoid acetylene group. Tazarotenic acid, an active metabolite of tazarotene is produced by deesterification in the cells [1,2]. Tazarotenic acid binds to the forms of retinoic acid receptor alpha, beta and gamma. Tazarotenic acid shows selectivity for retinoic acid receptor forms of beta and gamma, and may alter the expression of genes [3]. Tazarotene is used for treating skin damaged by sun, psoriasis and acne [4-7]. Halobetasol is a corticosteroid of synthetic nature with antipruritic, vasoconstrictor and anti-inflammatory activities [8]. Halobetasol binds to corticosteroid receptors of intradermal and dermal cells, and activates anti-inflammatory protein gene expression. Prostaglandin and leukotrienes are strong inflammatory mediators. Arachidonic acid induces the synthesis of prostaglandin and leukotrienes. Halobetasol inhibits arachidonic acid release by inducing phospholipase A2 inhibitory proteins [9]. Halobetasol reduces skin conditions like eczema, dermatitis, psoriasis and rash [10,11]. DuobriiTM topical lotion was authorized by the US FDA in April
2019 for the therapy of plaque psoriasis in adults [12-14]. Each gram of DuobriiTM topical lotion contains (0.01%) 0.1 mg of halobetasol and (0.045%) 0.45 mg of tazarotene. The literature survey revealed that no analytical method is stated to simultaneously quantify halobetasol and tazarotene simultaneously in lotion formulation. The aim of this study was to develop a new stability indicating liquid chromatographic method for the simultaneous estimation of halobetasol and tazarotene in lotion formulation.
2
EXPERIMENTAL
SECTION
2.1 Solvents and chemicals
Reference drugs of halobetasol and tazarotene were obtained from Glenmark pharmaceuticals limited, Mumbai. DuobriiTM topical lotion formulation (Bausch Health Americas, Inc. USA) was purchased. Solvents (acetonitrile and methanol) of HPLC grade were obtained from Qualigens Fine Chemicals Ltd, Mumbai, India. Milli-Q water processed by water purification system, Milli-Q (Millipore, Merck, Germany), was used. Analytical grade acids (HCl and orthophosphoric acid) and analytical grade chemicals (potassium dihydrogen phosphate, sodium hydroxide and peroxide) were obtained from M/s. Rankem Chemicals Ltd, India.
2.2 Instrumentation
Agilent 1100 series HPLC system with Quaternary pump (G1311 A), column temperature control (COLCOM G1316A), autosampler (G 1329A) and UV detector (G1314 A) was used in this analysis. The HPLC system was controlled and integrated with Agilent Chem Station LC software. Waters C18 (150 mm × 4.5 mm; 5µm) column was utilized to separate and analyze halobetasol and tazarotene.
2.3 System condition for the analysis
Methanol and 0.1 M potassium phosphate buffer (45:55 v/v) mixture at a flow rate of 0.9 ml/min in an isocratic elution mode was employed as mobile phase. The pH was set to 5.8 with 1% orthophosphoric acid. The detector wavelength, injection volume and column temperature were set at 231 nm, 20 μl and ambient temperature, respectively.
2.4 Standard solutions
The mobile phase was utilized as diluent for preparing standard solutions. Stock solution of halobetasol (100 μg/ml) and tazarotene (450 μg/ml) were prepared in mobile phase. Appropriate dilution of halobetasol and tazarotene stock solution was made to provide five-level calibration solutions with the following concentrations:
Halobetasol – 0.5, 1.0, 1.5, 2.0 and 2.5 µg/ml. Tazarotene – 2.25, 4.5, 6.75, 9.0 and 11.25 µg/ml.
________________________
T. Sravanthi, Department of Chemistry, Acharya Nagarjuna University, Nagarjuna nagar, Guntur, Andhra Pradesh, India - 522510.
796 For validation study, halobetasol and tazarotene stock
solution was diluted to get solution with concentration 1 μg/ml of halobetasol and 4.5 μg/ml of tazarotene.
2.5 Calibration curve
Five concentrations ranging from 0.5 μg/ml to 2.5 μg/ml of halobetasol and 2.25 μg/ml to 11.25 μg/ml of tazarotene was prepared for calibration curves. Each concentration solution was infused into the system and assessed using the suggested method. To prepare the calibration curves, the peak areas of chosen analytes have been plotted against the respective concentrations of chosen analytes. The equation of regression was determined using data of concentration and peak area.
2.6 Assay of tazarotene and halobetasol in lotion formulation
An accurately weighed 10 gm of DuobriiTM topical lotion (equal to 1 mg of halobetasol and 4.5 mg of tazarotene) was transferred into 100 ml volumetric flask. 30 ml of solvent mixture (acetonitrile and methanol - 40:60 v/v) was added and heated on water bath set with 50 °C for 10 min. Cool to room temperature and volume was made up to 100 ml using the same solvent system. The solution was filtered via 0.45 μm nylon membrane filter. Approximately 1 ml of the above solution was diluted to 10 ml with diluent to obtain a solution containing halobestol and tazarotene at concentrations of 1.0 μg/ml and 4.5 μg/ml, respectively. This solution was infused into the system and assessed using the suggested method. Halobestol and tazarotene content in lotion formulation was calculated using the corresponding calibration curve or regression equation.
2.7 Degradation studies
In order to get an indication of the stability indicating ability and specificity of the current method, forced degradation studies have been conducted for halobetasol and tazarotene lotion sample. The forced degradation study was conducted under the following criteria [15]:
2.7.1 Acid hydrolysis
1 ml of halobetasol (10 μg/ml) and tazarotene (45 μg/ml) lotion sample and 5 ml of 0.1N HCl were added to a 10 ml flask. The contents were kept for 24 hr at room temperature. The solution was subsequently neutralized with 0.1 N NaOH and diluted in the mobile phase to obtain a concentration of 1 μg/ml halobetasol and 4.5 μg/ml tazarotene. This solution was infused into the system and assessed using the suggested method.
2.7.2 Alkali hydrolysis
1 ml of halobetasol (10 μg/ml) and tazarotene (45 μg/ml) lotion sample and 5 ml of 0.1 N NaOH were added to a 10 ml flask. The contents were kept for 24 hr at room temperature. The solution was subsequently neutralized with 0.1 N HCl and diluted in the mobile phase to obtain a concentration of 1 μg/ml halobetasol and 4.5 μg/ml tazarotene. This solution was infused into the system and assessed using the suggested method.
2.7.3 Peroxide oxidation
1 ml of halobetasol (10 μg/ml) and tazarotene (45 μg/ml) lotion sample and 5 ml of 3% peroxide were added to a 10 ml
flask. The contents were kept for 24 hr at room temperature. The solution was subsequently diluted in the mobile phase to obtain a concentration of 1 μg/ml halobetasol and 4.5 μg/ml tazarotene. This solution was infused into the system and assessed using the suggested method.
2.7.4 Photolysis
1 ml of halobetasol (10 μg/ml) and tazarotene (45 μg/ml) lotion sample was kept for 24 hr in UV chamber (254 nm). The solution was subsequently diluted in the mobile phase to obtain a concentration of 1 μg/ml halobetasol and 4.5 μg/ml tazarotene. This solution was infused into the system and assessed using the suggested method.
2.7.5 Thermal lysis
1 ml of halobetasol (10 μg/ml) and tazarotene (45 μg/ml) lotion sample was kept for 24 hr in oven (60 oC). The solution was subsequently diluted in the mobile phase to obtain a concentration of 1 μg/ml halobetasol and 4.5 μg/ml tazarotene. This solution was infused into the system and assessed using the suggested method.
3
RESULTS
AND
DISCUSSION
3.1 Optimizing the method
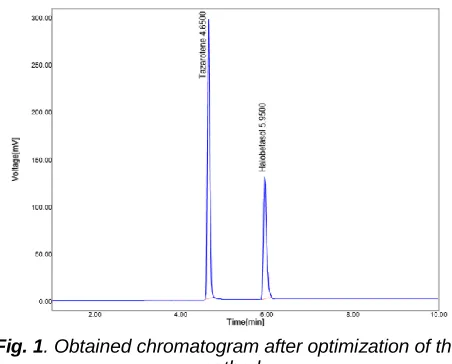
The technique was configured to develop a method for separating and analyzing halobetasol and tazarotene with good system suitability findings. The chromatography conditions were established after testing two stationary phases (Zodiac C18 column and Waters C18 column) and mobile phases having different proportions of organic solvent (acetonitrile/methanol) and water, with and devoid of buffer solutions (0.1 M phosphate buffer/0.1 M acetate buffer) at distinct pH values. Finally, methanol and 0.1 M potassium phosphate buffer (45:55 v/v) mixture with pH 5.8 value at a flow rate of 0.9 ml/min in isocratic elution mode was adopted. The halobetasol and tazarotene were determined with UV detection at 231 nm (isobestic point). Retention times of halobetasol and tazarotene were 5.95 and 4.65 min (Fig. 1), respectively, allowing quick determination of halobetasol and tazarotene.
Fig. 1. Obtained chromatogram after optimization of the method
797 quality data [16-18].
TABLE1
VALUESOFSYSTEMSUITABILITYFORSELECTED
ANALYTES
Parameter Results Recommended value [16-18]
Retention time
Tazarotene – 4.65 min Halobetasol – 5.95
min
-
Resolution Halobetasol – 6.41 Tazarotene– ……. ˃ 2.0
Theoretical Plates
Tazarotene – 4183
Halobetasol - 6756 ˃ 2000 Tailing Factor Tazarotene – 0.84
Halobetasol-1.11 ≤ 2.0
3.2 Method validation
This was achieved in alignment with ICH guidance [16].
3.2.1 Selectivity
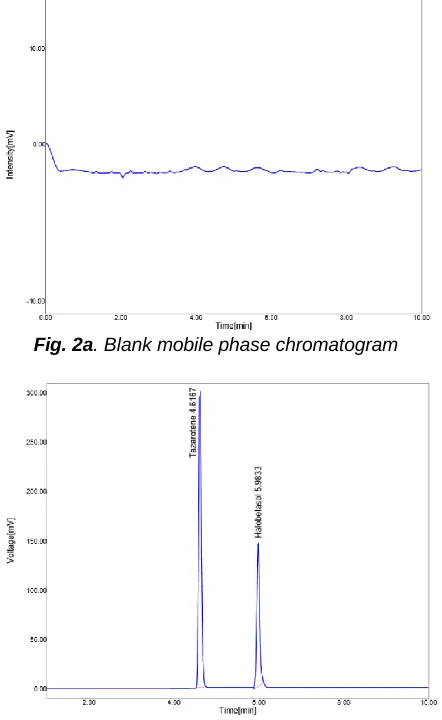
Selectivity was assessed by injecting blank mobile phase standard solution (halobetasol-1 μg/ml and tazarotene-4.5 μg/ml) and lotion sample (halobetasol-1 μg/ml and tazarotene-4.5 μg/ml) to ensure no obstruction peaks at halobetasol and tazarotene retention times. The chromatograms are given in Fig. 2a, 2b and 2c. Halobetasol and tazarotene peaks were not co-eluted with any extra peak. Therefore, It was determined that the method was selective to analyze halobetasol and tazarotene.
Fig. 2a. Blank mobile phase chromatogram
Fig. 2b. Standard solution chromatogram
Fig. 2c. Lotion sample chromatogram
3.2.2 Linearity
Linearity of the procedure was determined over a quantitative range of 0.5 2.5 μg/ml for halobetasol and 2.25 μg/ml-11.25 μg/ml for tazarotene (Fig. 3a and 3b). Excellent association among analyte peak area and drug concentration was accomplished with R2 ˃0.999 for halobetasol and tazarotene (Fig. 3a and 3b).
3.2.3 Detection limit & Quantitation limit
For sensitivity assessment, the limit of quantitation and limit of detection were determined at a signal to noise ratio of around 10 and 3, respectively. The results pointed out that the limit of detection were 0.02 μg/ml for tazarotene and 0.01 μg/ml for halobetasol. The limit of quantitation for tazarotene was 0.066 μg/ml and for halobetasol, limit of quantitation was 0.033 μg/ml.
Fig. 3a. Linearity graph for tazarotene y = 46961x - 2737.
R² = 0.9997
0 100000 200000 300000 400000 500000 600000
0 2.5 5 7.5 10 12.5
P
eak
A
re
a
798
Fig. 3b. Linearity graph for halobetasol
3.2.4 Precision
Repeatability (Intra-day precision) was established following analysis of samples (n=6) at the concentration of 1 μg/ml (halobetasol) and 4.5 μg/ml (tazarotene). The study was carried out over a short period in a single day. Reproducibility (Inter-day precision) was assessed at the same concentration on three distinct days. The relative standard deviation percentage was used to assess intra- and inter-day levels of precision. Data (Table 2) for intra- and inter-day precision studies suggest that the current method is precise.
TABLE2
REPEATABILITYANDREPRODUCIBILITYDATAFOR
HALOBETASOLANDTAZAROTENE
Sample No.
Tazarotene peak area
Halobetasol peak area Repeatability (Intra-day precision)
1 212039 118476
2 211985 118546
3 211758 118021
4
212236 118622
5
212575 118847
6 212326 118474
Average 212153 118498
RSD percentage 0.135 0.229
Reproducibility (Inter-day precision)
Day1 212153 118498
Day 2 211598 117456
Day 3 212374 117642
Average 212042 117865
RSD percentage 0.189 0.472
RSD – relative standard deviation; No. - number
3.2.5 Accuracy
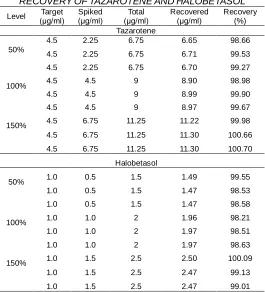
The accuracy of the current method was checked by analyzing lotion sample (halobetasol-1 μg/ml and tazarotene-4.5 μg/ml) spiked with halobetasol and tazarotene at 50, 100 and 150% levels of concentrations. The percent recovery values (Table 3) ranging from 98.66-100.70% for tazarotene and 98.21-100.09% for halobestol indicating that the current method is accurate.
TABLE3
RECOVERYOFTAZAROTENEANDHALOBETASOL
Level (μg/ml) Target Spiked (μg/ml) (μg/ml) Total Recovered (μg/ml) Recovery (%) Tazarotene
50%
4.5 2.25 6.75 6.65 98.66
4.5 2.25 6.75 6.71 99.53
4.5 2.25 6.75 6.70 99.27
100% 4.5 4.5 9 8.90 98.98
4.5 4.5 9 8.99 99.90
4.5 4.5 9 8.97 99.67
150% 4.5 6.75 11.25 11.22 99.98
4.5 6.75 11.25 11.30 100.66
4.5 6.75 11.25 11.30 100.70
Halobetasol
50% 1.0 0.5 1.5 1.49 99.55
1.0 0.5 1.5 1.47 98.53
1.0 0.5 1.5 1.47 98.58
100% 1.0 1.0 2 1.96 98.21
1.0 1.0 2 1.97 98.51
1.0 1.0 2 1.97 98.63
150% 1.0 1.5 2.5 2.50 100.09
1.0 1.5 2.5 2.47 99.13
1.0 1.5 2.5 2.47 99.01
3.2.6 Robustness
The composition of the mobile phase, pH and wavelength have been slightly changed to lower and upper sides of the optimized values to determine if there was any effect on halobetasol and tazarotene peak areas. The mobile phase composition was changed to 50:50 ratio from 40:60, pH was changed to 5.9 from 5.7 and wavelength was varied to 236 nm from 226 nm. Change in the peak areas of halobetasol and tazarotene were observed and percentage change values were calculated (Table 4). The percentage change values were less than 2.0% indicating that the current method is robust.
3.2.7 Ruggedness
Ruggedness was established following analysis of samples (n=3) at the concentration of 1 μg/ml (halobetasol) and 4.5 μg/ml (tazarotene) by two different analysts. The relative standard deviation percentage was used to assess ruggedness. Data (Table 5) for ruggedness studies suggest that the current method is rugged.
3.2.8 Specificity
Forced degradation tests for halobetasol and tazarotene lotion sample were performed in order to obtain an indication of the stability indicating potential and specificity of the current method. The amount of halobetasol and tazarotene remained following acid degradation was 90.82% and 91.82%, respectively and the resultant chromatogram (Fig. 4a) revealed the presence of four degradation peaks with retention times 1.121 min, 3.766 min, 5.516 min and 8.383 min that were well resolved from the peaks for halobetasol and tazarotene.
y = 12203x - 5527. R² = 0.9997
0 50000 100000 150000 200000 250000 300000 350000
0 0.5 1 1.5 2 2.5 3
P
eak
A
re
a
799
TABLE4
ROBUSTNESSDATAFORTAZAROTENEAND HALOBETASOL
Parameter Condition changed Tazarotene Halobetasol
Peak area % Change Peak area % Change
Standard No Change 212543 -- 118573 --
MP 1 Methanol:0.1 M potassium
phosphate buffer (50:50 v/v) 212025 0.24 117636 0.79
MP 2 Methanol:0.1 M potassium
phosphate buffer (40:50 v/v) 212234 0.16 118020 0.47
pH 1 5.9 211858 0.32 118878 0.26
pH 2 5.7 211693 0.40 118949 0.32
WL 1 226 nm 211017 0.72 117413 0.98
WL 2 236 nm 211357 0.57 117858 0.60
MP – mobile phase; WL - wavelength
TABLE5
RUGGEDNESSDATAFORHALOBETASOLAND
TAZAROTENE Sample
No.
Tazarotene peak area
Halobetasol peak area Analyst 1
1 212968 118974
2 212893 118843
3 213043 117636
Average 212968 118484
RSD percentage 0.035 0.622
Analyst 2
Day1 213414 117143
Day 2 212246 117952
Day 3 212515 118503
Average 212725 117866
RSD percentage 0.288 0.580
RSD – relative standard deviation; No. – number
The amount of halobetasol and tazarotene remained following degradation with alkali were 92.66% and 94.04%, respectively and the resultant chromatogram (Fig. 4b) revealed the occurrence of three extra peaks with retention times 2.400 min, 5.383 min and 6.683 min that were well resolved from the peaks for halobetasol and tazarotene.
Fig. 4a. Chromatogram of halobetasol and tazarotene lotion sample degraded with acid
Fig. 4b. Chromatogram of halobetasol and tazarotene lotion sample degraded with alkali
Halobetasol and tazarotene were oxidized with 3% peroxide. Approximately 94.89% of halobestol and 9.3.43% of tazarotene was recovered after oxidation with three degradants observed at retention times of 1.500 min, 6.333 min and 8.533 min in the chromatogram (Fig. 4c).
Fig. 4c. Chromatogram of halobetasol and tazarotene lotion sample degraded with peroxide
800 at 2.200 min, 3.716 min and 7.150 min (Fig. 4d). The
degradants are separated well from approximately 93.07% of halobetasol recovered and 91.73% of tazarotene recovered.
Fig. 4d. Chromatogram of halobetasol and tazarotene lotion sample degraded with dry heat
After exposure to UV light, 90.60% of tazarotene and 91.57% of halobestol was recovered and the chromatogram represented in Fig. 4e revealed the occurrence of four extra peaks with retention times 1.950 min, 3.250 min, 5.200 min and 8.516 min that were well resolved from the peaks for halobetasol and tazarotene.
.
Fig. 4e. Chromatogram of halobetasol and tazarotene lotion sample degraded with UV light
The current method was regarded as specific and stability indicating, because the additional peaks formed during forced degradation research didn't interfere with halobetasol and tazarotene peaks.
3.3 Method application to assay halobetasol and tazarotene in lotion formulation
The data from analysis of halobetasol and tazarotene in lotion formulation are summarized in Table 6. The quantity of halobetasol and tazarotene analyzed in the product was 4.44 μg/ml (tazarotene) and 0.98 μg/ml (halobetasol) equivalent to 98.65% (tazarotene) and 98.63% (halobetasol) of the label claim. The percent recovery determined lies within the assay specifications.
4 CONCLUSION
Stability indicating HPLC method developed in this study was used in the analysis of tazarotene and halobetasol simultaneously. Good separation of tazarotene and halobetasol with acceptable recovery and relative standard deviation has indicated high accuracy and precision of the method. The low values of limit of detection and limit of quantification demonstrates the high sensitivity in detection and quantification of tazarotene and halobetasol in bulk and lotion formulation samples. Satisfactory results were obtained when the method was adopted to analyze tazarotene and halobetasol in lotion formulation.
TABLE6
ASSAYHALOBETASOLANDTAZAROTENEINLOTIONFORMULATION
Drug Brand
Name
Label Claim (%)
Amount Prepared
(μg/ml)
Amount Found (μg/ml)
Assay (%)
Tazarotene Duobrii 0.045% 4.5µg/ml 4.44 98.65
Halobetasol 0.01% 1.0µg/ml 0.98 98.63
ACKNOWLEDGEMENTS
The authors are thankful to management, J.K.C College, Guntur, Andhra Pradesh, India for providing work space.
CONFLICTS OF INTEREST
None exists in the current study.
REFERENCES
[1] Tazoretene. Drug bank, accessed on November 2019. Available at: https://www.drugbank.ca/drugs/DB00799 [2] Tazoretene. Pubchem, U.S. National Library of Medicine,
accessed on November 2019. Available at: https://pubchem.ncbi.nlm.nih.gov/compound/Tazarotene
[3] G. Weindl, A. Roeder, M. Schäfer-Korting, M. Schaller and H.C. Korting, ―Receptor-selective retinoids for psoriasis: focus on tazarotene‖, Am. J. Clin. Dermatol, vol. 7, no. 2, pp. 85-97, 2006.
[4] S. Ogden, M. Samuel and C.E. Griffiths, ―A review of tazarotene in the treatment of photodamaged skin‖, Clin. Interv. Aging, vol. 3, no. 1, pp. 71–76, 2008.
[5] E. Tanghetti, M. Lebwohl and L.S. Gold, ―Tazarotene Revisited: Safety and efficacy in plaque psoriasis and its emerging role in treatment strategy‖, J. Drugs Dermatol, vol. 17, no. 12, pp. 1280-1287, 2018.
801 [7] G. Latter, J.E. Grice, Y. Mohammed, M.S. Roberts and
H.A.E. Benson, ―Targeted topical delivery of retinoids in the management of acne vulgaris: Current formulations and novel delivery systems‖, Pharmaceutics, vol. 11, no. 10, pp. pii: E490, 2019.
[8] Halobetasol Cream. StatPearls [Internet]. Treasure Island (FL), StatPearls Publishing, 2019. Accessed on November 2019. Available at:
https://www.ncbi.nlm.nih.gov/books/NBK544234/ [9] Halobestol. Pubchem, U.S. National Library of Medicine, accessed on November 2019.
Available at:
https://pubchem.ncbi.nlm.nih.gov/compound/Halobetasol [10] F.A. Kerdel, Z.D. Draelos, S.K. Tyring, T. Lin and R.
Pillai, ―A phase 2, multicenter, double-blind, randomized, vehicle-controlled clinical study to compare the safety and efficacy of a halobetasol propionate 0.01% lotion and halobetasol propionate 0.05% cream in the treatment of plaque psoriasis‖, J. Dermatolog. Treat, vol. 30, no. 4, pp. 333-339, 2019. [11] L.J. Green, F.A. Kerdel, F.E. Cook-Bolden, J. Bagel, T.
Lin, G. Martin, R. Pillai, R. Israel and T. Ramakrishna, ―Safety and Efficacy of a Once-Daily Halobetasol propionate 0.01% lotion in the treatment of moderate-to-severe plaque psoriasis: Results of two phase 3 randomized controlled trials‖, J. Drugs Dermatol, vol. 17, no. 10, pp. 1062-1069, 2018.
[12] Duobrii Approval History. Drugs.com, Accessed on
November 2019. Available at:
https://www.drugs.com/history/duobrii.html
[13] N.D. Bhatia, D.M. Pariser and L. Kircik, ―Safety and efficacy of a halobetasol 0.01%/tazarotene 0.045% fixed combination lotion in the treatment of moderate-to-severe plaque psoriasis: A comparison with halobetasol propionate 0.05% Cream‖, J. Clin. Aesthet. Dermatol, vol. 11, no. 11, pp. 15–19, 2018.
[14] M.G. Lebwohl, J.L. Sugarman, L.S. Gold, T. Lin and R. Israel, ―Efficacy, safety, and tolerability of a halobetasol 0.01% tazarotene 0.045% fixed combination in the treatment of severe localized plaque psoriasis: Post hoc analysis of two phase III randomized controlled trials‖, J. Drugs Dermatol, vol. 18, no. 10, pp. 1012-1018, 2019. [15] International conference on the harmonization. ICH
harmonized tripartite guideline. Stability testing of new drug substances and products Q1A (R2), Geneva, Switzerland, 2003.
[16] International conference on the harmonization. ICH harmonized tripartite guideline. Validation of analytical procedures: Text and methodology Q2 (R1), Geneva, Switzerland, 2005.
[17] FDA, Reviewer Guidance: Validation of chromatographic methods, United States Food and Drug Administration, Silver Spring, MD, USA, August 2018, https://www.fda.gov/downloads/drugs/guidances/ucm13 4409.pdf.