The performance analysis of optically transparent materials used in tunable devices Mohamed Koroma
School of Electronic Engineering and Computer Science Queen Mary University of London
4ES East London
Email address: [email protected]/[email protected] +8613247142283
Abstract
Comparative analyses, as well as the performance of optically transparent materials such as glass, Mylar, quartz, PET and PEN, were presented. Different methods of measuring techniques have been used to determine the dielectric property of the optically transparent materials at low and high frequencies. Due to the unavailability of materials, time and test equipment in the antenna laboratory, three (3) methods were implemented in this research. Namely, split cylinder cavity resonator, quasi-optical mm-wave measurement technique and the matching technique, where simulated return loss matched with the measured value of a simple micro-strip patch antenna.
An Electromagnetic (EM) modelling tool (i.e. Computer Simulation Technology, (CST) Studio suite) that takes into consideration finite integration techniques to execute computational analysis (i.e. Simulations) had been used in the matching technique to extract the physical properties of the material under test, by comparing measured and computational data. A frequency range of 8GHz-10GHz was used in the split resonant cavity measuring Glass, PET, and PEN at low frequencies. This method did not give accurate readings on glass simply because its measurement for accuracy was limited to low dielectric loss materials. Therefore, a glass material with high loss property at low and high frequencies could not be a good candidate for a split cylinder resonant cavity method regardless of its size and thickness. As shown in table 3.1, the loss tangent of glass (1.11mm) was noticed to be the same as the low-loss values of PEN and PET materials with 55µm, 0.131mm (i.e. 0.00622, 0.00608, and 0.00358). However, Quasi-optic millimetre measurement bench was able to depict the real loss properties of glass at low and high frequencies. The frequency ranges of 75GHz-110GHz and 220GHz-325GHz were used in this method. The results from this reading showed that glass is a material with very high loss at low and high frequencies. Mylar, on the other hand, is the optically transparent material with the lowest loss property. However, due to its complexity in fabrication and measurement at high frequency, the Matching Technique was, therefore, more preferable. The Matching Technique was observed to be more efficient and reliable.
Keywords: Polyethylene naphtha late (PEN), Polyethylene Terephthalate (PET),
Photosensitive organic semiconductor poly-(3-hexylthiophene), Mylar, Glass
1. Introduction
Optically transparent materials have played an important role in wireless
communication due to their numerous applications (E.R. Escober et al., 2015). One of its
applications is when using as a substrate in the design of antennas and printed on screens
and building glazing (A. Martin et al., 2015). These materials are also used in medical
diagnostic equipment. Optically transparent materials serve as a “reinforcement material
in surfboards and wind turbines (Adam Willsey, 2005).
Research on optically transparent materials has been done in the literature and A.
martinet al (2015) depicts the fact that optically transparent antennas are being printed
on the “surfaces of cars” as well as “building glazing”. The fabrication of these antennas
is being done on very “thin films” of optically transparent materials. Indium tin oxide
(I.T.O) that is part of the transparent conducting oxide (T.C.O) family was found to be “the
most usual type”.
“The performance of an optically transparent antenna that operates from
8.8GHz-9.8GHz” was also analysed by A. Martin et al (2015) and according to their research, this
antenna comprises of “mesh silver film that is printed onto a glass substrate” in which
very high level of transparency was achieved. Similarly, Tang et al (2007) using organic
semiconductor poly (3-hexylthiophene) have designed an optically controlled phase
shifter. This organic semiconductor was being considered as a tunable dielectric in the
phase-shifter structure. Under optical illumination, P3TH changes the real part of the
permittivity of the material. Similarly, A. S Andy et al designed a two-patch antenna array
using soda-lime glass as the primary substrate and indium-tin-oxide (ITO) as the ground
plane. In the design, organic semiconductor heterojunction P3TH: PCBM is considered as
the secondary substrate and drop-cast onto the glass. (A.S. Andy et al) None of these
authors has considered the high loss that these optically transparent materials possess at
low and high frequencies.
As a result, in this research, different measuring techniques such as Split cylinder cavity
resonator, quasi-optical mm-wave measurement, and the matching technique is used to
determine amongst the optically transparent materials the most suitable one with
technique accurately outputs the lossy behaviour of glass. This research also intends to
figure out amongst the listed down measuring techniques, the most appropriate one to
use at low and high- frequency domains.
2. Literature review
Techniques such as Quasi-optic bench (mm-wave frequencies), Transmission line/Matching
technique using a simple micro-strip patch antenna, split cylinder cavity resonator,
Electromagnetic Material Characterization Chamber (EMMCC), parallel plate capacitor,
Coaxial line technique and so on, have been developed and use these days by different
researchers to characterized the dielectric properties of materials.
M.S. Kheir et al (2008) developed a measuring technique such as ring resonator, together with
a “rectangular waveguide cavity”. This technique is used to determine the dielectric constant
of liquids with the help of resonance frequency. In a similar way, H. Fang et al. (2004) use a
ring resonator together with special software that is used in antenna engineering called
“Ansoff HFSS electromagnetic simulation software”. Then, this combination is used to
determination of the dielectric constant of a material.
Furthermore, A. Kumar, S. Sharma and G. Singh (2007) initiated a new technique called
“rectangular shaped perturb cavity”. This technique is used to put homogenous dielectric
materials into different categories. The placement of the sample is put in “cylindrical form”
at the cavity centre point. This group to determine both real and imaginary parts of the
relative permittivity of the material used the pattern known as “shift in the resonance
frequency”. C.Y. Tan et al (2004) also did the development of a micro-strip dual resonator
system in order to put the material’s permittivity into different categories. The system is
divided into two halves of wavelength resonator and ferroelectric thin films, which were used
to cover the gap between these two resonators. This design was inconsistency at some point
during measurements. The inconsistency behaviour of this design was caused by the gap
between the resonators and ferroelectric films.
Using quality factor and resonant frequency measurements, the dielectric constant of
Victor F.M.B. Melo et al (2009) initiated a newly proposed configuration technique. This was
done to configure the ring resonator in such a way that it would be used to accurately
determine the dielectric permittivity of printed circuit boards (PCBs) that will operate at high
frequencies. Andrew. R. Fulford et al (2005) did the development of a pair of micro-strip Tee
resonator. This system was having “different impedance resonating elements”. The said
designed system is used for removing conductor-sheet resistance as well as the dielectric
properties of materials.
Sushanta Sen, et al (1997) presented a technique that was only suitable for the dielectric
property of a material with a low-loss property called cavity perturbation. This technique uses
a modified cylindrical re-entrant cavity for the purpose of microwave characterization of
dielectric constant. Elenea Semouhkina et al (2001) simulated the scattering parameters of a
ring resonator with the help of a finite-difference-time-domain (FDTD) method. The dielectric
constants of alumina and rutile substrates were determined.
Barbar Dziurdzia, Jerzy Krupka and Wojciech Gregorczyk presented the split-post resonator
method as the most appropriate method to use especially for low-loss materials. They used
this method to determine the relative permittivity, as well as the loss tangent of the alumina
substrate and got a good result as expected. They also implement software in order to
fabricate microwave double-layered circuits (Barbar Dziurdzia et al, 2004). An analogue
technique system that allows the measurement to be done in the time-domain was
developed by William.B. Weir. With this measurement approach, the relative permittivity and
permeability of a material can only be determined through Fourier transformation (William.
B. Weir, 1974) A LabVIEW software was developed by Renѐ Grignon et al. (2003) and the
analysis of complex dielectric permittivity of low loss solids has been done using this software.
Multiple reflections have an adverse effect on the performance of the system. They, therefore
use the free-space method to correct reflection errors (Renѐ Grignon et al, 2003).
3. Methodology and Model
During the research process, various data and information relevant to the research obtain through the following:
Supervisor Interaction for more professional guidance base on the concept of the research.
Math Lab and CST microwave suites were the two simulating programs use in this research.
3.1.Permittivity of dielectric material
Material interaction with the electric field can be the permittivity of the material
denoted as ԑ. This can also know as the dielectric constant of a material denoted as K.
Given that ԑr or ԑ are relative permittivity and (ԑo) the permittivity of free space. Taking
into consideration that ԑr1 is the real part and ԑr2 is the imaginary part of the
permittivity. i.e. ԑr or ԑ = ԑr1-jԑr2
The measurement of how lossy a material is in the presence of external forces such as
electric field is known as the loss tangent denoted by
tanẟ=ԑr2/ԑr1 (Tereshchenko, O.V et al, 2011),
3.2 Theory of complex permittivity
The complex dielectric permittivity of material can simply be extracted using the following
equation; S21= T (1-ᴦ2)/ (1-ᴦ2) T2………. (1)
Where T=transmission coefficient, ᴦ= reflection The equations that determine the respective values of reflection and transmission coefficient are as follows; ᴦ=Zsm-1/Zsn +1………. (2)
T’=e-γd………. (3)
Where Zsn in equation two represent the sample impedance and d represent the sample thickness. Therefore, the sample impedance can be determined using the following equations; Zsn= 1/√Ԑ*………. (4)
γ= Ko/√Ԑ*………. (5)
Ԑ*= Ԑr1-j Ԑr2………. (6)
(Renѐ Grignon et al, 2003)
3.3 Methods used to measure the dielectric property of materials
Since the dielectric of a material is subject to changes that can be either physical or
chemical, its measurement has really gained important in the industry these days. This is
because under certain circumstances, used for non-destructive monitoring of certain
material properties. Measurement of the dielectric properties of any material using
several methods is possible depending on the type of material targeted and the frequency
range chosen. Again, any dielectric material would be measured provided the required
measuring equipment and sample holder will solely depend on the sample material.
It is very true that dielectric material is subject to changes but the following factors are
considered, whenever their measurement and characterization from one category to the
other is done. They are frequency, required accuracy, temperature, sample size/thickness,
cost, contacting/non-contacting and destructive/non-destructive (M.T. Khan, 2012). In
this research, even though there are different methods used to measure the dielectric
properties of a material, only three methods implemented. Namely; split cavity Resonator
method, matching techniques using standard micro-strip patch antenna, and Quasi-optic
mm measurement bench.
3.3.1. Split cylinder Cavity Resonant Method
As shown in figure one below, the operation of the split cavity resonant method is very
simple to implement and it is based on the fact that turning the cavity makes a shift in
resonant frequency and this is caused by putting a material that is very lossy at the centre
of the device. It is design to either intransverse electric mode (TE) or in transverse
magnetic mode (TM). Due to the simplicity of this method, it supports higher temperature
and normally gives out accurate results especially for a dielectric material with very low
loss and low loss factor like Mylar. A waveguide of any type (i.e. Circular or Rectangular)
even though doing that will bring some changes to the centre resonant frequency as well
as the quality factor of the cavity. The values shown on the changes it made to each
material are used to calculate the dielectric constant of the said material. The quality
factor in this context is the ratio of energy to energy dissipated. The complex permittivity
and permeability of each sample material is calculated. The frequency range that is used
in this method can be from 50 MHz-100 GHz but can be extended up to1 THz and it takes
a measurement of dielectric material both at low and high temperatures say like 140C to
-20C. (M.T. Khan et al, 2012) (R= reflected power, T=transmitted power)(M. S. Venkatesh,
2005)
Fig.3.3.1 shows a schematic of a resonant cavity method
3.3.2
Quasi-optical mm-wave measurement benchThe vector network analyser (VNA) also known as a signal generator connected to
Quasi-optic mm-wave measurement bench whenever an experiment is performed. Even though
too sophisticated by design, it can give out an output that will detect both phase and
amplitude of radiation that has frequencies up to 325GHz. Presently it has the ability to
using different types quasi-optic bench elements. One of these elements can be
corrugated horns, flat reflectors, grid polarizers and focusing reflectors. As shown in figure
two, the quasi-optic bench and for any test to be carried out through this bench, it must
have the following elements; pairs of horns label as H, pairs of quasi-optical directional
couplers label as C, pairs of ellipsoidal reflectors label as F, pairs of polarization grids label
as G and Vector Network Analyser Extenders (VNA_E). The purpose of the horns is to do
transmission and reception of transmitted signals. That is, one can transmit signal while
the other receive the transmitted signals. The mm- wave extender is serving there as
frequency multiplier and work together with the horns to transmit signals. Figure 3.3.2
given below shows how horns work with certain amount centre frequency and connected
to the vector network extenders. The ellipsoidal reflectors collimate through signal beams
and in order to get rid of the horizontal polarisation beams, the vertical polarisationis
applied which in turn gives out a pure vertical polarisation. Whenever a sample material
is placed at the beam width, the blue dotted lines with the arrows show the actual path
Fig. 3.3.2. Shows mm-wave transmission measurement bench (Hansheng SU, 2011)
3.3.3
Matching TechniqueTable 2.3 shows results got from using the Split cylinder cavity resonator. Amongst the
optically transparent materials (i.e. glass, Mylar, Quartz, PEN, and PET) measured, glass is one
of the material with very high loss property at low and high frequencies. Table 2.3 shows the
various loss tangent (i.e. Tanẟ=ԑr2/ԑr1) and from the listed down optically transparent
materials, the loss tangent of the glass material is low which gives the opposite loss property
possessed by glass material at low and high frequencies. This is due to the loss measurements
limit of the Split cylinder cavity resonator. This type of measuring techniques only gives out
accurate values for low-loss optically transparent materials and glass material is not found in
that category. Therefore, matching technique is use in this research solely for this scientific
reason.
A. Andy et al had also used this method in the case of estimating approximately the value of
conductivity as well as the plasma’s layer depth for the active state. It was by matching the
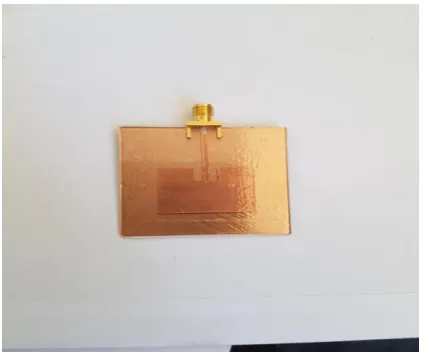
data of the measured active state to that of simulation. In this research, a simple micro-strip
serves in the capacity of these two layers and use for both path and ground. The third layer,
placed in the middle of the model, is a soda-lime glass that serves in the capacity of substrates.
Figure 3.3.3 shows the picture of the model.
Figure 3.3.3 Simple micro-strip patch antenna
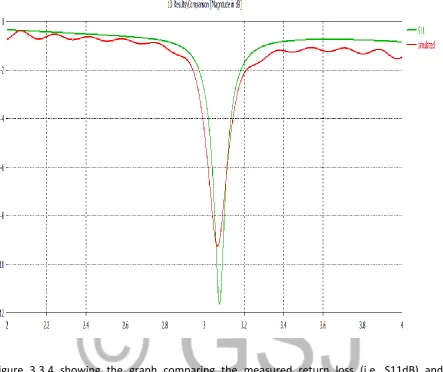
The modelled micro-strip patch antenna would have a return loss of S11 (dB) as measured
value. The structure is then fabricated using a vector network analyser (VNA) which also have
return loss of S11 (dB) as simulated value. Thereafter, the two return loss values (i.e. S11 (dB)
Figure 3.3.4 showing the graph comparing the measured return loss (i.e. S11dB) and
simulated (i.e. S11dB).
The main purpose of doing this technique is to determine the real part and imaginary part of
the dielectric property of glass material that will lead to getting the loss tangent of material.
This is achieving by running a parametric scanning in CST studio suites as shown in table 2.1.
Table 3.3.4 shows the real part and loss tangent of glass
No Real part (ԑr1) Loss tangent(tanẟ)
1 5.6 0.1
3 5.8 0.3
4 5.9 0.4
5 6.0 0.5
This is also depicted in figure 3.3.4 and from that figure, the following values are found for
the dielectric property of glass material; real part (ԑr1) as 5.85, imaginary part (ԑr2) as
0.014625 and Loss tangent (tanẟ) of 0.025. Since the focus of this research is to lose the loss
tangent value, therefore, depicts the actual loss property of glass material at low and high
frequencies. This made the matching technique the most appropriate method since it gives
out values that are more precise during measurement.
3.3.5 Comparison of different dielectric measuring techniques
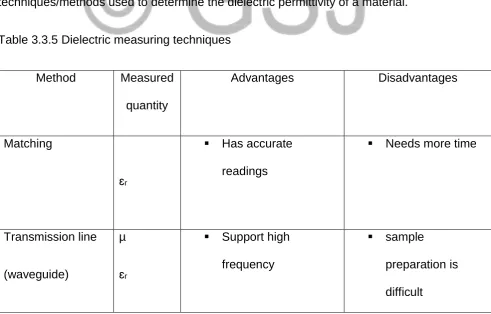
Table 3.3.5 below shows the advantages and disadvantages of some measuring techniques/methods used to determine the dielectric permittivity of a material.
Table 3.3.5 Dielectric measuring techniques
Method Measured
quantity
Advantages Disadvantages
Matching
ɛr
Has accurate readings
Needs more time
Transmission line
(waveguide)
µ
ɛr
Support high frequency
Allows both solids & liquids
Resonant cavity µ
ɛr
Design for low-loss materials
support both solids & liquids
measurement is done at single frequency
Parallel plate
ɛr
Design for high loss materials
Simple to perform
Electrode
polarization effect
Free space µ
ɛr
useful for high temperature support wide
frequency
Diffraction problem from material edges
Coaxial probe
ɛr
provide high accuracy for high materials use broadband
frequency
Air gaps causes errors Quasi-optic mm-wave measurement bench ɛr
Design for both low and high frequencies
Very complex
4. characterizations of optically transparent materials at microwave frequencies
There has been a great interest to researcher to do research on how to measure the dielectric
properties of a material in recent years. This is due to the vast means of microwave
frequencies applications in the communication/electronic industry. They are applied in most
mobile communication systems such as mobile phone, Bluetooth devices, search radars and
so on (Adam and Chris). Several papers have been reviewed base on the characterization of
optically transparent materials at microwave frequencies (L.F Chen et al, 2004). The
application of low-loss materials is done on microwave devices and circuits, communication
devices, and antenna windows. Therefore, in antenna windows as well as high power
microwave devices, characterising the dielectric properties of a material in terms of
temperature variations should be timely done before using the device (E.Li et al, 2009).
In order to determine the loss-factor of a material, the determination of the dielectric
constant is first considered. Different measuring techniques have been developed and use to
calculate this constant. The reflection coefficient or resonant frequencies of each measuring
techniques used is solely dependent on the type of measurement level (A. Kumar and S.
Sharma, 2007). Therefore, in this research, a split cylinder resonant cavity measuring
techniques at microwave frequencies has been used. This device has a low-loss factor
measurement limit and it measures the complex permittivity of a material at room
temperature. Moreover, the split cylinder resonates cavity system is divided into two halves
and the sample material is always placed at the centre of the cavity. Therefore, there is any
support to protect the sample material from dislocation during measurements (E.Li et al,
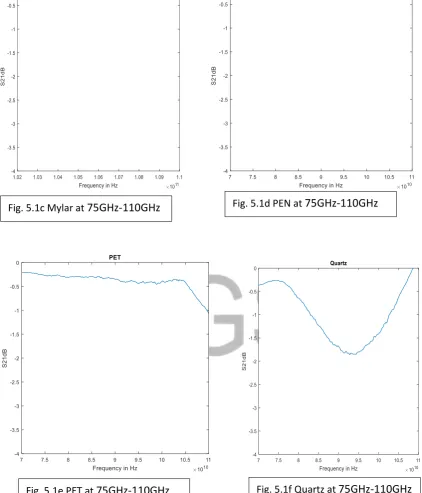
4.1 Measurement setup for split cylinder cavity resonator
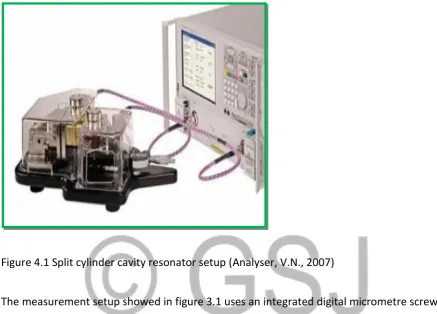
The measurement setup of a Split cylinder cavity resonator is shown in figure 4.1 below.
Figure 4.1 Split cylinder cavity resonator setup (Analyser, V.N., 2007)
The measurement setup showed in figure 3.1 uses an integrated digital micrometre screw to
measure the thickness of the samples. The side mounting of the cylinders allows the
measurement of large samples.
The cavity connected to the vector network analyser. It uses two ports namely port1 (S11) as
well as port2 (S21) which will measure the scattering parameters (S-parameters). The work of
port1 is to measure the reflected signals as well as the transmitted one coming from port2.
The same process is done with port2.
This setup has a single resonant frequency in air and the sample of the dielectric material
placed between the moving and fixed cavity. The system is calibrated for every set of
measurement. In this research, Mylar material with 10-micrometer thickness was too thin to
be measured using this method and the same reason goes for quartz material (very small).
4.2 Results and Discussion
Table 4.1 Relative permittivity (ԑr) and tanδ of glass, PET & PEN.
no Material
name
Thickness=t real part ԑr1
imaginary part ԑr2
tanδ=loss tangent
frequency Method
used
Glass
1 1.122mm 5.63513 0.03504 0.00622 8.74GHZ Split
cylinder Cavity Resonator
2 1.103mm 5.28203 0.01020 0.00193 8.86GHZ Split
cylinder Cavity Resonator
3 1.102mm 5.28660 0.01019 0.000193 8.86GHZ Split
cylinder Cavity Resonator PET
1 0.131mm 3.19566 0.01944 0.00608 9.98GHZ Split
cylinder Cavity Resonator
2 0.147mm 2.94129 0.01718 0.00584 9.98GHZ Split
cylinder Cavity Resonator
3 0.142mm 3.03397 0.01825 0.00602 9.98GHZ Split
cylinder Cavity Resonator
PEN
Cavity Resonator
2 48 µm 3.26276 0.01189 0.00364 10GHZ Split
cylinder Cavity Resonator
3 56 µm 3.20901 0.01190 0.00371 10GHZ Split
cylinder Cavity Resonator
Table 4.1 outline the results of the three optically transparent materials. The loss tangent
values of PET and PEN materials show well. Considering the size and thickness of these three
materials, glass has the highest value. Similarly, even though glass is with such value, they
almost have the same loss tangent values. In a scientific point of view, the Split cylinder cavity
resonator does not give out accurate measurement values on materials with high loss
property such as glass. It is designed for low-loss material measurement. The matching
technique is therefore used in this research in order to get the actual loss tangent value that
will depict the scientific behaviour of glass at low and high frequencies.
4.3 The mm-wave Measurement of the physical properties of materials at W-band
frequency.
Different materials have different application areas depending on the understanding of the
dielectric properties such as loss factor and complex permittivity. Several Researched and
methods done on these materials (A. Elhwil et al, 2007).
In this research, 75GHz-110GHz frequency range was use in the first measurement and
220GHz-325GHz in the second measurement. Both of them were measuring glass, Mylar,
Quartz, PET and PEN using the Quasi-optical mm-wave bench. Diagrams below shows the
setup of this measurement, use to determine the real part, imaginary part and loss tangent
of the five optically transparent materials with a bandwidth frequency of 300Hz. The horn
reception of signals. Similarly, the millimetre wave extenders are frequency multipliers that
work together with the antennas in the transmission and reception of signals.
4.4 Sample Preparation
The sample of each material was placed on top of a sample holder where the sample is
rectangular aluminium metal with a central circular cut-out of 1.7cm diameter. The sample
holder is aligning on the quasi-optic bench in order to avoid the reflection of signals. The
system is normalised before taken any measurement shown below. The sample holders with
samples of optically transparent materials mounted on them.
PET Material PEN Material
4.5 Measurement setup for Quasi-optical mm-wave measurement bench
The Quasi-optic mm-wave bench is connected to the vector network analyser and the VNA
measures the S-parameters (Scattering Parameters) of S11 (dB) and S21 (dB). The Vanier
calliper is used to measure the sample thickness.
In this research, two different measurements presented using different frequencies levels.
The first frequency measurement is from 75GHz-110GHz and the second frequency
measurement from 220GHz-325GHz. The setup on how these were done in the antenna
laboratory is shown in diagrams below respectively. Figure 4.3 shows the alignment of the
sample holder on the Quasi-optic bench.
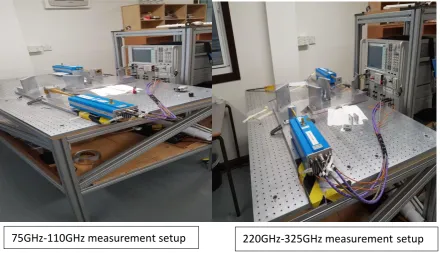
5. Results and Discussion
The result fairly reflects on the loss behaviour of each material and a brighter example of it is
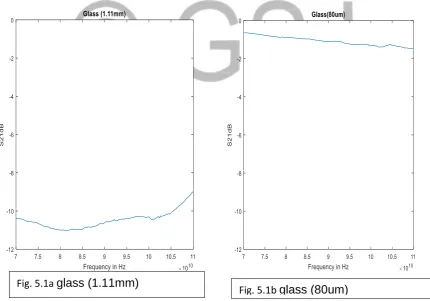
glass. For 75GHz-110GHz measurements, looking at figure 5.1a and figure 5.1b, glass has very
high loss property at low and high frequencies regardless of its size and thickness. Mylar has
better low-loss property than all the other materials mentioned in this research as shown in
figure 5.1c.
PEN, on the other hand, is second with low-loss property to Mylar and much better than PET
and Quartz as shown in figure 5.1d. Similarly, looking at figure 5.1e, PET is much better than
Quartz.
Furthermore, in the 220GHz to 325GHz measurement, the high loss behaviour of glass is still
the same as shown in figure 5.1f and figure 5.1g, Mylar, in the same way, has almost 0dB loss
where PEN was observed to be better than PET and Quartz. Looking at figure 5.1h and figure
5.1l, PET has better loss property than Quartz but Quartz, in turn, was observed to be better
than glass.
In summary, the first and second Quasi-optic mm-wave measurement bench have shown it
clearly that glass has the highest loss property and Mylar, on the other hand, contains the
lowest loss property at low and high frequencies. Hence, the goal of this research.
5.1 75GHz-110GHz measurements of optically transparent materials
Fig. 5.1a glass (1.11mm)
Fig. 5.1c Mylar at 75GHz-110GHz Fig. 5.1d PEN at 75GHz-110GHz
5.2 220GHz-325GHz measurements of optically transparent materials
Fig. 5.2g glass (1.11mm) Fig. 5.2h glass (80um)
6. Summary and conclusion, and future work
This research presents three different measuring techniques used to determine the dielectric
property and loss tangent of materials. Amongst these techniques, Quasi-optical mm-wave
bench and the matching technique measure these materials at low and high frequencies.
Matching technique provides precise loss tangent value of glass that depicts glass high loss
property at low and high frequencies. Split cylinder cavity method, on the other hand, uses
single frequency and is only suitable for low-loss materials. Two different frequency
measurements are performing in Quasi-optical mm-wave measurement bench and Mylar was
found to be the optically transparent material with the low-loss property. In addition, glass
regardless of size and thickness was proved as the optically transparent material with the
highest loss property at low and high frequencies.
Lastly, even though all these techniques have advantages and disadvantages, for this
research, matching technique is more appropriate to measure a material with high loss
property.
6.1 Result from simulation
The simulation using CST studio a suite of a modelled patch antenna (i.e. S11dB) is compared
to the return loss (i.e. S11dB) measured value as shown in figure 3.3.4. This process gives out
a precise loss tangent value (i.e. 0.025) and relative permittivity of 5.85 for glass which is the
actual behaviour of glass at low and high frequencies. In addition, the simulation did using
Math Lab from the two different frequency measurements in the Quasi-optical mm-wave
bench shows that Mylar is the optically transparent material with lowest loss property and
glass with the highest loss property.
6.2. Result from measurement
Table 4.1 shows measurement results from Split cylinder cavity resonator and from the
scientific point of view, it shows that such technique cannot give accurate readings on
optically transparent materials with high loss property such as glass. Looking at table 4.1, glass
has the same loss tangent value with PET and PEN.
6.3. Future work
Performance and analysis of optically transparent materials using simulation/measurement
were carried out in this project. The identification of material with the lowest loss tangent
and highest loss tangent was achieved. There is still room for improvement for these optically
transparent materials to perform well when applied as a substrate in communication systems.
The reduction of the high loss property possessed by these materials such as glass at low and
high frequencies is still an issue. Therefore, doubling these optically transparent materials as
Reference
1. Escobar, E.R., Kirsch, N.J., Kontopidis, G. and Turner, B., (2005). 5.5GHz optically
transparent mesh wire micro-strip patch antenna. Electronic Letters, 51(16),
pp.1220-1222.http://ieeexplore.ieee.org/
http://www.library.qmul.ac.uk/subject/eecs/databases
2. Martin, A., et al. (2015). Optically transparent frequency-agile antenna for X-band
applications. Electronic Letters, 51(16), PP.1231-1233. .http://ieeexplore.ieee.org
3. Adam Willsey, (2015). “Three common glasses types: properties and applications”.
http://www.koppglasss.com/blog/3-common-glass-types-properties-applications
4. Yang, B., et al. (2008). Quasi-optical measurements of magnetic materials at
frequencies up to 630GHz. 33rd International conference on Infrared, Millimetre and
Terahertz waves.
http://ieeexplore.ieee.org/stamp/stamp.jsp?tp=&arnumber=4665774
5. Education department of Virginia, (2012). Science enhanced scope and sequence.
http://www.doe.virginia.gov/testing/sol/standards_docs/science/2010/lesson_plans
/grade5/force_motion_e,
6. Kheir, M.S., et al. (2008). Measurement of the dielectric constant of liquids using a
hybrid cavity-ring resonator. In PIERS Proceedings, (PP.566-569).
http://onlinelibrary.wiley.com/doi/10.1002/mop.20031/abstract
7. Fang, X., et al. (2004). Dielectric constant characterization using a numerical method
for the micro-strip ring resonator. Microwave and optical Letters, 41(1), PP.14-17.
8. Kumar, A., et al. (2007). Measurement of dielectric constant and loss factor of the
dielectric material at microwave frequencies. Progress in Electromagnetics Research,
69, PP.47-54. http://onlinelibrary.wiley.com/doi/10.1002/mop.20031/abstract
9. Tan, C.Y., et al. (2004). Non-destructive microwave permittivity characterization of
the ferroelectric thin film using micro-strip dual resonator. Review of scientific
instruments, 75(1), pp.136-140.
http://scitation.aip.org/content/aip/journal/rsi/75/1/10.1063/1.1632999
10.Melo, V.F., et al. (2009). The new configuration of measure PCB electric permittivity
using de ring resonator. In XIX IMEKO World Congress on Fundamental and Applied
Metrology. http://edt.auburn.edu/handle/10415/768
11.Fulford, A., (2005). Conductor and dielectric property extraction using micro-strip
Tee resonators, (Doctoral Dissertation).
http://scitation.aip.org/content/aip/journal/rsi/75/1/10.1063/1.1632999
12.Sen, S., et al. (1979). New cavity perturbation technique for microwave
measurement of dielectric constant. Review of scientific Instruments, 50(12),
pp.1594-1597.
http://scitation.aip.org/content/aip/journal/rsi/75/1/10.1063/1.1135772
13.Semouhkina, E., et al. (2001). Combining FDTD simulations with measurements of
micro-strip ring resonator for characterization of low and High-K dielectric at
microwaves. Microwave and optical Technology Letters, 29(1), pp.21-24.
http://onlinelibrary.wiley.com/doi/10.1002/mop.1071/abstract
14.Dziurdzia, B., et al. (2004). Measurements of relative permittivity and dielectric loss
Characterization of dielectric substrates.
https://www.imaps.org/adv_micro/papers/AM2005_Dziurdzia.pdf
15.Khan, M.T., and Ali, S.M., (2012). A brief review of measuring techniques for
characterization of dielectric properties of materials. International journal of
information technology and electrical engineering, 1(1).
http;//www.iteejournal.org/archive/vol1no1/v1n11.pdf
16.Tereshchenko, O.V., et al. (2011). An overview of the techniques for characterization
of dielectric properties of materials. In Proceedings of the General Assembly and
Scientific Symposium, Istanbul, Turquia (Vol.1320, p.14).
http://www.ursi.org/proceedings/procga11/ursi/A04-1.pdf
17.Hansheng SU, (2011). Development of tunable high frequency -frequency selective
surfaces, Queen Mary, university of London.
http://www.library.qmul.ac.uk/subject/eecs/databases
18.Elhwil, A., et al. (2007). A Quasi-optical free-space method foe dielectric constant
characterization of polymer materials in the mm-wave band. In Proc. Symp.
IEEE/LEOS Benelux (Vol. 66, pp.187-190).
http://bbs.hwrf.com.cn/downebd/88815d1365053458-quasi-optic.pdf.
19.Li, E., et al. (2009). Broadband measurements of dielectric properties of low-loss
materials at high temperatures using circular cavity method. Progress in
Electromagnetics Research, 92, pp.103-120.
http://www.jpier.org/PIER/pier92/08.09030904.pdf
20.Grignon, R., Afsar, et al. (2003). Microwave broadband free-space complex dielectric
Technology Conference, 2003. IMTC’03. Proceedings of the 20th IEEE (Vol.1,
pp.865-870). IEEE. http://ieeexplore.ieee.org
21.Weir, W.B., (1974). Automatic measurement of complex dielectric constant and
permeability at microwave frequencies. Proceedings of the IEEE, 62(1), pp.33-36.
http://ieeexplore.ieee.org
22. Analyser, V.N., (2007). Operation Manual. Dimension,331 (381mm),
p.42mm..http://cal.equipment/doc/Anritsu
23.Chen, L.F., et al. (2004). Microwave electronics: measurement and materials
characterization. John Wiley & sons. https://books.google.co.uk/book?
24.Jones, J.V., (1995). Neutral grey-green low transmittance heat absorbing glass. U.S.
patient 5,411,922. http://www..goggle.com/patients/US6529844
25.Kapetanic, P., et al. (2003). Anritsu company, 2003. Vector network measurement
system. U.S. patient 6,529,844. http://www..goggle.com/patients/US6529844
26.Tang, H., (2007). An optically controlled phase shifter employing the organic
semiconductor poly (3-hexylthiophene). Applied physics Letters, 91(20), p.202101.
http://scitation.aip.org
27.Antenna & Electromagnetics Research Group. http://antennas.eecs.qmul.ac.uk
28.Venkatesh, M.S. and Raghavan, G.S.V., (2005). An overview of dielectric properties
measuring techniques. Canadian biosystems engineering, 47(7), pp.15-30.
http://www.researchgate.net/profile/vijaya
29.Andy, A.S., et al. S-band antenna Array Control Via Integrated optically –Activated
organic semiconductor, school of Electronic Engineering and Computer Science,
30.Andy, A.S., et al. (2015). Optically-tunable organic semiconductor heterojunction
P3TH-PCBM for millimetre-wave applications. In 2015 40th International conference
on Infrared, Millimetre, and Terahertz waves (IRMMW-THz) (pp.1-2). IEEE.