©2014 Scienceweb Publishing
Identification of the best management options for the
rice quality processing centers: Case of Cameroon
Dorothy Malaa Kenyi
1•
Beye Amadou
2*•
Cromme Nicolaus
31
Institute of Agricultural Research for Development (IRAD), Yaoundé, Cameroon.
2
Africa Rice Center, Cotonou, Benin.
3
Common Fund for Commodities (CFC), Amsterdam, Netherlands.
*Corresponding author: E-mail: [email protected],[email protected]
Accepted 7th November, 2013
Abstract. A study was conducted in 2011 immediately after the installment of quality processing centers in Cameroon, Chad and Central African Republic where the CFC implemented a pilot project on rice productivity and quality enhancement. Its objective was to identify most profitable and sustainable options for the organizational and management structure for the centers to convince micro-financial institutions, local traders and processors to invest in the centers and work in coalition with shareholder smallholder farmers. The study concluded by identifying the „Purchase, Process and Sell Option‟ with a combined management committee of 2 farmers and 3 traders/millers as most suitable.The study provided quantified instruments and the level of economic profitability of each section of the centers to the private operators (including farmers). It also revealed the need to develop secondary rice processing1 as a tangible source of revenue which commonly remains underutilized in sub-Saharan Africa.
Keywords: quality processing centers, secondary processing, farmers, profitability, rice.
INTRODUCTION
The notion of ensuring food for all through rice production1 in Cameroon dates back to 1954 with the creation of SEMRY (Société d‟Expansion et de Modernisation de la Riziculture de Yagoua). To date, Yagoua is the biggest state owned rice producing cooperative in the northern part of the country. Two additional cooperatives were later created in the 1970s which significantly contributed to a national equilibrium of rice production and consumption that was reached in mid-1985 (Phelimas, 1990). However, subsequent reforms as part of a structural adjustment program with the overall concept of not subsidizing the agricultural sector, led to the collapse of these state cooperatives in
1
Secondary rice processing is transforming hulled rice (broken or whole into another products such as pop rice, rice flour for pastries and others
1992 (Norman and Otoo, 2003; Lostmart and Mbah, 2007; Malaa and Nzodjo, 2010). Consequently, rice production in Cameroon was left at the mercy of untrained farmers with limited or no access to input and technology. While annual per capita rice consumption increased from 12.4 kg per capita in the late 1990s to 23.0 kg per capita in 2007, production dropped from above 65,000 tons to less than 50,000 tons in the same period (FAOSTAT, 2006). To make up for the increasing production gap, in some years Cameroon imports more than 80% of its demand (FAO, 2006; Piebiep. 2008). As a reaction to globally rising rice prices which peaked in 2008, and led to riots in Cameroon („The Rice Crisis‟), the Government decided to re-visit the smallhoder farmer dominated rice production sector. With financial and technical assistances from the Common Fund for Commodities (CFC) and Africa Rice Center, a four year rice value chain project on “Improving the competitiveness of Journal of Agricultural and Crop Research
Vol. 2(2), pp. 22-31, February 2014 ISSN: 2384-731X
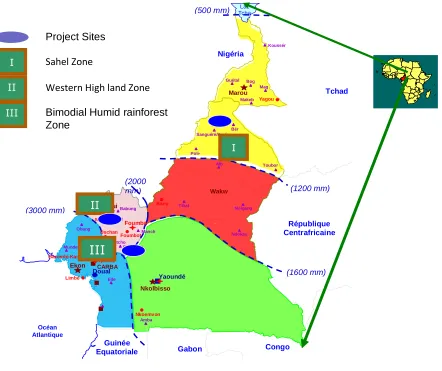
Marou a Garoua Wakw a Nkolbisso n Tchad République Centrafricaine Nigéria Congo Gabon Guinée Equatoriale (1200 mm) (500 mm) (2000 mm) (1600 mm) (3000 mm) Ekon a Bambui Foumbot Poli-Fignolé Guétal é Yagou a Koussér i Mb é Meigang a Bany o Foumba n Nkoemvon e Ede a Dschan
g Ndokayo
Njombé CARBA P Mundemb a Bangangt e Obang Mamfé Santcho u Mbourouko u Manko n Mag a Makeb i Sanguéré/Karéwa Toubor o Bér é Tibat i Amba m Manch a Lac Tcha d Barombi-Kang Limbé Océan Atlantique Doual
a Yaoundé
Sant a Bog o Babung o I II
III
Project Sites Sahel ZoneWestern High land Zone
Bimodial Humid rainforest Zone
I
II
III
Figure 1: Project sites
Table 1. Agro-ecological characteristics of the project sites.
Project sites Agro-ecological zones Altitudes (m asl) Rainfall (mm) Mean temp. (°C) Presence of processing center
North(Garoua) Sahel Zone 0 – 500 500 – 1500 22 - 38 Yes
Ndop plain Western Highlands 1200 – 1800 1500 – 2000 15 – 27 Yes
Mbam basin (Tonga) Humid Forest 0 – 500 2500 < 22 – 29 No
rice in Central Africa” was designed and implemented as of 2008. A key component of the project was the establishment of quality processing centers with the aim to increase price and quality competitiveness of locally produced rice vis-a-vis imports.
The development of processing is likely to have a profound impact on improving food security and rural incomes and reducing dependency on rice imports in CEMAC countries through innovative interventions that promote competitive domestic rice production, transformation and marketing.
With the intention of identifying a sustainable and most efficient management model and attracting investments
from principal investors, this paper thus aims to investigate the level of profitability of the different sections of the quality processing centers.
METHODOLOGY / APPROACH
Project sites
24 J. Agric. Crop Res. / Kenyi et al.
Table 2. Distribution of samples.
No. Category Ndop plain Garoua Total
1 Power tiller owner 4 0 4
2 Rice seed traders 2 2 4
3 Millers 15 5 20
4 Women processors 10 10 20
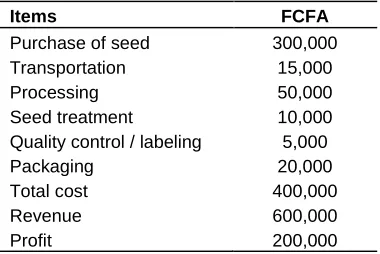
Table 3. Estimated cost and profit generated from 1 ton of seed.
Items FCFA
Purchase of seed 300,000
Transportation 15,000
Processing 50,000
Seed treatment 10,000
Quality control / labeling 5,000
Packaging 20,000
Total cost 400,000
Revenue 600,000
Profit 200,000
Sampling procedure / Data collection
The study adopted a purposive sampling technique for the selection of respondents for the study. The actors involved were: power tiller owners in Ndop plain, seed traders (Ndop and Garoua), primary processors/millers as well as secondary processors (i.e. women processing dough from rice flour in Ndop and Garoua). Given that the rice sector is not well developed in Cameroon, all categories of actors involved in rice production and processing of the project sites were involved in the sampling with the exception of women processors, of which 10 were randomly selected from each site. Table 2 shows the distribution of the samples by category of actors.
Using observatory and structured questionnaires, data was collected on all cost inquired revenues made per ha from ploughing to processing of 1 ton of raw material.
Analytical framework
Simple accounting procedures and simulation were used to calculate the different costs, revenues and profits of the different sections of the processing centers. All equipment was depreciated based on the life span of the different machines. Different options of management of the processing centers were revised to identify the best management options.
The costs of the different sections were calculated based on how the sections operate.
Seed section: Given that the center purchases and sells seed at the center, the different costs incurred are: costs
of seed, transportation, packaging, treatment, labour (processing, selling, etc), and other costs related to the depreciation of the sealing machines, the cost of the credit, etc).
Production-mechanization section: The center costs are the salaries of the operators, servicing costs, and the depreciation of the equipment.
Milling section: The costs are the procurement cost, the milling costs and the marketing cost. The total cost of each segment is calculated by summing up the cost of processing, selling, transportation, procurement, milling and marketing.
The Revenue from the center will be obtained from the sale of products produced and services rendered by the center.
In case of service rendered as ploughing of field, the revenue will be given as: Revenue = Price per hectare x Number of hectares.
In case of products sold, the revenue will be given as: Revenue = Unit price X Quantity sold.
The general formula for „Profit - π‟ is given as: Π = Revenue - Total Cost
RESULTS AND DISCUSSION
The objective of the study is to provide information on the organizational functioning and the profitability of rice quality processing centers. The study covered the five sections of the processing centers in the project sites generating data that can be used by any stakeholder to have a clear visibility on the level of profitability of the centers.
Seed section
This section, which is vital for ensuring quality end-products, will purchase seed from professional seed producers (members of processing centers and others) and sell it to the paddy producers‟ members of the processing centers and others. A breakdown of major operations and related costs and revenue related to the section is given in Table 3. It shows a profit margin of 200,000 FCFA2 per ton of seed.
Figure 2: Power-tiller
Table 4. Income generated from the hiring of equipment at the center for 1 ha of land.
Items FCFA
Ploughing 50,000
Harvesting 10,000
Total revenue 60,000
Servicing of machines/depreciation 5,000
Profit 55,000
Production-mechanization section
To reduce farmers‟ labor and ensure sustainability of the equipment, the center has to hire equipment to carry out some key operations in their plots such as ploughing with power-tillers (Figure 2) and harvesting with small-scale harvesters. Table 4 lists costs and revenues that can be generated from using the equipment to plough and harvest 1 hectare of land.
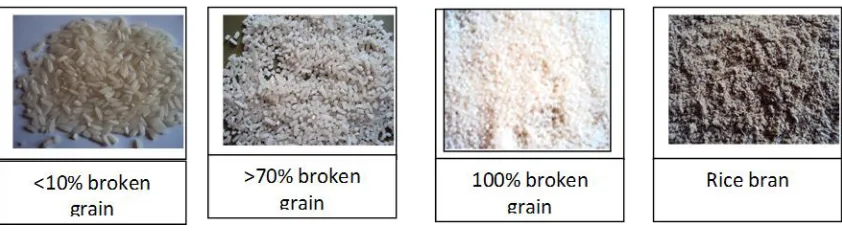
Milling section
This section, which will process the primary products, will purchase rice paddy (Figure 3), mill it with the aid of the milling complex (Figure 4) and sell milled-rice and rice sub-products (Figure 5). The profitability of the milling section is as follows: Assuming the purchasing cost of 1 ton of paddy at 140,000 FCFA and a milling percentage of 60%, the estimated cost to purchase the quantity of paddy that will give 1 ton of milled rice is 234,000 FCFA. The analysis shows that such a business is profitable
Figure 3: Paddy
Figure 4: Milling complex
with a profit margin of 76,000 FCFA plus an additional profit margin of 75,000 FCFA through the sales of the sub-products (broken rice and rice bran) (Table 5).
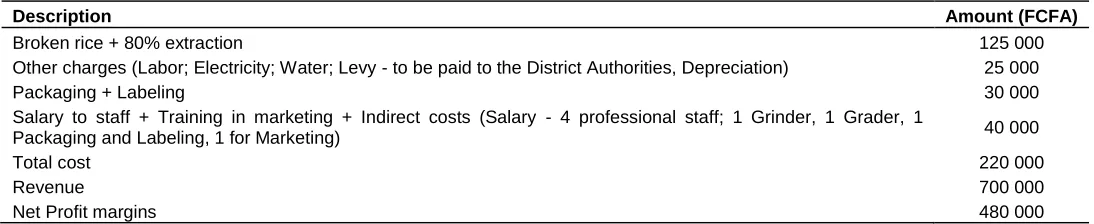
Rice flour section
An additional source of income in the rice value chain can come from secondary processing. Here the 100% broken grain is transformed to rice flour (Figure 6), thus adding value to small broken grains and a push to the rice-based product sector. The cost and profitability of the rice flour sector is shown in Table 6.
Rice-based products section
26 J. Agric. Crop Res. / Kenyi et al.
Figure 5: Rice sub-products
Table 5. Estimated profit acquired from the purchase of paddy, process and sale of 1 ton of milled rice.
Description Amount (FCFA)
Price of paddy at farm gate 140,000
Assuming 60% extraction 234,000
Procurement cost [Labor (Buying Point), Commission; Price of one PP bag (VAT inclusive) (assuming 100 kg bag); Stitching (at buying point) (sisal ropes); Transport from SD to Main Warehouse in (WH); Loading/Unloading at Warehouse) (Labor); Cleaning of Paddy at WH (Labor); Stacking (Labor); Warehousing (approx. 6 months); Fumigation/Treatment at WH; Levy (to be paid to the District Authorities]
15,000
Milling cost [Transportation - from WH to Milling Unit); Processing Charges (Separating, De-stoning, De-husking/Hulling, Polishing); Grading (Packing into 3 grades - Grade I, Grade II, and Grade III); Packing (50 kg bags) per kg]
5,000
Marketing cost: (Transportation - from Rice mill to market); Loading/Offloading; Security for
Transportation (Escort)); Bank charges 5,000
Salary to staff + Training + Indirect costs: (Salary -3 professional staff (1 Store accountant , 2 rice processers, daily labor) per kg; Commission for Marketing; Buying point; Training of buyers, processors and maintenance);Warehousing security, Depreciation)
5,000
Total cost 264,000
Selling price of products: Whole rice (400 FCFA/kg – 70% of rice) + Large broken rice (200 FCFA/kg – 30% of rice)
340,000
Selling price of sub-products: (40%) – Small broken rice (100 FCFA/kg – 65% of rice) + Bran (50 FCFA/kg – 25%) + Husk (1 FCFA – 10%)
75,000
Total revenue 415,000
Net profit margins 151,000
profit for putting biscuits on the market from 1 ton of rice is shown in Table 7.
Activities around the processing centers
Centers are seen as business centers where all the stakeholders (farmers, traders, input dealers millers,
Figure 6A: Rice Flour
Figure 6B: Pie and biscuits
Table 6. Estimated cost and profit generated from the process and sale of 1 ton of flour from small broken rice.
Description Amount (FCFA)
Broken rice + 80% extraction 125 000
Other charges (Labor; Electricity; Water; Levy - to be paid to the District Authorities, Depreciation) 25 000
Packaging + Labeling 30 000
Salary to staff + Training in marketing + Indirect costs (Salary - 4 professional staff; 1 Grinder, 1 Grader, 1
Packaging and Labeling, 1 for Marketing) 40 000
Total cost 220 000
Revenue 700 000
Net Profit margins 480 000
quality seed.
2) The production-mechanization sector: To intensify quality production of seed and paddy.
3) The milling sector: To ensure the availability of competitive milled rice.
4) The production of rice flour: To ensure the availability of rice flour for the processing of rice based products. 5) The fabrication and commercialization of rice-products, by-products and rice-based products (cakes, biscuits, etc) with the objective to develop new opportunities of value addition to the rice sector.
Broken rice grains are usually sold as animal feed. The
alternative of transforming it to rice flour and then into biscuits will lead to an additional profit of 480,000 and 3,500,000 FCFA respectively per ton of rice for rice flour and per ton of rice flour for rice biscuit.
Expected annual returns from a center
28 J. Agric. Crop Res. / Kenyi et al.
Table 7. Estimated cost and profit obtained from the fabrication and sale of biscuit from 1 ton of rice flour.
Items Cost (FCFA)
Ingredients (Sugar, Butter, Eggs, Baking powder, etc) + Additives 2,000,000
Flour 700,000
Packaging 3,000,000
Labor + Other charges 400,000
Total cost 6,100,000
Revenue 9,600,000
Net Profit margins 3,500,000
Figure 7: Processing center and activities around the centers
center and the other milling machines in the site.
The mechanization section, given the capacity of the machines and the availability of the farmers to hire the equipment, is expected to work on 10 ha of land each season.
As for the primary and secondary processing section, if the machines hull a maximum of 1 ton per hour and assuming that the machines run for at least 5 hours a day and 200 days a year, then the center needs a total of 1,000 tonnes of paddy a year to use the machine to its optimum capacity. The outputs of the processing section in terms of quantities of the different products and by-products are shown in Figure 8.
“Buy, process and sell” is not the only operational model for the centers. This and other options are reviewed below and assessed against most sustainable and profitable revenues.
Option I: Provide full service (buy, process and sell)
With this option, the centers purchase, process and sell primary products (milled rice and bran) and secondary products (rice flour, biscuits, etc).
Based on the already calculated profit, the total profit generated from this option based on the purchase of 1,000 tons of paddy is as follows (sum of all the profits from the different rice processing center sections):
Profit from processing and selling milled rice: (assumed 60% extraction rate)
600 tons of milled rice: 600 X 151,000 FCFA = 90, 600,000 FCFA
Figure 8: Breakdown of processing operations from paddy to rice biscuits
tons x 480,000 FCFA = 48,000,000 FCFA
Profit from processing and selling rice biscuits: 100 tons x 3,500,000 FCFA = 350, 000, 000 FCFA
Profit of sales of rice bran: 140 tons X 10,000 FCFA = 1, 400,000 FCFA
The total profit is estimated at 490,000,000 FCA (USD 980,000).
Option II: Provide service in kind to the paddy owners
Farmers supply paddy for processing and pay 10% of the paddy for the service. This is currently done by local processors. In such case, the centers process for farmers 90% of the raw material and keep 10% for themselves. Assuming the paddy owners supply 1,000 tons for processing, 900 tons will be processed and the paddy owner will collect all the products and by-products. The remaining 100 tons left with the processing center will cover the processing costs and a profit of the center. The profit will be:
Based on table 3, and assuming a cost of 10,000,000 FCFA covering milling, salaries and overheads for 1,000
tons plus a cost of 500,000 FCFA for marketing of 100 tons of milled rice and by-products.
Profit from the sale of 60 tons of rice from 100 tons of paddy 60 tons x 151 000 FCFA = 9,060,000 FCFA
Profit from the processing and selling rice flour: 20 tons x 480,000 FCFA = 9,600,000 FCFA
Profit from the processing and selling rice biscuits: 28 tons x 3,500,000 FCFA = 98,000,000 FCFA
Profit from the sales of rice bran: 14 tons X 10,000 FCFA = 140,000 FCFA
The total profit is estimated at 116,800,000 FCA (233,600 USD)
Option III: Provide milling cash service to the paddy owners
30 J. Agric. Crop Res. / Kenyi et al.
and other charges:
(1,000 tons x 20,000 FCFA) - (10,000,000 FCFA) = 10,000,000 FCFA (20,000 USD)
From the analysis of the three options, the option of purchasing, milling and selling rice and by-products is the most profitable. This option will permit the shareholder investors of the rice processing centers to receive dividends after removing the depreciations of the machines and the provisional investments and running costs.
According to evaluations, around 300,000 USD can be shared as dividends per year if the machines are used with full capacities by investing 400,000 USD. Apart from their profitability for shareholders, processing centers will create job opportunities for women and the youth: 10 young men working at the processing center 50 – 100 women producing and selling rice-based products.
In addition to all that, it is important to underline that farmers will have their own market where they can sell their rice at well-known fixed price and without any harassment and receive immediate cash and returns at the end of the processing campaign.
Operating modes of centers
Without an appropriate operating mode, the expected profit cannot be attained. The different management strategies commonly used in the Cameroon rice sector are:
Farmer-self management: Farmers produce the paddy, process and sell. This traditional operating mode is likely to fail. Over 90% of milling centers exclusively managed by farmers do not survive two rice seasons. This is due to the fact that they are not business men and they do not know where to sell the finished products.
Miller / Trader management: Through this operating mode, millers and traders buy paddy, process and sell. While this group has usually no difficulties in operating and managing such a rice processing center, the distrust of farmers usually lead to a very limited supply of paddy that forces these centers to inefficiently operate below their capacity.
Based on these difficulties faced by the different actors, the mode of operating of the CFC financed centers are a combination and can be labeled as a “Miller-Trader-Farmer coalition”, where each group is invested in the processing center and takes a vested interest in its optimal operation and management. After six months of operations it can already be observed that rice processors and rice traders invested in the processing centers develop market opportunities and adequately manage operations, while stakeholder farmers continue
to preferentially supply the centers with quality raw material as well as gaining capacity development from the centers.
The selected form of organization reconciles a partnership development between all stakeholders with the objective to generate profits. At village level, it helps to promote officially registered private initiatives that can contribute to the structuring of the rice-value chain. These centers will get backstop from the platforms of stakeholders (policy makers, researchers, farmers, micro-financial institutions, etc) that will play an advocacy role and help to create a conducive environment for appropriate use of local rules and regulations. At the same time they will protect centers from abusive or illegal interventions of undue tax collectors. Thus, the centers have to be managed by a committee comprised of at least 5 members (based on proportion of shares, 2 members from a farmer officially registered group, association or union and 3 members from traders and processors).
All farmers‟ activities around the pilot sites shall be channeled to the quality processing centers and organized by their groups, associations or unions. These activities will cover: i) provision of seed; ii) provision of fertilizers and pesticides when needed; iii) commercialization of seed and paddy and iv) provision of women farmers in rice flour. That means centers should be seen as vectors for the structuration of the rice value chain including the reinforcement of farmers‟ capacity and organizations.
CONCLUSION
The establishment of pilot rice processing centers can add value to rural rice production. These centers are expected to evolve into fully fledged business centers where all actors along the rice value chain will meet and interact (Producers, Traders, Input dealers, Platform members, Research, and Extension). Through these centers approximately 10 permanent employments can be created among which five will be for women. Indirect employments within the center can be up to 100. These comprise of labor for loading and off-loading 1,000 tons and Transportation of 1,000 tons. Centers will pay cash to farmers for their paddy, which is considered as a distinct advantage to farmers. At the end of the season dividends will be shared to shareholders based on their shares. In addition, the model will help in the restructuring of the rice value chain into at least three major sections: Production, Processing and Commercialization sections. Other indirect activities (restaurants, input dealers, etc) will be generated around the processing centers. If well-managed, the centers will be able to generate shares profit of over 300,000 USD per year.
step towards food security.
REFERENCES
FAOSTAT (2006). Food and Agriculture of the United Nations Database.
FAO (2006). Brief on imports surges, countries, no4, Cameroon: poultry, rice and vegetable oils. Commodities and trade division. Food and Agriculture of the United Nations (FAO), Rome, Italy.
Lostmart FA, Mbah NF (2007). The fortunes and misfortunes of women rice producers in Ndop, Cameroon and the implications for gender roles. J. int. women stud. 8(4):133-147.
Malaa D, Nzodjo P (2010). Strengthening the Availability and Access to Rice Statistics for
Sub-Saharan Africa: a Contribution to the Emergency Rice Initiative, Africa Rice Center Cotonou Benin.
Norman JC, Otoo E (2003). Rice development strategies for food security in Africa In sustainable rice production of the Upper Valley Development Authority (UNVDA) in Ndop region of Cameroon, 1970 – 1995. Nordic J. Afr. Stud. 12(2):220 -237.
Piebiep G (2008). Evaluating the Constraints and Opportunities for Sustainable Rice Production in Cameroon. Research Journal of Agriculture and Biological Sciences, 4(6): 734-744, 2008INSI net Publication.
Phelimas P (1990). Le riz: politique des prix et relance de la production (Cameroun, Côte d‟Ivoire, Madagascar et Sénégal). Politique Africaine 37:71-75.