© Global Society of Scientific Research and Researchers http://ijcjournal.org/
Novel Resource Allocation Algorithm for TV White Space
Networks Using Hybrid Firefly Algorithm
Ronoh Kennedy
a*, Omwansa Tonny
b, Kamucha George
ca,b
School of Computing and Informatics University of Nairobi, Nairobi, Kenya
c
Department of Electrical and Information Engineering, University of Nairobi, Nairobi, Kenya
aEmail: [email protected]
bEmail:[email protected]
cEmail: [email protected]
Abstract
There is continued increased demand for dynamic spectrum access of TV White Spaces (TVWS) due to
growing need for wireless broadband. Some of the use cases such as cellular (2G/3G/4G/5G) access to TVWS
may have a high density of users that want to make use of TVWS. When there is a high of density secondary
users (SUs) in a TVWS network, there is possibility of high interference among SUs that exceeds the desired
threshold and also harmful interference to primary users (PUs). Optimization of resource allocation (power and
spectrum allocation) is therefore necessary so as to protect the PUs against the harmful interference and to
reduce the level of interference among SUs. In this paper, a novel and improved resource allocation algorithm
based on hybrid firefly algorithm, genetic algorithm and particle swarm optimization (FAGAPSO) has been
designed and applied for joint power and spectrum allocation. Computer simulations have been done using
Matlab to validate the performance of the proposed algorithm. Simulation results show that compared to firefly
algorithm (FA), particle swarm optimization (PSO) and genetic algorithm (GA), the algorithm improves the PU
SINR, SU sum throughput and SU signal to interference noise (SINR) ratio in a TVWS network. Only one
algorithm considered (SAP) has better PU SINR, SU sum throughput and SU signal to interference noise
(SINR) ratio in a TVWS network but it has poor running time.
Keywords: Dymamic spectrum access; cognitive radio; TV white spaces; spectrum allocation; power control;, resource allocation; firefly algorithm, hybrid firefly algorithm genetic algorithm, particle swarm optimization.
---
1.Introduction
Spectrum occupancy assessments done in USA, Spain, Singapore, New Zealand and Germany [1] and UK [2],
indicate that a large portion of spectrum assigned to primary users (PUs) is underutilized. Spectrum is
considered a scarce resource. More and more devices want a pie of the spectrum and yet the useful spectrum is
limited. Dynamic spectrum access (DSA), through the use of cognitive radio (CR) techniques is currently being
embraced as a solution to spectrum underutilization and spectrum scarcity. This is because DSA, together with
CR, provides an efficient way for spectrum management and spectrum sharing. DSA allows the existence of
both primary and secondary users in a non-interfering basis. With DSA, spectrum allocated for exclusive use to
a primary user (PU) but being not used by the PU (incumbent), or any other idle frequency bands (such as guard
bands) can be shared by different secondary users (SUs) as long as the interference to the incumbent by the
secondary users to the PU is kept to an acceptable level [3,4]. The spectrum band which has attracted a lot
interest in the DSA community is the TV White Spaces (TVWS). TVWS is the spectrum band not being utilized
efficiently by TV transmitters in the UHF band. The main reason for this increased interest is the good
propagation characteristics of the sub-1GHz spectrum.
Regulatory authorities worldwide have mandated the use of geo-location database (GLDB) for protection of
PUs. Geo-location database is used by a SU or white space device (WSD) to find the set of frequency channels
that can be used on a secondary basis at a given area and at any given time [5]. GLDB is populated through the
use of a propagation model. The database contains estimated power levels of incumbents (PUs) for any point in
a particular region of interest. The WSD, which has a cognitive radio system (CRS), queries a central database.
The WSD provides the database with parameters such as its location, device type and antenna height. The
GLDB will then use this information along with the parameters of all surrounding TV transmitters such as
antenna height, transmit power and frequency of operation in order to come up with the list of available TVWS
channels that can be used by the WSD on secondary basis without causing harmful interference to the primary
users. The GLDB will also give the WSD limits on the transmit power and also the time period in which each
channel can be used.
It is expected there will be continued demand for dynamic spectrum access (DSA). There is increased demand
for DSA to TVWS from internet of things (IoT) [6], machine to machine communications, vehicle to vehicle
(V2V) communications [7,8], cellular networks (3G , 4G, 5G) [9,10,11]. This will result in secondary networks
with a high density of users. Problem of interference will arise in a TVWS network with a high density of users.
Some SUs also may not be admitted into the secondary network due to interference constraints at PUs and SUs.
TVWS can be used as long as the interference to the PU do not fall below a certain threshold. This threshold is
commonly referred to as protection ratio or desired to undesired (D/U) ratio. In a network where there is high
number of devices seeking access to a secondary network allocation of two resources, power and spectrum,
needs to be optimized to ensure that as many SUs as possible access the secondary network while ensuring that
interference constraints for PUs and QoS requirements for SUs are met. In this paper, resource allocation refers
to joint allocation of power and spectrum to SUs.
firefly algorithm (FA), genetic algorithm (GA) and particle swarm optimization (PSO) for a TVWS network that
considers adjacent channel interference as well as interference constraints at both PUs and SUs. The algorithm is
referred to as FAGAPSO. The contribution of this paper is the design of an improved algorithm based on hybrid
FA, GA and PSO (FAGAPSO) for joint power and spectrum allocation in a GLDB based wireless TVWS
network where devices communicate via a base station. Among other evolutionary algorithms, FA is chosen
because it has been found to perform better than other algorithms in terms of solution quality and convergence
time [12,13]. Despite its superior performance over other algorithms, FA can get trapped in local optimum.
Crossover feature of GA and the features of Pbest and gbest PSO are incorporated into FA so as to diversify the
search of solution space so that FA can avoid being trapped in the local optimum. In addition to incorporating
the features of PSO and GA, the initial solution of FA is derived from final solution of PSO. To the best of our
knowledge, FAGAPSO has not been used for joint power and spectrum allocation in a TVWS network that
makes use of a GLDB. Simulation results show that the use of FAGAPSO results in improvement in sum
throughput and SU SINR in a TVWS network.
The rest of the paper is organized as follows. Section 2 provides a review of related work on resource allocation
in a TVWS network. In Section 3 FA, GA, PSO and related hybrid algorithms are discussed. Section 4 presents
problem formulation for the optimization problem under consideration. In Section 5, the proposed algorithm
based on FAGAPSO has been presented. Simulation set up has been presented in Section 6. Simulation results
have been discussed in Section 7. The paper is concluded in Section 8.
2.Related Work
A resource allocation method has been proposed for IEEE 802.11af [14]. In an IEEE 802.11af network, a device
sends a channel availability query (CAQ) to registered location secure server (RLSS). RLSS operates as a
GLDB. Once a CAQ is received by the RLSS, it will respond with a white space map (WSM). The WSM
contains the list of available channels and their respective effective isotropic radiated power (EIRP). IEEE
802.11af allows for both closed loop power control and open loop power control. With open loop power
limitation the WSD has rigid power limitation similar to those provided by FCC regulations [3,15] whereby
fixed power values are used are assigned to SUs. In closed loop power control, the WSD has more flexible
power limits that depends on location, time of use and the channel. The technique proposed in IEEE 802.11af is
not designed to optimize resource allocation as it seeks to ensure that specific users that request channel are
allocated one with an associated power level. In our proposed algorithm, resource allocation is done for all users
that already exist in the network.
IEEE 802.22 makes use of a spectrum manager (SM) to allocate spectrum [16]. IEEE 802.22 allows the use of
both GLDB and spectrum sensing for incumbent protection. The SM makes use of spectrum sensing function
and GLDB to find out the channels available for secondary use and their respective effective isotropic radiated
power (EIRP) limits. Just like IEEE 802.11af, the technique proposed in IEEE 802.22 is not designed to
optimize resource allocation as it seeks to ensure that specific users that request channel are allocated one with
an associated power level. Power and spectrum allocation is done in an arbitrary manner with no use of an
allocation so as admit as many users as possible into the network.
GLDB based spectrum allocation with power control, co-channel interference and adjacent channel interference
considerations has been proposed by [17]. Co-existence (mutual interference) among SUs is also considered.
Channel allocation and power control is then done in such a manner that the TV receiver and SUs SINR
constraints are met. A greedy algorithm is used for power control and spectrum allocation. Each SU is allocated
a channel and a power level when it makes a channel request to the GLDB. The major disadvantage of the
proposed algorithm is that, being a greedy algorithm, it may get trapped in a local optimum. Being trapped in
local optimum will result in sub-optimal resource allocation.
GLDB based spectrum allocation with power control and admission control for TVWS multiple
device-to-device links has been proposed by [18]. Only co-channel interference has been considered. Spectrum allocation
is done using a game theory algorithm called spatial adaptive play (SAP). The disadvantage of this algorithm is
that it will have a high running time because of the high number of iterations required for the iterative power
allocation algorithm.
In our previous publication [19], we presented a resource allocation algorithm based on modified firefly
algorithm. The algorithm considers SUs operating in both co-channel and adjacent channels to PUs in a GLDB
based wireless TVWS network where devices communicate via a base station. We proposed a hybrid
continuous-binary FA since the optimization involves both continuous values (power allocation) and binary
values (spectrum allocation). In the current proposed algorithm FA is hybridized with both GA and PSO. The
The hybrid FA, GA and PSO is used for resource allocation because two reasons. Firstly, features of PSO and
GA incorporated into FA enables FA to diversify the search of solution space so as avoid being trapped at the
local optimum. Secondly, by using the PSO solution as initial solution of FA, the final solution of FA is
improved since final solution of FA depends on the initial solution [20].
3.Firefly Algorithm, Particle Swarm Optimization, Genetic Algorithm and Related Hybrid Algorithms
This section presents FA, PSO and GA as well as a review of hybrid FA and PSO and hybrid FA and GA in
literature.
3.1.Firefly Algorithm
FA mimics the behaviour of fireflies. Firefly is an insect that flash to either attract a mate or potential prey [21].
Flashing may also serve as a warning mechanism. The flashing of a firefly is rhythmic. For female fireflies, the
attractiveness of male fireflies depends on its brightness. The light intensity has an inverse relationship with
distance. Light intensity reduces as distance increases according to this formula:𝐼𝐼𝛼𝛼 1
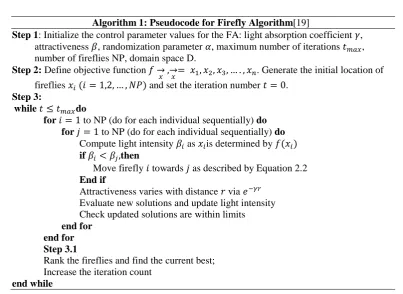
𝑟𝑟2. Fireflies, therefore, are visible within a limited distance. FA steps are presented in Algorithm 1. The objective function of an
optimization problem can be associated with the flashing. The light intensity is determined by brightness I
Table 3.1
Algorithm 1: Pseudocode for Firefly Algorithm[19]
Step 1: Initialize the control parameter values for the FA: light absorption coefficient 𝛾𝛾, attractiveness 𝛽𝛽, randomization parameter 𝛼𝛼, maximum number of iterations 𝑡𝑡𝑚𝑚𝑚𝑚𝑚𝑚, number of fireflies NP, domain space D.
Step 2: Define objective function 𝑓𝑓 𝑚𝑚
→ ,→𝑚𝑚= 𝑥𝑥1,𝑥𝑥2,𝑥𝑥3, … . ,𝑥𝑥𝑛𝑛. Generate the initial location of fireflies 𝑥𝑥𝑖𝑖 (𝑖𝑖= 1,2, … ,𝑁𝑁𝑁𝑁) and set the iteration number 𝑡𝑡= 0.
Step 3:
while 𝑡𝑡 ≤ 𝑡𝑡𝑚𝑚𝑚𝑚𝑚𝑚do
for 𝑖𝑖= 1 to NP (do for each individual sequentially) do for 𝑗𝑗= 1 to NP (do for each individual sequentially) do
Compute light intensity 𝛽𝛽𝑖𝑖 as 𝑥𝑥𝑖𝑖is determined by 𝑓𝑓(𝑥𝑥𝑖𝑖)
if 𝛽𝛽𝑖𝑖<𝛽𝛽𝑗𝑗,then
Move firefly 𝑖𝑖 towards 𝑗𝑗 as described by Equation 2.2
End if
Attractiveness varies with distance 𝑟𝑟 via 𝑒𝑒−𝛾𝛾𝑟𝑟 Evaluate new solutions and update light intensity Check updated solutions are within limits
end for end for Step 3.1
Rank the fireflies and find the current best; Increase the iteration count
end while
In an optimization problem, each firefly represents a potential solution to the optimization problem. In the FA,
variation of attractiveness with distance is given by:
𝛽𝛽=𝛽𝛽𝑜𝑜𝑒𝑒−𝛾𝛾𝑟𝑟2, (2.1)
where the term β refers to light intensity of the firefly, 𝑟𝑟 is the distance between two fireflies and γ is the light
absorption co-efficient. For any two flashing fireflies, the less bright one will move towards the brighter one
according to equation (2.2):
𝑥𝑥𝑖𝑖𝑡𝑡+1=𝑥𝑥𝑖𝑖𝑡𝑡+𝛽𝛽𝑜𝑜𝑒𝑒−𝛾𝛾𝑟𝑟𝑖𝑖𝑖𝑖 2
�𝑥𝑥𝑗𝑗𝑡𝑡− 𝑥𝑥𝑖𝑖𝑡𝑡�+𝛼𝛼𝑡𝑡𝜖𝜖𝑡𝑡𝑖𝑖, (2.2)
where the terms xi and xj are the locations of firefly iand firefly j, the symbol α is randomization parameter and
the term ϵti is a vector of random numbers with uniform distribution. The first term represents attractiveness
while the second term represents randomization. The symbol t is the iteration number. The distance between
fireflies, rij, is computed according to equation (2.3):
𝑟𝑟𝑖𝑖𝑗𝑗 = �(𝑥𝑥𝑖𝑖,𝑡𝑡− 𝑥𝑥𝑗𝑗,𝑡𝑡)2 . (2.3)
FA has been found to perform better than PSO and genetic algorithm (GA) [22][23]. FA has also been used for
resource allocation algorithm based on modified FA in [19]. For joint power and spectrum allocation, each
firefly represents a potential solution to the problem of finding optimal resource allocation to all SUs in the
TVWS network. Each firefly will consist of a power vector and channel allocation matrix. The objective
function of the optimization problem is to maximize sum throughput in the network and also minimize violation
minimum SINR at SUs and PU. At every iteration, the best firefly is determined and each firefly movement is
done according to step 3 in Algorithm 1. After a fixed number of iterations, the best firefly is selected as the
solution to the resource allocation problem.
3.2.Genetic Algorithm
Genetic algorithm (GA) mimics evolution of biological systems [24]. Each candidate solution to an optimization
problem is represented by a string called a chromosome. Random solutions that represent initial chromosomes
are first generated. The fitness of each of chromosome is then measured by using the objective function. In order
to imitate survival of the fittest in a biological system, chromosomes will exchange information amongst each
other in a random manner. The process of exchange of information is referred to as crossover. Two parents that
are randomly selected exchange information in the cross over process to create new offsprings. Just like the
evolution of biological systems, the new offsprings are then mutated. The mutation can prevent the GA from
getting stuck in a local maximum by randomly introducing little modifications in the chromosomes. The new
offsprings and previous parents are then evaluated using the objective function and ranked. Only a percentage of
the best chromosomes form the next generation of parents. The process of crossover and mutation is then
repeated again until maximum number of iterations is reached.
GA has been applied for spectrum allocation in a CRN in [25,26]. GA has been applied for transmit power
control in a CRN in [27]. For the problem under consideration in the paper, each chromosome represents a
candidate solution of joint power and spectrum allocation to all SUs in a CRN network. Initially SUs are
assigned power and channels randomly. Through the process of crossover and mutation, the best chromosome is
continuously improved over a number of iterations. The process of cross over involves two randomly chosen
power vectors exchanging the values of power assignment to SUs. After a fixed number of iterations, the best
chromosome will represent the optimal solution to the problem of finding optimal power allocation to SUs in the
CRN that minimizes sum power in the network as well as interference.
3.3.Particle Swarm Optimization Algorithm
PSO is inspired by a flock of birds flying towards a destination. Each candidate solution is referred to as a
particle. Each particle represents a bird in the flock. Unlike GA, now new birds/particles are generated. The
existing particles are improved iteratively. The birds adjust their social behaviour as they move towards the
destination. Birds communicate as they fly. As they communicate they identify the bird which is in the best
position and then they move towards it at a certain velocity. PSO combines both local search and global search.
Local search is represented by each bird learning from their own experience. Global search is represented by
PSO starts by generating a set of particles with a random solutions in the to the optimization problem. The
fitness of each particle is then evaluated. Each particle looks at three parameters: its current position Xi, its
current best position Pi and associated objective function value Pi, and its flying velocity Vi. At every iteration Xi
and associated objective function value Pi is updated if there is an improvement in 𝑁𝑁𝑖𝑖. The best particle, 𝑁𝑁𝑏𝑏𝑏𝑏𝑏𝑏𝑡𝑡, is
also determined at every iteration. The global best particle 𝑁𝑁𝑔𝑔 and associated objective function value gbest is
also updated if the current 𝑁𝑁𝑏𝑏𝑏𝑏𝑏𝑏𝑡𝑡 is better than 𝑔𝑔𝑏𝑏𝑏𝑏𝑏𝑏𝑡𝑡 at every iteration. At every iteration also, each particle flies
towards 𝑁𝑁𝑖𝑖 and 𝑁𝑁𝑔𝑔 at a certain velocity. Each particle updates its current velocity, 𝑉𝑉𝑖𝑖, according to the equation
(3.4):
𝑁𝑁𝑒𝑒𝑁𝑁𝑉𝑉𝑖𝑖= 𝜔𝜔 ×𝑐𝑐𝑐𝑐𝑟𝑟𝑟𝑟𝑒𝑒𝑐𝑐𝑡𝑡𝑉𝑉𝑖𝑖+𝑐𝑐1×𝑟𝑟𝑟𝑟𝑐𝑐𝑟𝑟() × (𝑁𝑁𝑖𝑖− 𝑋𝑋𝑖𝑖) + 𝑐𝑐1×𝑟𝑟𝑟𝑟𝑐𝑐𝑟𝑟() × (𝑁𝑁𝑔𝑔− 𝑋𝑋𝑖𝑖), (3.4)
where c1 and c2 are two positive constants and rand() is a random function. The term ω plays the role of
balancing local search and global search. With the new current velocity, the position of the particle is then
updated according to the equation (3.5):
𝑁𝑁𝑒𝑒𝑁𝑁𝑝𝑝𝑝𝑝𝑝𝑝𝑖𝑖𝑡𝑡𝑖𝑖𝑝𝑝𝑐𝑐𝑋𝑋𝑖𝑖=𝑐𝑐𝑐𝑐𝑟𝑟𝑟𝑟𝑒𝑒𝑐𝑐𝑡𝑡𝑝𝑝𝑝𝑝𝑝𝑝𝑖𝑖𝑡𝑡𝑖𝑖𝑝𝑝𝑐𝑐𝑋𝑋𝑖𝑖+ 𝑁𝑁𝑒𝑒𝑁𝑁𝑉𝑉𝑖𝑖, (3.5)
𝑉𝑉𝑚𝑚𝑖𝑖𝑛𝑛≥ 𝑉𝑉𝑖𝑖≥ −𝑉𝑉𝑚𝑚𝑚𝑚𝑚𝑚
where 𝑉𝑉𝑚𝑚𝑚𝑚𝑚𝑚 is the maximum particle velocity and 𝑉𝑉𝑚𝑚𝑖𝑖𝑛𝑛 is the minimum particle velocity.
PSO has been applied for spectrum allocation in a CRN in [28,29]. In both papers, a binary version of PSO is
used. PSO has been applied for power allocation in a CRN in [30] . In the proposed algorithm, the objective is to
maximize signal to interference noise ratio (SINR) for all SUs. Each particle (Xi), represents a potential solution
to the problem of finding optimal power and spectrum allocation to all SUs. Initially SUs are assigned power
randomly. The objective function used is minimization of minimum SINR violation. At each iteration the best
power vector for each particle (𝑁𝑁𝑖𝑖) and global best power vector (𝑁𝑁𝑔𝑔) are updated if there is an improvement. At
every iteration, Xi will then moves towards (𝑁𝑁𝑖𝑖) and (𝑁𝑁𝑔𝑔) at a certain velocity. After a fixed number of
iterations, 𝑁𝑁𝑔𝑔 will be selected as the optimal solution to the problem of power assignment. For joint power and
spectrum allocation, each particle will consist of power vector and channel allocation matrix.
3.4.Hybrid Firefly and Particle Swarm Optimization Algorithms
Arunacham et. al. [30] proposed a hybrid FA and PSO for problem of combined economic and emission
dispatch including valve point effect. In the proposed algorithm, there is no modification to firefly algorithm but
the initial solution is obtained from PSO. The authors argue that quality of the final solution of FA depends on
the initial solution. Simulation results show that hybrid the algorithm performs better than both PSO and FA.
Kora P. and Krishna K. [31] also proposed a hybrid FA and PSO algorithm for detection of bundle branch
block. The hybrid algorithm makes use of PSO concepts and parameters. The concepts of personal best and
algorithm except that equation (2.2) of the FA that represents firefly movement is changed to incorporate the
idea of personal best and global best. In the proposed algorithm, each firefly movement involves a move
towards the local best (𝑁𝑁𝑖𝑖) and global best (𝑁𝑁𝑔𝑔).
3.5.Hybrid Firefly and Genetic Algorithm
Rahmani A. and Mirhassani S.A. [21] proposed a hybrid FA and GA. All the steps in the FA remain the same
except that for every iteration, the two current best solutions are crossed over. Two fittest offsprings out of the
four offsprings are then selected. For mutation, one of the two offsprings is randomly selected. If the selected
offspring has a better solution compared to the current best solution, it replaces the current best solution in step
3.1 of Algorithm 1.
Luthra J. and Pal Saibal K. [32] also proposed a hybrid FA and GA for the solution of the monoalphabetic
substitution cipher. In the proposed algorithm, movement of fireflies in space is done using genetic operators
and the concept of dominant gene cross over. With dominant gene cross over, an offspring takes more from one
parent than the other during cross over.
4.Problem Formulation
The optimization problem to be considered is about resource allocation optimization described in our paper in
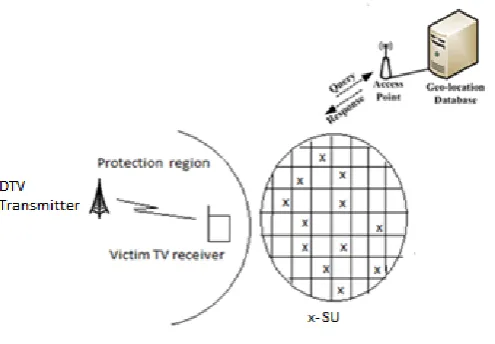
[19]. We consider a network illustrated by Figure 1. In the figure there a single TV receiver placed at the edge
of the protection region. Among all the TV receivers in the protection region, a TV receiver at this location is
the one which is most vulnerable to interference since it is very close to the secondary network. GLDB
regulations require that the protection ratio be measured at the edge of protection region [33]. Aggregate
interference at the TV receiver, both co-channel and adjacent channel should not make the protection ratio fall
below the required protection ratio threshold. We assume that the network consist of M SUs.
Figure 1: Interference scenario
maximizes sum downlink throughput while ensuring that interference constraints violations at the PU and SUs
are minimized. The optimization problem is defined as follows [19]:
Problem 1
𝑝𝑝∗, 𝐴𝐴∗= arg𝑚𝑚𝑟𝑟𝑥𝑥 (𝑈𝑈 − 𝑐𝑐
𝑏𝑏�max [0,𝑔𝑔𝑖𝑖𝑏𝑏]2 𝑁𝑁
𝑖𝑖=1
− 𝑐𝑐𝑝𝑝max [0,𝑔𝑔𝑖𝑖𝑝𝑝])2 (4.1)
subject to 𝐶𝐶: 𝑝𝑝𝑚𝑚𝑖𝑖𝑛𝑛≤ 𝑝𝑝𝑖𝑖≤ 𝑝𝑝𝑚𝑚𝑚𝑚𝑚𝑚
𝑟𝑟𝑛𝑛,𝑚𝑚∈ {0,1}
The first of equation (4.1), U, represents the sum throughput of all SUs, the second term (𝑐𝑐𝑏𝑏∑𝑁𝑁𝑖𝑖=1𝑚𝑚𝑟𝑟𝑥𝑥[0,𝑔𝑔𝑖𝑖𝑏𝑏]2)
represents interference threshold violation for SUs while the third term represents interference threshold
violation for PU. The terms 𝑐𝑐𝑏𝑏 and 𝑐𝑐𝑝𝑝 are penalty factors for SU interference threshold violation and PU
interference threshold violation.
5.Optimal Resource Allocation Using Hybrid Particle Swarm Optimization and Firefly Algorithm with
Genetic Operators
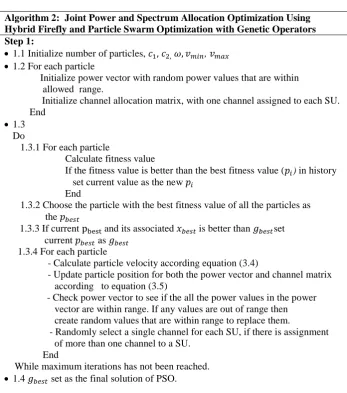
This section presents the proposed joint power and spectrum allocation optimization using FAGAPSO. The
algorithm steps are outlined in Algorithm 2. In step 1 of Algorithm 2, optimization of resource allocation is first
done using PSO. This is necessary because the final solution of FA depends on the quality of initial solution.
Each particle will consist of power vector and channel allocation matrix. All particles will be initialized with
random valid power and channel assignment for all SUs. In step 1.3.4, computation of velocity (equation (3.4))
and position update (equation (3.5)) will be done separately for channel allocation matrix and power allocation
vector. Here, PSO is used to solve a continuous-binary problem. This is because spectrum allocation is a binary
optimization problem while power allocation is a continuous optimization problem.In step 2, FA starts with
initial solution of PSO generated in Step 1. All fireflies will be initiated with solutions found in PSO particles at
the end of PSO in Step 1. In step 3, after ranking fireflies according to their fitness, the best two fireflies are
crossed over to generate four new offsprings. The four new offsprings are then ranked according to their fitness.
The current best firefly will then be replaced by the best offspring if its fitness as measured by objective
function value in equation 4.1 is higher (better) than that of the best offspring. Instead of firefly movement being
that described by equation (3.3), firefly movement will involve local search towards local personal best and
global search towards the global best according to equation (5.1). This is necessary so as to prevent PSO from
getting trapped in local optimum. The proposed algorithm therefore makes use some PSO operators including
𝑁𝑁𝑏𝑏𝑏𝑏𝑏𝑏𝑡𝑡, 𝑔𝑔𝑏𝑏𝑏𝑏𝑏𝑏𝑡𝑡, 𝑐𝑐1 and 𝑐𝑐2.
𝑥𝑥𝑖𝑖𝑡𝑡+1=𝑥𝑥𝑖𝑖𝑡𝑡+𝑐𝑐1𝑒𝑒−𝛾𝛾𝑟𝑟𝑖𝑖𝑖𝑖 2
(𝑝𝑝𝑖𝑖− 𝑥𝑥𝑖𝑖𝑡𝑡) + 𝑐𝑐2𝑒𝑒−𝛾𝛾𝑟𝑟𝑖𝑖𝑖𝑖 2
Table 5.1
Algorithm 2: Joint Power and Spectrum Allocation Optimization Using Hybrid Firefly and Particle Swarm Optimization with Genetic Operators Step 1:
• 1.1 Initialize number of particles, 𝑐𝑐1,𝑐𝑐2,𝜔𝜔,𝑣𝑣𝑚𝑚𝑖𝑖𝑛𝑛, 𝑣𝑣𝑚𝑚𝑚𝑚𝑚𝑚
• 1.2 For each particle
Initialize power vector with random power values that are within allowed range.
Initialize channel allocation matrix, with one channel assigned to each SU. End
• 1.3 Do
1.3.1 For each particle
Calculate fitness value
If the fitness value is better than the best fitness value (𝑝𝑝𝑖𝑖) in history set current value as the new 𝑝𝑝𝑖𝑖
End
1.3.2 Choose the particle with the best fitness value of all the particles as the 𝑝𝑝𝑏𝑏𝑏𝑏𝑏𝑏𝑡𝑡
1.3.3 If current pbestand its associated 𝑥𝑥𝑏𝑏𝑏𝑏𝑏𝑏𝑡𝑡is better than 𝑔𝑔𝑏𝑏𝑏𝑏𝑏𝑏𝑡𝑡set current 𝑝𝑝𝑏𝑏𝑏𝑏𝑏𝑏𝑡𝑡 as 𝑔𝑔𝑏𝑏𝑏𝑏𝑏𝑏𝑡𝑡
1.3.4 For each particle
- Calculate particle velocity according equation (3.4)
- Update particle position for both the power vector and channel matrix according to equation (3.5)
- Check power vector to see if the all the power values in the power vector are within range. If any values are out of range then create random values that are within range to replace them.
- Randomly select a single channel for each SU, if there is assignment of more than one channel to a SU.
End
While maximum iterations has not been reached.
• 1.4 𝑔𝑔𝑏𝑏𝑏𝑏𝑏𝑏𝑡𝑡 set as the final solution of PSO.
Step 2
• 2.1 Initialize the control parameters of the algorithm 𝛼𝛼,𝛽𝛽,𝛾𝛾 firefly number NP and maximum number of iterations tmax.
• 2.2 Set the dimension of fireflies 𝐷𝐷.
• 2.3 Set initial position of fireflies as those of the solution for Problem 1 generated by PSO in Step 1.
Step 3
• 3.1 Calculate the fitness value of each firefly using equation (4.1) and rank the fireflies according to their fitness values.
• 3.2 Find the current best solution.
• 3.3 Apply crossover mechanism separately for both the channel matrix and power
vector on the top two best solutions.
• 3.4 Select the best offspring out of the four offsprings created through crossover and use it as the current best solution of FA if its fitness is better than that of the current best.
Step 4
Step 5
• If it reaches the predefined maximum number of iterations, then the power vector
and channel allocation matrix of the current best solution mentioned in step 3 is derived and stop the progress else go to step 3 and continue.
6.Performance Evaluation
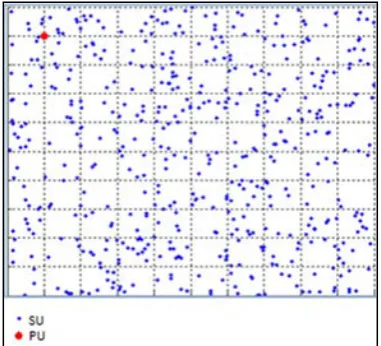
Simulation was done using Matlab R2016a. Matlab is chosen because it is rich in in-built functions. Fig. 2
shows the network diagram generated in Matlab. 1000 SUs are distributed over an area of 1 km2. Initially SUs
are distributed randomly across 10 channels. Initial channel and power assignment is also done randomly. The
free space path loss model was used to model path loss:
𝑁𝑁𝑃𝑃(𝑟𝑟) = 20 log(𝑟𝑟) + 20 log(𝑓𝑓)−147.55, (6.1)
where 𝑟𝑟 is the distance in meters and 𝑓𝑓 is the frequency of operation. The proposed resource allocation
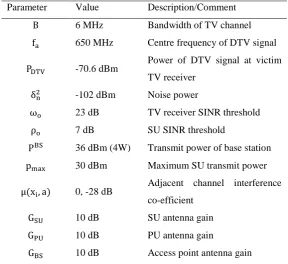
algorithm is then used to assign power and spectrum to SUs. Simulation parameters used are outlined in Table
6.1. Parameters used for FA are as follows: 𝛽𝛽𝑜𝑜= 1,𝛼𝛼= 30,𝛾𝛾= 10, number of fireflies 𝑁𝑁𝑁𝑁= 50. Parameters
used for PSO are as follows: number of particles = 50, inertia weights: 𝑁𝑁𝑚𝑚𝑚𝑚𝑚𝑚= 4 𝑟𝑟𝑐𝑐𝑟𝑟𝑁𝑁𝑚𝑚𝑖𝑖𝑛𝑛 = 2, social
parameter 𝑐𝑐1= 2 and cognitive parameter 𝑐𝑐2= 2. Parameters used for GA are as follows: number of
chromosomes=50, mutation rate = 0.8 and selection rate = 0.5. For FA, GA and PSO, the number of iterations
used is 50. For FAGAPSO, the number of iterations for FA (half that used by pure FA) is set to 25 while that of
PSO is set to 25 (half that used by pure PSO).
Table 6.1: Simulation Parameters
Parameter Value Description/Comment
B 6 MHz Bandwidth of TV channel
fa 650 MHz Centre frequency of DTV signal
PDTV -70.6 dBm
Power of DTV signal at victim
TV receiver
δn2 -102 dBm Noise power
ωo 23 dB TV receiver SINR threshold
ρo 7 dB SU SINR threshold
PBS 36 dBm (4W) Transmit power of base station
pmax 30 dBm Maximum SU transmit power
μ(xi, a) 0, -28 dB
Adjacent channel interference
co-efficient
GSU 10 dB SU antenna gain
GPU 10 dB PU antenna gain
Figure 2: Network diagram
7.Simulation Results
In this section, simulation results for joint optimization of power and spectrum allocation using FAGAPSO are
presented. FAPSOGA is compared with FA, PSO, GA, heuristic algorithm (HA) [17], spatial adaptive play
(SAP) [18]. Simulation results are generated for 10 simulation runs and an average is done. The performance of
the algorithm is compared using the following metrics: running time of algorithm, objective function value, sum
throughput, PU SINR and SU SINR. Two 𝑁𝑁𝑚𝑚𝑚𝑚𝑚𝑚 values are considered: 20dBm (for mobile WSDs) and 36dBm
(for fixed devices).
7.1.Objective Function Value
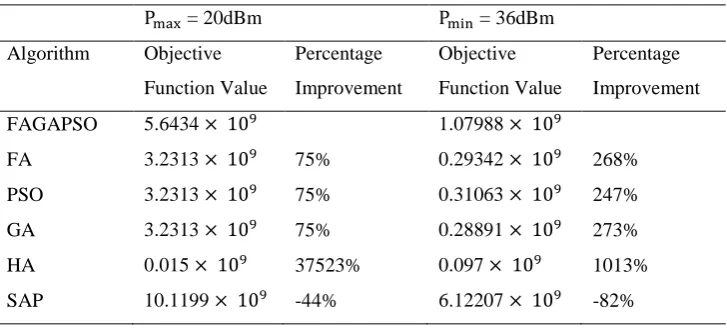
Tables 7.1 and 7.2 show comparison of FAGAPSO with the rest of the algorithms in terms of achieved objective
function value for N=1000 and N=500, respectively. The results show that the FAGAPSO achieves the best
(highest) objective function value represented by equation (4.1) for both N=500 and N=1000 and for both cases
of 𝑁𝑁𝑚𝑚𝑚𝑚𝑚𝑚 values except for SAP.
Table 7.1: Comparison of Objective Function Values for N=1000
Pmax = 20dBm Pmin = 36dBm
Algorithm Objective
Function Value
Percentage
Improvement
Objective
Function Value
Percentage
Improvement
FAGAPSO 7.9517× 10⁹ 2.0741 × 10⁹
FA 4.1682 × 10⁹ 91% 0.25438 × 10⁹ 715%
PSO 4.1682 × 10⁹ 91% 0.26538 × 10⁹ 682%
GA 4.1682 × 10⁹ 91% 0.25248 × 10⁹ 721%
HA 0.01 × 10⁹ 79417% 0.0677 × 10⁹ 2964%
Table 7.2: Comparison of Objective Function Values for N=500
Pmax = 20dBm Pmin = 36dBm
Algorithm Objective
Function Value
Percentage
Improvement
Objective
Function Value
Percentage
Improvement
FAGAPSO 5.6434 × 10⁹ 1.07988 × 10⁹
FA 3.2313 × 10⁹ 75% 0.29342 × 10⁹ 268%
PSO 3.2313 × 10⁹ 75% 0.31063 × 10⁹ 247%
GA 3.2313 × 10⁹ 75% 0.28891 × 10⁹ 273%
HA 0.015 × 10⁹ 37523% 0.097 × 10⁹ 1013%
SAP 10.1199 × 10⁹ -44% 6.12207 × 10⁹ -82%
7.2.Sum Throughput
Tables 7.3 and 7.4 show comparison FAGAPSO with the rest of the algorithms in terms of sum throughput in
the network for N=1000 and N=500, respectively.
The results show that the proposed algorithm achieves the highest sum throughput for both N=500 and N=1000
except for SAP.
This is because of the improved power and spectrum allocation that minimizes interference in the network.
According to Shannon channel capacity theorem, reduction in interference improves throughput.
Table 7.3: Comparison of Sum Throughput for N=1000
Pmax = 20dBm Pmin = 36dBm
Algorithm Sum
Throughput
(Gb/s)
Percentage
Improvement
Sum
Throughput
(Gb/s)
Percentage
Improvement
FAGAPSO 16.1147 5.274
FA 11.5609 39% 1.8067 192%
PSO 11.2829 43% 1.3463 292%
GA 11.305 43% 2.0025 163%
HA 0.227 6999% 1.165 353%
Table 7.4: Comparison of Sum Throughput for N=500
Pmax = 20dBm Pmin = 36dBm
Algorithm Sum
Throughput
(Gb/s)
Percentage
Improvement
Sum
Throughput
(Gb/s)
Percentage
Improvement
FAGAPSO 10.1145 2.8583
FA 7.3583 37% 1.5157 88%
PSO 7.2025 40% 1.344 112%
GA 7.1945 41% 1.6011 78%
HA 0.199 4983% 1.031 177%
SAP 20.0027 -49% 10.6692 -73%
7.3.Percentage of SUs less than SU SINR Threshold
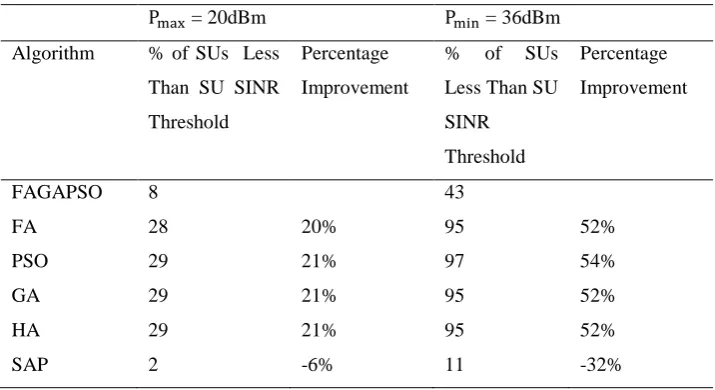
Tables 7.5 and 7.6 show comparison of FAGAPSO with the rest of the algorithms in terms of percentage of SUs
with SU SINR less than required threshold of 7dB in the network for N=1000 and N=500, respectively.
The results show that the FAGAPSO achieves the lowest percentage of SUs with SU SINR below threshold for
N=500 and N=1000 except for SAP.
This is because of the improved power and spectrum allocation that minimizes interference in the network.
Table 7.5: Comparison of Percentage of SUs less than SU SINR Threshold for N =1000
Pmax = 20dBm Pmin = 36dBm
Algorithm % of SUs Less
Than SU SINR
Threshold
Percentage
Improvement
% of SUs
Less Than SU
SINR
Threshold
Percentage
Improvement
FAGAPSO 8 43
FA 28 20% 95 52%
PSO 29 21% 97 54%
GA 29 21% 95 52%
HA 29 21% 95 52%
Table 7.6: Comparison of Percentage of SUs less than SU SINR Threshold for N = 500
Pmax= 20dBm Pmin = 36dBm
Algorithm % of SUs Less
Than SU SINR Threshold
Percentage Improvement
% of SUs Less Than SU SINR Threshold
Percentage Improvement
FAGAPSO 2 42
FA 10 8% 90 48%
PSO 11 9% 93 51%
GA 12 10% 89 47%
HA 12 10% 89 47%
SAP 0 -2% 15 -27%
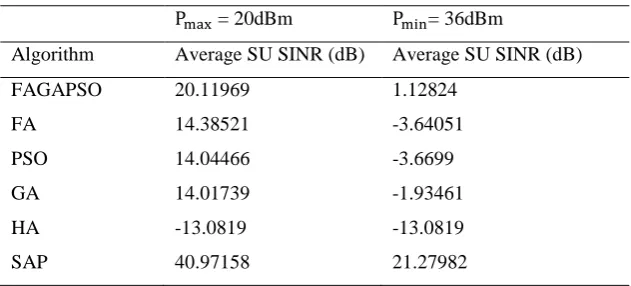
7.4.Average SU SINR
Tables 7.7 and 7.8 shows comparison of FAGAPSO with the rest of the algorithms in terms of average SU
SINR in the network for N=1000 and N=500, respectively. The results show that the proposed algorithm
achieves the highest SU SINR for both N=500 and N=1000 except for SAP. This is because of the improved
power and spectrum allocation that minimizes interference in the network.
Table 7.7: Comparison of Average SU SINR for N=1000
Pmax = 20dBm Pmin = 36dBm
Algorithm Average SU SINR (dB) Average SU SINR (dB)
FAGAPSO 15.6967 -0.02424
FA 10.86369 -6.43356
PSO 10.54429 -8.39994
GA 10.58621 -5.23181
HA -16.7004 -7.1581
SAP 30.61641 17.92071
Table 7.8: Comparison of Average SU SINR for N=500
Pmax = 20dBm Pmin= 36dBm
Algorithm Average SU SINR (dB) Average SU SINR (dB)
FAGAPSO 20.11969 1.12824
FA 14.38521 -3.64051
PSO 14.04466 -3.6699
GA 14.01739 -1.93461
HA -13.0819 -13.0819
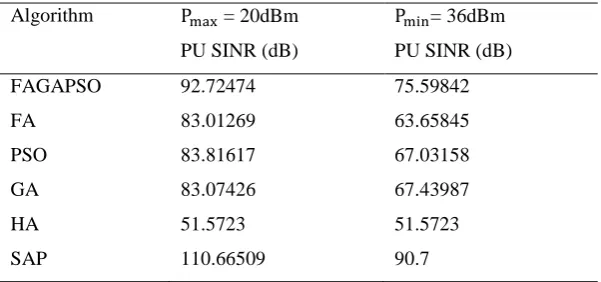
7.5.PU SINR
Tables 7.9 and 7.10 show comparison of FAGAPSO with the rest of the algorithms in terms of PU SINR in the
network for N=1000 and N=500, respectively. The results show that the FAGAPSO achieves the highest PU
SINR for both N=500 and N=1000 except for SAP. This is because of the improved power and spectrum
allocation that minimizes interference in the network.
Table 7.9: Comparison of PU SINR for N=1000
Pmax = 20dBm Pmin = 36dBm
Algorithm PU SINR (dB) PU SINR (dB)
FAGAPSO 92.50881 74.25305
FA 83.64993 64.77535
PSO 81.96864 61.27855
GA 82.81724 66.69795
HA 51.0569 60.1476
SAP 120.36414 88.88775
Table 7.10: Comparison of PU SINR for N=500
Algorithm Pmax = 20dBm Pmin= 36dBm
PU SINR (dB) PU SINR (dB)
FAGAPSO 92.72474 75.59842
FA 83.01269 63.65845
PSO 83.81617 67.03158
GA 83.07426 67.43987
HA 51.5723 51.5723
SAP 110.66509 90.7
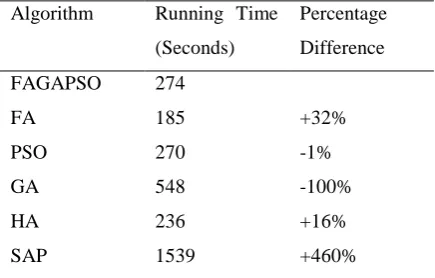
7.6.Running time
Table 7.11 shows comparison running time FAGAPSO with other algorithms. The run time in the table is for
1000 SUs in a network. The results show that SAP has the highest running time and FA has the lowest running
time. The running time for FAGAPSO is higher than that of FA, PSO and HA but lower than that of GA and
SAP. It can also be seen that the running time of almost the same as that of PSO. This can be attributed to the
number of iterations used for FAGAPSO being half that used by both FA and PSO as well as the additional
Table 7.11: Comparison of Algorithm Running Time for N=1000
Algorithm Running Time
(Seconds)
Percentage
Difference
FAGAPSO 274
FA 185 +32%
PSO 270 -1%
GA 548 -100%
HA 236 +16%
SAP 1539 +460%
8.Conclusion
Results also show that FAGAPSO performs better in terms of SU SINR, PU SINR and throughput compared to
the three other evolutionary algorithms (FA, PSO and GA). In terms of running time, the algorithm has almost
the same running time as PSO but it is faster than GA and slightly slower than that of FA. The slight
degradation of FA running time can be tolerated for improved resource allocation in a TVWS network.
Although SAP has the best resource allocation as measured by SU SINR, PU SINR and throughput, it has the
worst running time. Performance of the proposed algorithm shows that that the solution quality of FA can be
improved by using the final solution of PSO as initial solution of FA as well as incorporating crossover feature
of GA and PSO concepts of 𝑁𝑁𝑏𝑏𝑏𝑏𝑏𝑏𝑡𝑡and 𝑔𝑔𝑏𝑏𝑏𝑏𝑏𝑏𝑡𝑡. The results also show that both FA and PSO can be modified to
solve a continuous-binary problem where there decision variables consist of both binary and continuous values.
9. Recommendations
The performance of FA can be improved through the use of initial solution from PSO as well as incorporating
GA’s feature of crossover and PSO’s concepts of 𝑁𝑁𝑏𝑏𝑏𝑏𝑏𝑏𝑡𝑡and 𝑔𝑔𝑏𝑏𝑏𝑏𝑏𝑏𝑡𝑡. Since results have shown that FAGAPSO
performs better than existing algorithms, FAGAPSO should be applied for resource allocation in a TVWS
network.
10.Limitations and Future Work
In the study conducted, simulation was used. Simulation may not give a true reflection of a real world scenario.
In future, we intend to test the algorithm in a real world TVWS network in order to validate its performance.
References
[1] K. Patil, R. Prasad, and K. Skouby, “A survey of worldwide spectrum occupancy measurement campaigns
for cognitive radio,” in Devices and Communications (ICDeCom), 2011 International Conference on,
[2] M. Mehdawi, N. Riley, K. Paulson, A. Fanan, and M. Ammar, “Spectrum occupancy survey in
HULL-UK for cognitive radio applications: measurement & analysis,” International Journal of Scientific &
Technology Research, vol. 2, no. 4, pp. 231–236, 2013.
[3] M. Nekovee, T. Irnich, and J. Karlsson, “Worldwide trends in regulation of secondary access to white
spaces using cognitive radio,” Wireless Communications, IEEE, vol. 19, no. 4, pp. 32–40, 2012.
[4] R. Kennedy, K. George, O. Vitalice, and W. Okello-Odongo, “TV white spaces in Africa: Trials and role
in improving broadband access in Africa,” in AFRICON, 2015, 2015, pp. 1–5.
[5] J. Heo, G. Noh, S. Park, S. Lim, E. Kim, and D. Hong, “Mobile TV White Space with Multi-Region
Based Mobility Procedure,” IEEE Wireless Communications Letters, vol. 1, no. 6, pp. 569–572, Dec.
2012.
[6] A. Aijaz and A. H. Aghvami, “Cognitive Machine-to-Machine Communications for Internet-of-Things: A
Protocol Stack Perspective,” IEEE Internet of Things Journal, vol. 2, no. 2, pp. 103–112, Apr. 2015.
[7] O. Altintas et al., “Demonstration of vehicle to vehicle communications over TV white space,” in
Vehicular Technology Conference (VTC Fall), 2011 IEEE, 2011, pp. 1–3.
[8] S. Chen, R. Vuyyuru, O. Altintas, and A. Wyglinski, “On Optimizing Vehicular Dynamic Spectrum
Access Networks: Automation and Learning in Mobile Wireless Environments,” presented at the
Vehicular Networking Conference, 2011.
[9] P. Demestichas et al., “5G on the Horizon: Key Challenges for the Radio-Access Network,” IEEE
Vehicular Technology Magazine, vol. 8, no. 3, pp. 47–53, Sep. 2013.
[10] C. F. Silva, H. Alves, and A. Gomes, “Extension of LTE operational mode over TV white spaces,”
Future Network and Mobile Summit, pp. 1–13, 2011.
[11] M. Khalil, J. Qadir, O. Onireti, M. A. Imran, and S. Younis, “Feasibility, architecture and cost
considerations of using TVWS for rural Internet access in 5G,” in Innovations in Clouds, Internet and
Networks (ICIN), 2017 20th Conference on, 2017, pp. 23–30.
[12] X.-S. Yang, “Firefly algorithms for multimodal optimization,” in International Symposium on
Stochastic Algorithms, 2009, pp. 169–178.
[13] S. Arora and S. Singh, “A conceptual comparison of firefly algorithm, bat algorithm and cuckoo
search,” in 2013 International Conference on Control, Computing, Communication and Materials
(ICCCCM), Allahabad, India, 2013, pp. 1–4.
[14] A. B. Flores, R. E. Guerra, E. W. Knightly, P. Ecclesine, and S. Pandey, “IEEE 802.11 af: A standard
2013.
[15] “Technical and Operational Requirements for the possible operation of Cognitive Radio Systems in the
470-790 MHz,” Eoropean Communications Commission, Cardiff, Jan. 2011.
[16] C. Cordeiro, K. Challapali, D. Birru, and S. Shankar, “IEEE 802.22: the first worldwide wireless
standard based on cognitive radios,” in New Frontiers in Dynamic Spectrum Access Networks, 2005.
DySPAN 2005. 2005 First IEEE International Symposium on, 2005, pp. 328–337.
[17] Z. Xue, L. Shen, G. Ding, Q. Wu, L. Zhang, and Q. Wang, “Coexistence among Device-to-Device
communications in TV white space based on geolocation database,” in High Mobility Wireless
Communications (HMWC), 2014 International Workshop on, 2014, pp. 17–22.
[18] Z. Xue and L. Wang, “Geolocation database based resource sharing among multiple device-to-device
links in TV white space,” presented at the 2015 International Conference on Wireless Communications
& Signal Processing (WCSP), 2015, pp. 1–6.
[19] K. Ronoh, G. Kamucha, T. Olwal, and T. Omwansa, “Improved Resource Allocation for TV White
Space Network Based on Modified Firefly Algorithm,” Journal of Computing and Information
Technology, vol. 26, no. 3, pp. 167–167, Sep. 2018.
[20] S. Arunachalam, T. AgnesBhomila, and M. Ramesh Babu, “Hybrid Particle Swarm Optimization
Algorithm and Firefly Algorithm Based Combined Economic and Emission Dispatch Including Valve
Point Effect,” in Swarm, Evolutionary, and Memetic Computing, vol. 8947, B. K. Panigrahi, P. N.
Suganthan, and S. Das, Eds. Cham: Springer International Publishing, 2015, pp. 647–660.
[21] I. Fister, I. Fister, X.-S. Yang, and J. Brest, “A comprehensive review of firefly algorithms,” Swarm
and Evolutionary Computation, vol. 13, pp. 34–46, Dec. 2013.
[22] Q. Liu, W. Lu, and W. Xu, “Spectrum Allocation Optimization for Cognitive Radio Networks Using
Binary Firefly Algorithm,” in Proceedings of the 2014 International Conference on Innovative Design
and Manufacturing, Quebec, Canada, 2014.
[23] K. K. Anumandla, S. Kudikala, B. A. Venkata, and S. L. Sabat, “Spectrum allocation in cognitive radio
networks using firefly algorithm,” in International Conference on Swarm, Evolutionary, and Memetic
Computing, 2013, pp. 366–376.
[24] E. Elbeltagi, T. Hegazy, and D. Grierson, “Comparison among five evolutionary-based optimization
algorithms,” Advanced Engineering Informatics, vol. 19, no. 1, pp. 43–53, Jan. 2005.
[25] Y. El Morabit, F. Mrabti, and E. H. Abarkan, “Spectrum allocation using genetic algorithm in cognitive
International Workshop on, 2015, pp. 90–93.
[26] J. Elhachmi and Z. Guennoun, “Cognitive radio spectrum allocation using genetic algorithm,”
EURASIP Journal on Wireless Communications and Networking, vol. 2016, no. 1, Dec. 2016.
[27] R. Lopez, S. Sanchez, E. Fernandez, R. Souza, and H. Alves, “Genetic Algorithm Aided Transmit
Power Control in Cognitive Radio Networks,” in Proceedings of the 9th International Conference on
Cognitive Radio Oriented Wireless Networks, Oulu, Finland, 2014.
[28] Z. Jie and L. Tiejun, “Spectrum Allocation in Cognitive Radio with Particle Swarm Optimization
Algorithm,” Chinese Scientific Papers Online, 2012.
[29] B. Zhang, K. Hu, and Y. Zhu, “Spectrum Allocation in Cognitive Radio Networks Using Swarm
Intelligence,” 2010, pp. 8–12.
[30] S. Motiian, M. Aghababaie, and H. Soltanian-Zadeh, “Particle Swarm Optimization (PSO) of power
allocation in cognitive radio systems with interference constraints,” in 2011 4th IEEE International
Conference on Broadband Network and Multimedia Technology, Shenzhen, China, 2011, pp. 558–562.
[31] P. Kora and K. S. Rama Krishna, “Hybrid firefly and Particle Swarm Optimization algorithm for the
detection of Bundle Branch Block,” International Journal of the Cardiovascular Academy, vol. 2, no. 1,
pp. 44–48, Mar. 2016.
[32] J. Luthra and S. K. Pal, “A hybrid Firefly Algorithm using genetic operators for the cryptanalysis of a
monoalphabetic substitution cipher,” in 2011 World Congress on Information and Communication
Technologies, Mumbai, India, 2011, pp. 202–206.
[33] D. Gurney, G. Buchwald, L. Ecklund, S. Kuffner, and J. Grosspietsch, “Geo-location database
techniques for incumbent protection in the TV white space,” in New Frontiers in Dynamic Spectrum