ORIGINAL ARTICLE
Ken Watanabe · Shawn D. Mansfi eld · Stavros Avramidis
Application of near-infrared spectroscopy for moisture-based sorting of
green hem-fi r timber
Abstract A rapid, non-destructive, in-line method suitable for sorting green hem-fi r timbers (115-mm square) based on moisture content was established by near-infrared (NIR) spectroscopy. The accuracy of NIR sorting was compared with a commercial capacitance-type moisture meter. Mixed-species samples consisting of three moisture classes were assessed in this study. The NIR-based prediction model showed positive correlation with the actual calculated values as determined by oven-drying, regardless of knots, surface roughness, and the mix of two wood species. NIR proved to be capable of detecting the moisture content between all pairs of the three moisture groups, whereas the capacitancetype moisture meter failed to establish a signifi -cant difference between middle- and high-moisture groups. These fi ndings clearly demonstrate that NIR spectroscopy has a potential to estimate average moisture of green timber indirectly, although it inherently gives only surface moisture content values, as it is limited by scan depth.
Key words Near-infrared spectroscopy · Sorting · Hem-fi r · Moisture estimation · Green timber
Introduction
It has long been recognized that timber moisture uniformity can be improved after kiln drying by presorting lumber based on green moisture content estimates. Various tech-niques used to attain the estimates of green moisture content to facilitate improved overall recovery of dry lumber include weight, density, dielectric properties, and
K. Watanabe (*)
Forestry and Forest Products Research Institute, 1 Matsunosato, Tsukuba, Ibaraki 305-8687, Japan
Tel. +81-29-829-8306; Fax +81-29-874-3720 e-mail: [email protected] S.D. Mansfi eld · S. Avramidis
Department of Wood Science, University of British Columbia, Vancouver, BC, V6T1Z4, Canada
temperature.1
In Canada, the adoption of sorting technolo-gies by producers of structural timber has been growing steadily. In addition, drying schedule optimization com-bined with sorting strategies has been shown to result in better quality and higher yield.2
However, the current pre-sorting approaches fail to accurately measure the large vari-ability in moisture content that is inherent in green timber. Near-infrared (NIR) spectroscopy combined with the power of multivariate statistical modeling has been shown capable of predicting wood moisture content. For example, Hoffmeyer and Pedersen3
developed calibrations for the prediction of moisture in the hygroscopic range in Norway spruce (Picea abies) and concluded that NIR spectroscopy is very versatile for such an application. Karttunen et al.4 determined the moisture distribution of Scots pine (Pinus sylvestris) green logs by NIR spectroscopy and showed the existing moisture variation within and between logs. Adedipe and Dawson-Andoh5 examined the feasibility of using NIR spectroscopy to predict moisture between 0.3% and 80% in yellow-poplar (Liriodendron tulipifera L.) veneer sheets. Employing a reduced spectral range (1400– 1900 nm), a region ascribed to the two main hydroxyl absorption peaks, gave higher predictive capacity compared to the full spectra. Defo et al.6
evaluated the effects of grain orientation on predicting moisture content and basic density of red oak (Quercus spp.); the spectra collected from the transverse and radial surfaces provided better predictions than those collected from tangential surfaces. Watanabe et al.7
recently demonstrated that NIR could accurately detect wet-pockets on the surface of kiln-dried western hemlock (Tsuga heterophylla). It was also shown that surface mois-ture content (5–105%) could be predicted in real time at relatively rapid line speed (up to 1 m/s) without averaging NIR scans into a single spectrum, thus making the system very robust and fl exible.8
Although success has been demonstrated using NIR, its practical application for the wood industry is somewhat restricted because refl ected light inherent to the NIR region from the wood surfaces is measured and processed by multivariate analysis, and as such only surface information can be predicted. Therefore, extrapolation of surface
information to the entire timber is required as the dimen-sions of timber increase. To put NIR technology into com-mercial application for presorting of green timbers or logs, the sorting ability of NIR needs to be assessed in a more practical manner. The purpose of this study was to sort green hem-fi r9
baby-squares using an in-line NIR system based on the predicted moisture content and to evaluate sorting accuracy compared with a commercial capacitance-type moisture meter.
Materials and methods
Derivation of prediction models for moisture content
Forty-three kiln-dried timber specimens (105 × 105 mm in cross section and 2.5 m long) of western hemlock (Tsuga heterophylla) obtained from two production batches pro-vided by two different mills were cut into small test samples (100 mm long × 105 mm wide × 45 mm thick). NIR spectral information was captured from all three surfaces, offering a range of grain orientations including fl at-grain, edge-grain, and in-between grain. In addition, three types of wood (juvenile, sapwood, and heartwood) were evaluated; result-ing in a total of nine combinations (three orientations × three wood types) for a total of 90 samples (10 for each combination). The basic density of the samples ranged from 298 to 508 kg/m3
with a mean value of 368 kg/m3 and a standard deviation of 45 kg/m3
.
All samples were oven dried at 103° ± 2°C for 24 h and weighed with a digital balance. Thereafter, the samples were conditioned to target equilibrium moisture contents above 30% in a conditioning chamber (model CL-5488F; Param-eter Generation & Control, Black Mountain, NC, USA) for 4 weeks at a temperature and relative humidity of 50°C and 99%RH, respectively. Subsequently, each group was soaked in distilled water for 10 min and then placed in sealed bags for 2 weeks for the water to diffuse and redistribute within the samples. Their weight was again measured before NIR spectra acquisitions. Consequently, moisture content of the samples ranged from 35% to 105% with an average of 64%.
NIR spectra were collected with the LF-1900 spectrom-eter (Spectral Evolution, North Andover, MA, USA) operat-ing in a diffuse refl ectance mode at 4-nm intervals between 1200 and 2116 nm. A fi ber optic probe was oriented at 90° above the sample surface, and a piece of commercial micro-porous Tefl on was used as reference. The samples were illu-minated with a DC lamp oriented at 30° above the sample and aligned parallel to the longitudinal direction of each sample. The distance between the sample surface and the bottom of the spectrometer was 200 mm. The NIR spot area was approximately 77 × 20 mm. A single spectrum was obtained by averaging ten independent scans. Two spectra were collected from each sample, one from the upper surface and the other from the bottom. Thereafter, 108 of the 180 spectra captured were used as the calibration set and the remaining 72 spectra were used as the validation set.
Prior to modeling, spectral data sets were pre-processed using the Savitzky–Golay second derivative spectra with
seven convolution points10
to remove the effects of baseline and slope. The wavelength range of 1300–2100 nm, which is known to be associated with the hydroxyl groups5,11
and which corresponded to the highest predictive capability in previous studies,7
was used. In addition, the upper wave-length limit was reduced to 2050 nm because signifi cant spectral noise was detected between 2050 and 2116 nm in the initial scans.
Multivariate analysis of the preprocessed spectra was performed using Unscrambler version 9.1 software (CAMO, Corvallis, OR, USA). A partial least squares (PLS) regres-sion multivariate technique was used to construct the cali-bration models consisting of the 108 spectra in the calicali-bration set using a complete crossvalidation method. The coeffi -cient of determination (R2
) and the root mean square error of cross-validation (RMSECV) were used to assess calibra-tion performance. The RMSECV is a direct estimacalibra-tion of the calibration modeling error.
Determination of the optimum number of principal com-ponents (PCs) is very important to prevent overfi tting and underfi tting of calibration models. The optimal PCs were determined by observing the response of the residual vari-ance with added PCs. When additional PCs did not sub-stantially decrease the residual variance, iterations were terminated. Outliers were selected as being those samples whose residual standard deviation was greater than two times the total standard deviation for all samples. As a result, outliers were detected using this method.
The moisture content of each sample in the validation set was estimated using the calibration model. Predictive quality was evaluated by comparing the calculated values to the measured values. The coeffi cient of determination (R2
), root mean square error of prediction (RMSEP), and ratio of performance to deviation (RPD) served as statisti-cal measures of predictive power. RMSEP values were used to measure how well the calibration model predicts the parameter of interest for a set of unknown samples, which were different from the calibration set. RPD, which is the ratio of the standard deviation of the reference data to the standard error of prediction, provides a further assessment of the calibration model.12
An RPD of greater than 8 is good for process control, development, and applied research; values of 5 to 8 are adequate for quality control, and 2.5 to 5 are satisfactory for screening.
Moisture-based sorting of hem-fi r timbers
Freshly sawn hem-fi r timbers were sourced at a local sawmill. As defi ned by the Western Wood Products Associa-tion, hem-fi r is a mixed-species combination of approxi-mately 70% western hemlock (Tsuga heterophylla) and 30% amabilis fi r (Abies amabilis)9
capacitance-type moisture meter (capacitance) designed to sort green timber before drying. Fifty timbers were ran-domly selected for each group, and therefore 150 (50 × 3) specimens were evenly preclassifi ed into three groups.
The top and bottom surfaces of each specimen were scanned using a pilot-plant in-line NIR system with a line speed of 1 m/s. A detailed description of the NIR system was reported previously.8
Sixty-six spectra were obtained from each surface. Subsequently, the moisture content of top and bottom surfaces were predicted using the previ-ously developed PLS regression model. The total moisture content of each specimen was extrapolated by averaging the predicted moisture content of both surfaces. All specimens were equally sorted into three groups (high, middle, and low) based on the averaged moisture content.
Ten small sections (cookies) 50 mm thick were then cut from each specimen (Fig. 1a). In addition, the #3 and #8 cookies were cut into shell and core regions to determine their moisture differences (Fig. 1b). As the specimens con-tained knots and had rough surfaces, the thickness of the shell region was kept at 5 mm, the minimal thickness we could cut without damage. Ten cookies including shell and core regions were weighed individually and then dried in an oven at 103° ± 2°C for 2 days. Thereafter, their moisture content was calculated gravimetrically. The average mois-ture content of each specimen was then determined by aver-aging the moisture contents of the ten cookies.
Results and discussion
Validation of the PLS regression model
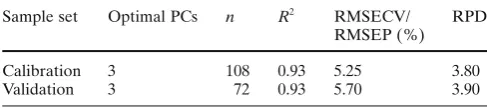
The PLS regression model resulted in very high R2
of 0.93 and 0.93 and low RMSECV/RMSEP of 5.25% and 5.70% for the calibration and the validation, respectively (Table 1). RPD, which serves as a statistical measure of predictive power, was 3.9 in the validation, suggesting that the model
is adequate for screening. Predicted moisture contents in the validation set were plotted as a function of the actual values as determined by the oven-dry method (Fig. 2). The solid line indicates where a predicted value equals the mea-sured value (R2 = 1). Deviation from these lines is indicated by RMSEP in Table 1. The PLS regression model showed good agreement and excellent moisture predictability, dem-onstrating that the resultant PLS regression model can predict moisture content of western hemlock ranging from 35% to 105%, which is the moisture range of the samples used in the model. Industrial moisture meters that have been widely used in sawmills, such as capacitance meters, require a correction for wood density. In contrast, the PLS regression model succeeded in predicting moisture content within the range of basic density (298–508 kg/m3
) covered by the calibration set, demonstrating that NIR spectroscopy has the advantage of measuring moisture content without the need to correct for wood density.
Defi ned wavelength range correlated to moisture content
The raw absorbance spectra for various moisture contents are illustrated in Fig. 3. The two spectral peaks at 1430 and 1910 nm, which are attributed to OH absorption due to water, increased with increasing moisture content (Karttunen et al.4
). The regression coeffi cients of the PLS Fig. 1. Cutting pattern of small
sections (cookies)
Table 1. Summary statistics of partial least squares (PLS) regression
model for moisture content
Sample set Optimal PCs n R2 RMSECV/
RMSEP (%) RPD
regression model were useful in determining important spectral regions correlated to moisture content. These coef-fi cients, at 1430 and 1910 nm, were close to zero, indicating that the two wavelengths had a small impact on the PLS regression model. High negative or positive regression coef-fi cients were observed at 1363 and 1386 nm, which are assigned to the CH deformation and second overtone of CH stretching in cellulose,13
and the second overtone of OH stretching in water,14
respectively. This wavelength range could possibly have an important impact on the prediction of moisture content above 30%.
Moisture-based sorting of hem-fi r timbers
Distributions of average moisture contents for the 150 spec-imens calculated by the oven-dry method (Fig. 4) ranged from 37% to 167%, with an average of 72%. Similar varia-tion in hem-fi r timber has been previously reported.15,16
Figure 5 shows the moisture distributions of the pre-classifi ed high, middle, and low moisture content groups sorted by capacitance and NIR, respectively. Overall, the moisture distribution of the low group was the lowest among three groups, whereas that of the high group appeared to be the highest. However, the average moisture content of the middle group sorted by capacitance was slightly higher than that of the high group (Fig. 6), illustrat-ing that capacitance meters inherently lose their accuracy at high moisture content, especially when their predictive ability is impacted by wood density.
One-way analysis of variance (ANOVA) tested the dif-ferences in average moisture content among the three groups. The Tukey–Kramer multiple comparison test was used to compare pairwise means. A signifi cant difference in moisture content between all pairs of the three groups was observed when sorted by NIR (one-way ANOVA, P < 0.01; Tukey–Kramer multiple comparison test, P < 0.01), whereas no signifi cant difference between middle and high groups was apparent when sorted by capacitance. We considered that NIR performed better than the more traditional capacitance-type moisture meter and that an NIR approach is capable of accurately sorting green timber based on mois-ture content.
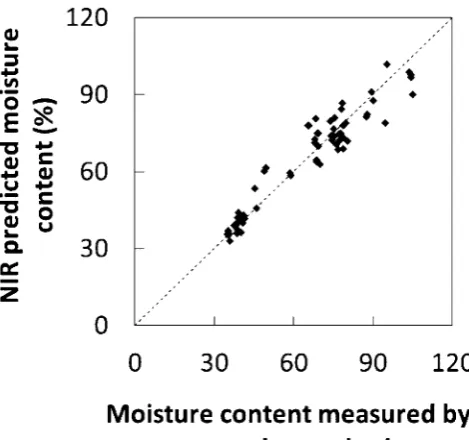
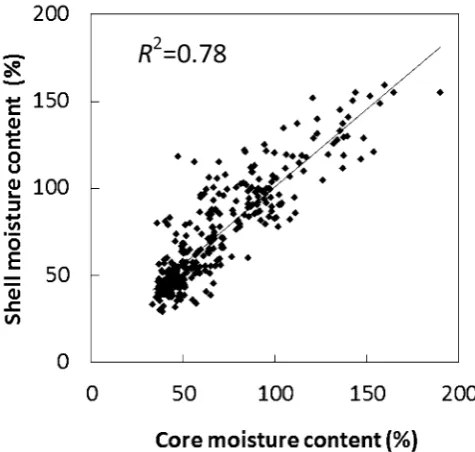
The relationship between shell and core moisture content measured from selected cookies was also determined (Fig. 7). In short, it was apparent that there was a good agreement between shell and core moisture content, and as such, dem-onstrated why NIR can predict average moisture indirectly, although it inherently gives us only surface information. When measured average moisture content versus NIR pre-dicted is plotted (Fig. 8), NIR-prepre-dicted moisture content showed a positive correlation with the measured moisture Fig. 2. Near-infrared (NIR) predicted versus measured values in the
validation set. Dotted line, target line
Fig. 3. NIR raw spectra for various moisture contents and regression
coeffi cients of the partial least squares (PLS) regression model. Gray
line, regression coeffi cients; arrows, wavelengths with high positive or
negative regression coeffi cients
Fig. 4. Distribution of average moisture content of all specimens by
Fig. 5. Moisture distributions of high, middle, and low groups sorted
by capacitance and NIR, respectively
Fig. 6. Average moisture content of high, middle, and low groups
sorted by capacitance and NIR, respectively. Plots and error bars indi-cate mean value and standard deviations, respectively
Fig. 7. Relationship between shell and core moisture content
deter-mined by oven-dry method
content, indicating that the in-line NIR system was capable of estimating the average moisture of green timber by scan-ning the timber surface. It has been demonstrated that NIR spectroscopy has the potential to predict many wood traits, such as basic density,17,18
shrinkage,19
grain angle,20 micro-fi bril angle,21
and modulus of elasticity,22,23
which can all impact checking and shape distortions that occur during drying. By means of multiple trait assessment of green timber before drying, more optimized timber sorting could be developed in the future. NIR technology has a conspicu-ous advantage for timber pre-drying sorting over the other moisture meters.
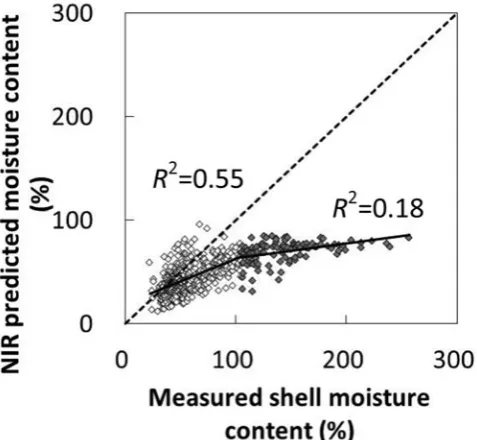
Measured and NIR-predicted surface moisture content (Fig. 9) showed the R2
values for moisture content below and above 105% were 0.55 and 0.18, respectively. Surface mois-ture content above 105% was underestimated; moismois-ture content below 105% showed a positive correlation between predicted and measured values regardless of knots and rough surface, explained by the limitation of the calibration model employed in NIR evaluation. The model was constructed from 100% hemlock samples whose moisture content was below 105%. Therefore, the model is not, in theory, suitable for predicting moisture content of samples over 105%, result-ing in the underestimation of moisture content. Watanabe et al.8
recently reported that moisture content beyond the
Fig. 8. Plots of measured average moisture content by oven-dry
method against NIR predicted
Fig. 9. Measured and NIR-predicted surface moisture content. Dotted line, target line. The plots are separated into two moisture ranges, below
and above 105%
The PLS regression model tended to underestimate mois-ture content ranging from 35% to 105% as measured content increased (Figs. 8, 9). The relationship between measured and predicted moisture content was non-linear and may be a result of surface drying. Surface drying during NIR measurement was shown to occur (Karttunen et al.4
) when the moisture distribution of cross sections of logs were scanned. The authors suggest that the deviation between measured and NIR-predicted moisture content resulted from the drying effect on the surface, and therefore the effect of surface drying needs to
be considered. In our study, each NIR scan required less than 3 s, and therefore surface drying is likely negligible. It should be kept in mind, however, that this study was conducted on specimens that, although they were “green,” were at least a few weeks old. It is well known that timber surfaces will immedi-ately start drying following sawmilling, and therefore the dif-ference between surface and core measures will increase with time. Such surface drying caused signifi cant moisture gradient within a shell region, resulting in the nonlinear relationship in Figs. 8 and 9. In general, the moisture gradient perpendicular to the surface increases as the measured moisture content of a shell region increases. Furthermore, the difference between measured and NIR-predicted moisture content increases with increasing moisture gradient, because predicted moisture content is refl ected on the surface layer of less than 3 mm,7 whereas measured moisture content shows the average of a shell region with 5-mm thickness. This difference is most likely the reason the PLS regression model tended to underestimate moisture content as the measured shell moisture content increased.
Because the rate of surface drying depends on environ-mental conditions, which vary with season and location, improving the PLS regression model to compensate for the underestimation of moisture content is diffi cult. Meanwhile, surface drying can be prevented if the NIR measurements are taken immediately after conversion to timber. This method may be the simplest way to solve the surface-drying issue that caused the underestimation of moisture content, so that the predictive results may be improved.
Conclusion
Partial least squares (PLS) regression models capable of predicting the surface moisture content of Tsuga hetero-phylla timber were developed based on NIR spectra of small samples conditioned to set moisture contents above 30%. Following the establishment of the model, the mois-ture content of commercially produced green hem-fi r timbers (115 mm square) was predicted using the in-line NIR system combined with the developed PLS regression model with a line speed of 1 m/s. In addition, the timbers were sorted into three groups based on the predicted mois-ture content, and the sorting ability of NIR was compared with the commercial capacitance-type moisture meter.
There was a good correlation between shell and core moisture content by the oven-dry method, demonstrating that moisture content can indeed be predicted by NIR, which showed a positive correlation with the measured oven-dried values. There was a signifi cant difference in moisture content between all pairs of the three groups sorted by NIR, whereas no signifi cant difference between the middle and high moisture groups were shown when sorted by the capacitance-type moisture meter. These results demonstrate that an NIR approach is capable of sorting green timber based on moisture content.
Acknowledgments This project was funded through a grant provided
Inno-vation Investment. The hem-fi r timbers used in this work were pro-vided by Western Forest Products–Alberni Pacifi c Division sawmill.
References
1. Oliveira LC (2003) Drying sorted spruce-pine-fi r (spf) timber. In: Proceedings of the 8th International IUFRO Wood Drying Confer-ence, Brasov, Romania, pp 178–184
2. Elustondo DM, Oliveira LC (2009) A method for optimizing timber sorting before kiln-drying. For Prod J 59:45–50
3. Hoffmeyer P, Pedersen JG (1995) Evaluation of density and strength of Norway spruce wood by near infrared refl ectance spec-troscopy. Holz Roh-Werkst 53:165–170
4. Karttunen K, Leinonen A, Sarén M-P (2008) A survey of moisture distribution in two sets of Scots pine logs by NIR-spectroscopy. Holzforschung 62:435–440
5. Adedipe EO, Dawson-Andoh B (2008) Predicting moisture content of yellow-poplar (Liriodendron tulipifera L.) veneer using near infrared spectroscopy. For Prod J 56:28–33
6. Defo M, Taylor AM, Bond B (2007) Determination of moisture content and density of fresh-sawn red oak timber by near infrared spectroscopy. For Prod J 57:68–72
7. Watanabe K, Hart F, Mansfi eld SD, Avramidis S (2010) Detection of wet-pockets on the surface of Tsuga heterophylla (Raf.) Sarg. by near infrared (NIR) spectroscopy. Holzforschung 64:55–60 8. Watanabe K, Hart F, Mansfi eld SD, Avramidis S (2010) Near
infra-red technology applications for quality control in wood processing. In: Proceedings of the COST E53 Conference, Edinburgh, UK, pp 332–341
9. Western Wood Products Association (WWPA) (1997) Hem-fi r species facts. http://www2.wwpa.org/WESTERNSPECIES/Hem Fir/tabid/299/Default.aspx. Accessed Sep 8, 2010
10. Savitzky A, Golay MJE (1964) Smoothing and differentiation of data by simplifi ed least square procedures. Anal Chem 36:1627– 1639
11. Kelley SS, Rials TG, Groom LR, So CL (2004) Use of near infrared spectroscopy to predict the mechanical properties of six softwoods. Holzforschung 58:252–260
12. Williams PC, Sobering DC (1993) Comparison of commercial near infrared transmittance and refl ectance instruments for analysis of whole grains and seeds. J Near Infrared Spectrosc 1:25–32 13. Siesler HW, Ozaki Y, Kawata S, Heise HM (2002) Near-infrared
spectroscopy principles, instruments, applications. Wiley, Weinrich, pp 180–183
14. Ali M, Emsley AM, Herman H, Heywood RJ (2001) Spectroscopic studies of the ageing of cellulosic paper. Polymer 42:2893–2900 15. Jessome AP (1977) Strength and related properties of woods
grown in Canada. Forestry Technical Report 21. Eastern Forest Products Laboratory, Ottawa, Ontario, Canada
16. Zhang Y, Oliveira L, Avramidis S (1996) Drying characteristics of hem-fi r squares as affected by species and basic density presorting. For Prod J 46:44–50
17. Thygesen LG (1994) Determination of dry matter content and basic density of Norway spruce by near infrared refl ectance and transmittance spectroscopy. J Near Infrared Spectrosc 2:127–135 18. Schimleck LR, Michell AJ, Raymond CA, Muneri A (1999)
Estima-tion of basic density of Eucalyptus globulus using near-infrared spectroscopy. Can J For Res 29:194–201
19. Taylor AM, Baek SH, Jeong MK, Nix G (2008) Wood shrinkage prediction using NIR spectroscopy. Wood Fiber Sci 40:301–307 20. Gindl W, Teischinger A (2002) The potential of vis- and
NIR-spectroscopy for the nondestructive evaluation of grain-angle in wood. Wood Fiber Sci 34:651–656
21. Kelly SS, Rials TG, Snell LH, Groom LH, Sluiter AD (2004) Use of near infrared spectroscopy to measure the chemical and mechanical properties of solid wood. Wood Sci Technol 38:257– 276
22. Kelley SS, Rials TG, Groom LR, So C-L (2004) Use of near infrared spectroscopy to predict the mechanical properties of six softwoods. Holzforschung 58:252–260