www.j-sens-sens-syst.net/6/1/2017/ doi:10.5194/jsss-6-1-2017
© Author(s) 2017. CC Attribution 3.0 License.
A mode-localized MEMS electrical potential sensor
based on three electrically coupled resonators
Chun Zhao1, Graham S. Wood1, Suan Hui Pu1,2, and Michael Kraft3
1Nano Research Group, School of Electronics and Computer Science, University of Southampton, Southampton, SO17 1BJ, UK
2University of Southampton Malaysia Campus, Nusajaya, 79200 Johor, Malaysia 3Montefiore Institute, University of Liège, Liège, Belgium
Correspondence to:Michael Kraft ([email protected])
Received: 20 September 2016 – Revised: 2 December 2016 – Accepted: 6 December 2016 – Published: 9 January 2017
Abstract. We report a new class of MEMS resonant potential sensor based on the mode localization effect using a 3-degree-of-freedom (DoF) electrically weakly coupled resonator system. As opposed to previously reported electrically coupled 2DoF mode-localized resonant sensors, it can be shown in theory that the 3DoF structure has an improved sensitivity without sacrificing signal transduction, in addition to a reduced nonideal effect with regard to the vibration amplitudes and the motional currents. Experimentally, it has also been shown that several orders of magnitude higher sensitivity can be achieved compared to frequency shift and 2DoF mode-localized sensor. In the best case, we are able to demonstrate over 4 orders of magnitude improvement in sensitivity compared to frequency shift as an output signal. Compared to current state-of-the art 2DoF mode-localized sensor, the highest sensitivity improvement is over 123 times. An estimation of the noise floor of the sensor is 614 µV/
√
Hz for potential sensing, or an equivalent 57.6e/ √
Hz for charge sensing, and a dynamic range of 66.3 dB can be achieved. Furthermore, two different approaches for detection were investigated, perturbing the stiffness in the form of either an axial electrostatic force or a change in electrostatic spring. We were able to demonstrate that the approach of changing electrostatic spring is more sensitive than its counterpart.
1 Introduction
The detection of electrical potential is of significant interest in surface potential distribution characterizations (Nonnen-macher et al., 1991) and biological (Sinensky and Belcher, 2007) and chemical analysis (Gao and Cai, 2009). Electrom-eters (Lee et al., 2008) are another application for potential sensing devices, which can be employed for particulate mat-ter detection (Jaramillo et al., 2013). MEMS resonant devices have been widely used for these applications with the advan-tage of high resolution and a large dynamic range.
Recently, mode-localized MEMS resonant sensors have emerged as an alternative resonant sensing scheme (Thiru-venkatanathan et al., 2009; Zhao et al., 2015b), in which the mode shape of a weakly coupled resonator system changes subject to an external stiffness perturbation caused by the electrical potential change. Orders of magnitude improve-ment in sensitivity for electrometers (Thiruvenkatanathan
et al., 2010a; Zhang et al., 2016a) have already been re-ported. Furthermore, mode-localized sensors exhibit bet-ter common-mode rejection capability (Thiruvenkatanathan et al., 2010b). Previously, mode-localized sensors were im-plemented with two resonators weakly coupled electrically (Thiruvenkatanathan et al., 2011) or mechanically (Spletzer et al., 2006; Zhang et al., 2016b), with the electrical coupling element offering advantages of tunability of the sensitivity (Manav et al., 2014).
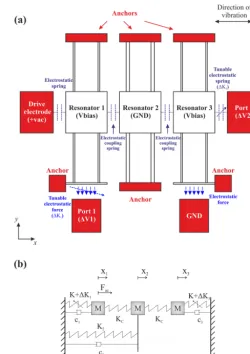
Figure 1.(a)Schematics of the 3DoF mode-localized potential sen-sor, showing three resonators coupled electrostatically with their neighbours. In addition, electrostatic springs and forces caused by electrical potential differences are also shown; (b) the linearized spring–mass–damper model of the 3DoF mode-localized potential sensor.
the alleviation of the electrical nonlinear driving force, as well as the nonideal sensing current. Furthermore, in terms of potential sensing applications, two sensing methods exist: (i) modulating the electrostatic spring and (ii) directly ap-plying an axial electrostatic force. However, the two sensing methods were not directly compared previously. In this work, we are able to demonstrate that, by modulating the electro-static spring, an improvement in sensitivity can be observed. The paper is arranged as follows: in Sect. 2, the advantages of the 3DoF structure design are discussed; in Sect. 3, the two potential sensing schemes by applying a DC potential to different ports are discussed; in Sect. 4, experimental results are presented and the paper is concluded in Sect. 5.
2 Advantages of the 3DoF structure with electrical coupling
The schematic of the 3DoF mode-localized MEMS resonant potential sensor is shown in Fig. 1. Each resonator has four suspension beams acting as springs and a relatively large proof mass to reduce the effect of fabrication tolerances to the mass. In addition, resonators 1 and 3 have a tether struc-ture that is capable of translating an axial electrostatic force to the suspension beams. Electrical coupling was chosen due to the ability to tune the coupling strength and thus the sen-sitivity of the sensor to external perturbations. A DC voltage Vbiaswas applied to resonators 1 and 3, while resonator 2 was connected to ground. The voltage difference created electro-static springs to couple the resonators to its neighbouring counterparts. An AC drive voltage is applied on the drive electrode, generating the actuation force. Details of the de-sign and its fabrication process were reported in Zhao et al. (2016). However, due to the limited scope of the previous work, the advantages of the design were not discussed in full detail; these are presented in the following sections.
2.1 Sensitivity improvement
As reported in Zhao et al. (2015b), the sensitivity to stiff-ness changes of a 3DoF mode-localized resonant sensor can be expressed by, assuming linear springs,K2>2K and K/Kc>10:
S3DoF=
∂(Amplitude ratio) ∂(1K/K)
=K(K2−K+Kc) K2
c
, (1)
whereK,K2andKc denote the stiffness of the suspension beam of resonator 1 (and 3), resonator 2 and the coupling spring, respectively. Moreover, the sensitivity of a 2DoF mode-localized resonant sensor can be expressed by Thiru-venkatanathan (2010):
S2DoF=
∂(Amplitude ratio) ∂(1K/K)
=
K 2Kc
. (2)
For identical K/Kc, the sensitivity of the 3DoF mode-localized resonant sensor can be enhanced by a factor of
K2−K+Kc
Kc . Over 2 orders of magnitude improvement has
al-ready been demonstrated (Zhao et al., 2016).
2.2 Sensitivity improvement without sacrificing signal transduction
The electrostatic coupling Kc for a parallel plate config-uration as shown in Fig. 1 can be expressed by Thiru-venkatanathan (2010):
Kc= − ε0AV2
d3 , (3)
plates, which is the determining factor of the coupling strength for a given design. Therefore, for a 2DoF mode-localized resonant sensor, decreasingV, and thusKc, is ben-eficial for sensitivity enhancement. On the other hand, a high V is often desirable due to the required motional current level for a reasonable signal-to-noise ratio in the readout circuit.
This design contradiction for choosing an optimal V can be solved by adopting a 3DoF resonant sensor configuration. An additional third parameter, the effective spring constant of the middle resonatorK2, can be altered to maintain or even improve the sensitivity without sacrificing the readout signal level. As shown in Eq. (1), increasing K2 can improve the sensitivity.
2.3 Electrostatic nonlinearity reduction
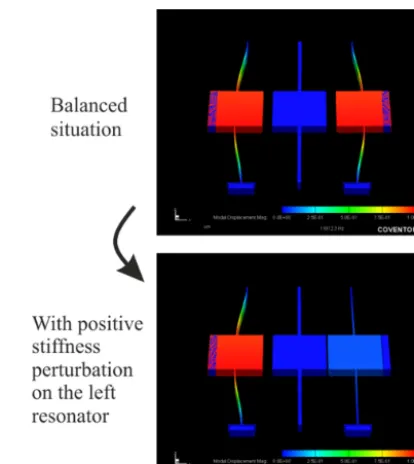
For an ideal 3DoF mode-localized resonant sensor with iden-tical resonators 1 and 3 and negligible damping, there are three fundamental modes of vibration (Nguyen, 1999): in the first mode, all three resonators vibrate in phase with each other; in the second mode, resonators 1 and 3 vibrate out of phase, whereas resonator 2 is statutory; in the third mode, each resonator vibrates out of phase with its neighbours, and resonators 1 and 3 are in phase. The second mode, which is referred to as out-of-phase mode, is the focus of this study. The balanced and perturbed mode shapes of the out-of-phase mode of a 3DoF resonant structure are illustrated in Fig. 2.
When a stiffness perturbation is introduced, resonator 2 starts to vibrate due to mode localization. However, in the case of weak coupling, the amplitude of resonator 2 is orders of magnitude lower than the resonator with highest amplitude (e.g. resonator 1) (Zhao et al., 2015a). This can also be seen qualitatively from Fig. 2.
Consider an abstract model of the drive electrode, res-onator 1 and resres-onator 2 as shown in Fig. 3. Only resres-onator 1 is considered because, under normal operating conditions, resonator 1 has a higher amplitude than resonator 3, mean-ing that it is more susceptible to nonlinear effects, as will be shown in Sect. 4.
AssumingvacVbiasand neglecting nonlinear terms with orders higher than 3, the total electrostatic force exerted on resonator 1 can be approximated by
Ftotal,elec≈ηA,Pvacsinωt+
ε0Vbias2 A d3 X1
+ε0V
2 biasA
d3 (X1−X2)
−3ε0V
2 biasA 2d4 [X
2
1−(X1−X2)2]
+2ε0V
2 biasA d5 [X
3
1+(X1−X2)3]. (4)
For a 3DoF mode-localized sensor withX2X1, or quasi-staticmotion of resonator 2, the second-order nonlinear term of the electrostatic actuation (i.e. between drive electrode
Figure 2.Illustration of the mode shapes of the out-of-phase mode of a representative 3DoF resonant structure, simulated using Coven-torWare FEM tool: (top) without perturbations and (bottom) with stiffness perturbations. The perturbation in the bottom panel is a positive stiffness perturbation applied to resonator 1. It should be pointed out that the same mode shape is generated given an identi-cal negative stiffness perturbation applied to resonator 3.
Figure 3.Abstract model of the drive electrode, resonator 1 and resonator 2 illustrated as parallel plates.X1 andX2are the dis-placement of resonator 1 and resonator 2, respectively. The cross-sectional areaAand gapdare supposed to be identical for all elec-trodes considered.
and resonator 1) cancels out that of the electrostatic cou-pling (i.e. between resonators 1 and 2), therefore rendering the total second-order electrostatic nonlinearity negligible. Thus the overall nonlinearity is reduced. This is often desir-able for resonator design, leaving only the third-order elec-trostatic nonlinearity which, in turn, can be used to elimi-nate the third-order mechanical nonlinearity intrinsic to the vibrating beams (Shao et al., 2008).
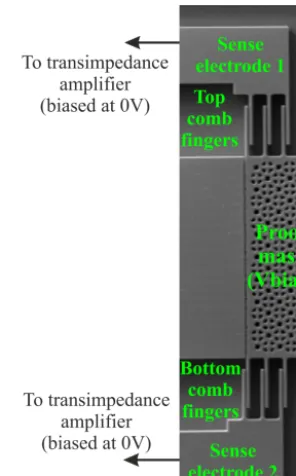
Figure 4.An SEM image of one pair of comb fingers attached to the proof mass of resonator 1 for vibration motion sensing. (As shown in Fig. 5c, another pair of comb fingers with identical configuration is also attached to the proof mass of resonator 3.) The top and bot-tom sets of the comb fingers on the proof mass are reversely config-ured relative to the stationary sense electrodes 1 and 2; this enables differential sensing. Therefore, a reduction in nonideal sense current components is achieved by common-mode rejection.
the total nonlinearity is higher than that of a 3DoF mode-localized resonant sensor.
2.4 Reduction of nonideal sense current components Due to the amplitude detecting method used in a mode-localized sensor, it is important to obtain a measure of the linear motion of the resonators with high accuracy. From the structure design perspective, it is desirable to use differen-tial sensing to cancel out the common-mode second-order nonlinearity while doubling the magnitude of the first-order term. This is shown in Fig. 4. In addition to the second-order nonlinear term of the motional current, another common-mode nonideal current component, the feed-through current (Lee and Seshia, 2009), can also be cancelled out.
3 Potential sensing methods
Using two different approaches, we investigated the appli-cation of the device to detect a DC electrical potential ap-plied to either “port 1” or “port 2”, as illustrated in Fig. 1a. When a DC potential is applied to port 1, an axial electro-static force change is created, modulating the stress in the suspension beams and thus leading to a stiffness
perturba-tion of resonator 1. Alternatively, when a DC potential is ap-plied to port 2, a change in the electrostatic spring, instead of an electrostatic force, modulates the spring softening ef-fect compared to the case in which no potential is applied; this is equivalent to introducing a stiffness perturbation to resonator 3.
3.1 Potential detection using port 1
The stiffness perturbation of resonator 1,1K1, as a function of an applied potentialV1to port 1, can be expressed as (Zhao et al., 2015b)
1K1=
1.2ε0A1(−2VbiasV1+V12)
d12L , (5)
whereε0 is the dielectric constant of free space. Typically, to initially avoid mode aliasing, a negative stiffness pertur-bation,Kp<0, created by a constant voltageVp on port 2 is introduced (Zhao et al., 2015b). With an appliedKp, the sensing mechanism in response to a stiffness perturbation caused by the potential change is explained below. Assum-ing|1K1| |Kp|, based on a transfer function model of the 3DoF weakly coupled resonators device described in Zhao et al. (2015b), the mode frequencies of interest can be calcu-lated as
ω≈ v u u u u t
K0+Kc+12 1K0−2K
0
γ ±
r
1K02+2K0
γ
2!
M , (6)
whereK0=K+1K1,1K0=1K1−Kp,γ=K(K2−KK2+Kc) c
,
M is the effective mass of each of all three resonators, K is the stiffness of resonators 1 and 3,K2 is the stiffness of resonator 2 andKc= −
ε0AVbias2
d3 is the electrostatic coupling
stiffness between neighbouring resonators. The positive and negative sign is for the out-of-phase and in-phase mode, re-spectively.
From Eq. (6), it can be derived that the out-of-phase mode has a more significant response subject to a stiffness per-turbation. Also, assuming V1Vbias and weak coupling, KcK, we can find an expression of the sensitivity for fre-quency shift as an output signal,Sf,1, with respect toV1:
Sf,1= ∂
1f f
∂(1K)
∂(1K) ∂(V1) ≈ −
1.2ε0A1Vbias
d12LK . (7)
It can be seen that Eq. (7) is similar to a conventional single DoF resonant sensor with frequency shift as an output signal (Schmidt and Howe, 1987), allowing a direct comparison to using amplitude ratio as an output signal.
assumption of weak coupling as elaborated in Zhao et al. (2016), andV1Vbias:
SAR,1= (8)
∂
X1(j ωop)
X3(j ωop)
∂(1K)
∂(1K) ∂(V1)
≈ −2.4A1(K2−K+Kc)d
4
ε0LA2Vbias3 ,
whereLis the length of the suspension beams, andAi and
diare the overlapping cross-sectional area and the gap of the
parallel plate for theith potential port (i=1 and 2), respec-tively;Aanddare the cross-sectional area and the gap of the electrodes for the electrostatic coupling, respectively.
It can be seen that the improvement in sensitivity is 2γ. For weak coupling Kc< K/10< K2/20, the improvement is at least 2 orders of magnitude (Zhao et al., 2016).
3.2 Potential detection using port 2
For a potential applied to port 2,V2Vbias, cancelling the common term to both resonators 1 and 3 proportional to Vbias2 , the stiffness perturbation of resonator 3 can be approx-imated as a linear function ofV2:
1K3≈
2ε0A2VbiasV2
d23 . (9)
For |1K3| |Kp|, the in-phase mode frequency has a stronger response (Zhao et al., 2015a). The sensitivity for the in-phase mode frequency shift, as well as the amplitude ratio as an output signal, can be approximated by
Sf,2= ∂ 1f f
∂(1K)
∂(1K) ∂(V2)
≈ε0A2Vbias
d22LK (10)
SAR,2=
∂
X1(j ωop) X3(j ωop)
∂(1K) ∂(1K) ∂(V2)
≈ −2A2(K2−K+Kc)d
3
ε0A2Vbias3
. (11)
It should be noted that the length of the suspension beams is 350 µm, while the capacitive gap is 4.5 µm. Consequently, for the dimensions of this device, 1K1 is around 2 orders of magnitude lower than1K3. Therefore, applying the po-tential to port 2 should induce a more significant stiffness perturbation, hence a higher output signal.
4 Experimental results and discussion
4.1 Device description
The device was fabricated by a single-mask SOI-based pro-cess with details described in Chang et al. (2011), Xie et al. (2013) and Hao et al. (2016), which achieved a good anti-stiction capability through selective roughening on the bot-tom side of the device layer using the notching effect. The design of the device is elaborated elsewhere (Zhao et al., 2016). Some key parameters areL=350 µm,d1=d2=d=
4.5 µm,A1=160×22 (µm)2andA2=A=360×22 (µm)2. The SEM image of the fabricated device is shown in Fig. 5a, with zoom-in images showing port 1 (Fig. 5b) and port 2 (Fig. 5c). In the experiment, the input impedance is domi-nated by the capacitances, approximately 7fF and 15fF for port 1 and port 2, respectively.
4.2 Experimental results 4.2.1 Frequency response
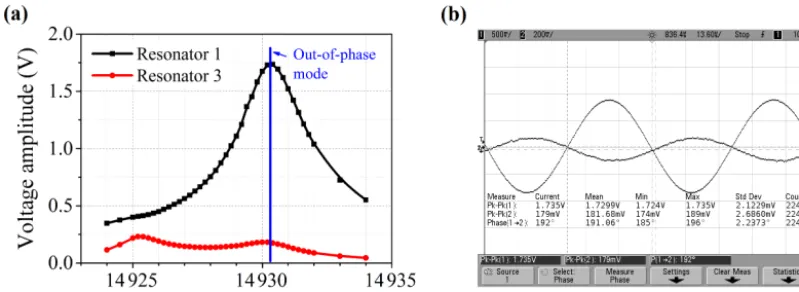
The electrical characterization of the device was performed under a pressure of 20 µTorr to improve the quality factor of the resonators; aQfactor of 6221 was achieved. To set the initial operating point of the sensor so that the mode alias-ing effect can be avoided (Zhao et al., 2015b), a constant DC voltageVp=4.15 V was applied to port 2 and maintained during the experiment. An AC signal with a peak–peak am-plitude of 20 mV was used to drive the resonators into oscil-lation for a bias voltage ofVbias=30 V. The motional cur-rents of resonators 1 and 3 were converted to voltage and further amplified using an interface electronics board and recorded on an oscilloscope. The drive frequency was swept from 14 924 to 14 934 Hz manually to obtain the frequency response curve shown in Fig. 6a.
It can be seen from the frequency response that the res-onator can be regarded as working in the linear regime at the out-of-phase mode frequency. Using a transimpedance gain of 6.6 M, voltage gain of 200 V V−1and transduction fac-tor of 6.05×10⁻⁸VF m−1, the vibrational amplitude can be estimated as 115 nm.
4.2.2 Potential sensitivity characterization
AC voltages were applied to the drive electrode to actuate the 3DoF system at the desired mode frequency in the linear region for different DC bias voltages.
In the first experiment, potential port 2 was maintained at the aforementioned constant DC voltageVpfor a particular Vbias. We then applied varying DC potentials (both positive and negative) to port 1 and measured the averaged ampli-tudes of resonators 1 and 3 using an oscilloscope to calculate the amplitude ratio. The same experiment was repeated for Vbias=30, 34.5 and 40 V. The measured amplitude ratio as a function of the potential applied is plotted in Fig. 7a. Also shown is the out-of-phase mode frequency shift, normalized to the frequency whenV1=0, as a function of a potential ap-plied to port 1 forVbias=30 V. The in-phase mode frequency shift was orders of magnitude less pronounced. Therefore it is not shown.
Figure 5.Scanning electron micrograph (SEM) showing(a)the 3DoF MEMS mode-localized resonant sensor;(b)the structure for potential detection at potential port 1;(c)the structure for potential detection at potential port 2.
Figure 6.The responses of the 3DoF mode-localized resonant sensor with a driving voltage of 20 mV andVbias=30 V:(a)the frequency re-sponse of the sensor (the voltage amplitude is the peak–peak amplitude);(b)measured steady-state time domain responses of the resonators 1 and 3 at the out-of-phase mode frequency.
shift forVbias=30, normalized to that ofV2=0, is also plot-ted in Fig. 7b.
For a potential within a range of−5 V< V <5 V (where V Vbiascan be considered as valid), we can extract a lin-ear sensitivity, as given in Table 1. It can be cllin-early seen that when using the sensor as a mode-localized sensor, using am-plitude ratio as the output signal (with sensitivitySAR), there is at least 4 orders of magnitude improvement compared to frequency shift as an output (with sensitivity Sf). This is
valid for both ports 1 and 2. ComparingSAR,1toSAR,2, it is also apparent thatSAR,2has over 2 orders of magnitude im-provement in sensitivity for anyVbias. This suggests that us-ing port 2 is superior in terms of potential sensitivity. Another observation is that the smallerVbias, the higher the sensitiv-ity. This is also predicted in theory by Eqs. (8) and (11). This will be helpful for biomedical applications where a low volt-age is preferred. However, it should be pointed out that even though further reduction of the bias voltage is beneficial for the sensitivity, it also results in a reduction of full scale and thus dynamic range, due to the mode aliasing effect (Zhao et al., 2015b). For instance, when port 2 was used, the full scale was reduced from 7.3 to 4 V whenVbiaswas decreased from 40 to 30 V. Nevertheless, the maximum sensitivity im-provement compared to a current state-of-the-art potential
sensor (Zhang et al., 2016a), which has been employed as an electrometer having a linear sensitivity of 0.083/V, is 123.6 times.
Using the noise estimation approach described in Zhao et al. (2015b), the noise floor of the amplitude ratio was regarded as white and derived to be 6.30×10⁻³/
√
Hz for Vbias=30 V. For port 1, the noise floor for the potential de-tection is approximately 73.3 mV/
√
Hz. If port 2 is used, the performance is superior. The noise floor for the poten-tial sensor is estimated as 614 µV/
√
Hz. If a measurement bandwidth of 10 Hz is assumed (after Lassagne et al., 2008), a dynamic range of 66.3 dB can be achieved. In addition, the linear fit R2 value for Vbias=30 V for full scale is 0.999, suggesting a very linear response of the sensor. The domi-nant source of noise is the interface electronics (Zhao et al., 2015b), which should be optimized to improve the perfor-mance of the sensor further.
4.2.3 Equivalent charge detection
Figure 7.Graphs showing(a)measured amplitude ratio as a function of potential applied to port 1 for differentVbias, with inset showing measured normalized out-of-phase mode frequency shift forVbias=30 V;(b)measured amplitude ratio as a function of potential applied to port 2 for differentVbias, with inset showing measured normalized in-phase mode frequency shift forVbias=30 V.
Table 1.Summary of potential sensitivity.
Coupling Port 1 Port 2 voltage SAR,1(/V) Sf,1(/V) SAR,2(/V) Sf,2(/V)
30 V −0.086 −4.28×10⁻⁶ −10.26 3.57×10⁻⁴ 34.5 V −0.065 NA −8.47 NA
40 V −0.032 NA −6.26 NA
NA: not available.
For port 1, the motion of the resonator along the y axis direction (direction illustrated in Fig. 1) can be neglected. Therefore the parallel plate capacitance can be regarded as a constant 7fF. A resolution of 3205e/
√
Hz is estimated with Vbias=30 V.
On the other hand, due to the vibrating motion of res-onator 3 along thex axis, the capacitance is not of constant value. However, due to the low vibrating amplitude (less than 12.1 nm) within the operating range forVbias=30 V, the rel-ative variation of the charge due to the motion is less than 0.27 % for a gap of 4.5 µm. If the charge variations due to the motion are neglected, the equivalent charge detection reso-lution is estimated to be 57.6e/
√
Hz withC=15fF. This is an improvement of 2.5 times compared the state-of-the-art MEMS mode-localized electrometers at room temperature, which has a resolution of 147e/
√
Hz (Okamoto et al., 2011).
5 Conclusions
In this paper, we have demonstrated the design of a 3DoF weakly coupled resonant sensor for potential sensing appli-cations, which could also be extended to an electrometer. We have presented the design advantages for the 3DoF structure in theory, including sensitivity improvement, electrical non-linearity and nonideal current reduction. We have shown that, by using the device as a mode-localized sensor, the sensitiv-ity can be improved by over 4 orders of magnitude,
com-pared to conventional frequency shift as an output. In ad-dition, we have also compared the sensitivity of the mode-localized sensor for different bias voltages. We demonstrated that the lower the bias voltage, the higher the sensitivity. Fi-nally, we have shown two viable methods for sensing an elec-trical potential. The more sensitive approach is by applying the potential to port 2, where a change in electrostatic spring is used to perturb the stiffness. The best sensitivity improve-ment compared to the state-of-the-art mode-localized sensor is 123 times. If employed as an electrometer, the best resolu-tion can also be improved by 2.5 times compared to the state of the art.
6 Data availability
The data used in this paper can be found in the Supplement.
The Supplement related to this article is available online at doi:10.5194/jsss-6-1-2017-supplement.
Edited by: R. Kirchner
Reviewed by: two anonymous referees
References
Chang, H., Xie, J., Fu, Q., Shen, Q., and Yuan, W.: Micromachined inertial measurement unit fabricated by a SOI process with se-lective roughening under structures, IET Micro & Nano Letters, 6, 486–489, 2011.
Gao, P. and Cai, Y.: Label-free detection of the aptamer binding on protein patterns using Kelvin probe force microscopy (KPFM), Anal. Bioanal. Chem., 394, 207–214, 2009.
Jaramillo, G., Buffa, C., Li, M., Brechtel, F. J., Langfelder, G., and Horsley, D. A.: MEMS electrometer with femtoampere resolu-tion for aerosol particulate measurements, IEEE Sens. J., 13, 2993–3000, 2013.
Lassagne, B., Garcia-Sanchez, D., Aguasca, A., and Bachtold, A.: Ultrasensitive mass sensing with a nanotube electromechanical resonator, Nano Lett., 8, 3735–3738, 2008.
Lee, J. E.-Y., Bahreyni, B., and Seshia, A. A.: An axial strain mod-ulated double-ended tuning fork electrometer, Sensor. Actuat. A-Phys., 148, 395–400, doi:10.1016/j.sna.2008.09.010, 2008. Lee, J.-Y. and Seshia, A.: Parasitic feedthrough cancellation
tech-niques for enhanced electrical characterization of electrostatic microresonators, Sensor. Actuat. A-Phys., 156, 36–42, 2009. Manav, M., Reynen, G., Sharma, M., Cretu, E., and Phani, A.:
Ultrasensitive resonant MEMS transducers with tuneable cou-pling, J. Micromech. Microeng., 24, 055005, doi:10.1088/0960-1317/24/5/055005, 2014.
Nguyen, C. T.: Frequency-selective MEMS for miniaturized low-power communication devices, IEEE T. Microw. Theory, 47, 1486–1503, 1999.
Nonnenmacher, M., O’Boyle, M., and Wickramasinghe, H.: Kelvin probe force microscopy, Appl. Phys. Lett., 58, 2921–2923, 1991. Okamoto, H., Kitajima, N., Onomitsu, K., Kometani, R., Wari-sawa, S.-I., Ishihara, S., and Yamaguchi, H.: High-sensitivity charge detection using antisymmetric vibration in coupled micromechanical oscillators, Appl. Phys. Lett., 98, 014103, doi:10.1063/1.3541959, 2011.
Schmidt, M. A. and Howe, R. T.: Silicon Resonant Microsensors, in: 14th Automotive Materials Conference: Ceramic Engineering and Science Proceedings, 8, 1019–1034, Wiley Online Library, doi:10.1002/9780470320419.ch3, 1987.
Shao, L., Palaniapan, M., and Tan, W.: The nonlinearity cancellation phenomenon in micromechanical resonators, J. Micromech. Mi-croeng., 18, 065014, doi:10.1088/0960-1317/18/6/065014, 2008. Sinensky, A. K. and Belcher, A. M.: Label-free and high-resolution protein/DNA nanoarray analysis using Kelvin probe force mi-croscopy, Nat. Nanotechnol., 2, 653–659, 2007.
Spletzer, M., Raman, A., Wu, A. Q., Xu, X., and Reifen-berger, R.: Ultrasensitive mass sensing using mode localiza-tion in coupled microcantilevers, Appl. Phys. Lett., 88, 254102, doi:10.1063/1.2216889, 2006.
Thiruvenkatanathan, P.: Mode-localized sensing in micromechani-cal resonator arrays, PhD thesis, University of Cambridge, 2010. Thiruvenkatanathan, P., Yan, J., Woodhouse, J., and Seshia, A.: Enhancing parametric sensitivity in electrically coupled MEMS resonators, J. Microelectromech. S., 18, 1077–1086, doi:10.1109/JMEMS.2009.2025999, 2009.
Thiruvenkatanathan, P., Yan, J., and Seshia, A.: Ultrasensitive mode-localized micromechanical electrometer, in: Frequency Control Symposium (FCS), 2010 IEEE International, 91–96, IEEE, doi:10.1109/FREQ.2010.5556368, 2010a.
Thiruvenkatanathan, P., Yan, J., and Seshia, A. A.: Differen-tial amplification of structural perturbations in weakly cou-pled MEMS resonators, IEEE T. Ultrason. Ferr., 57, 690–697, doi:10.1109/TUFFC.2010.1466, 2010b.
Thiruvenkatanathan, P., Woodhouse, J., Yan, J., and Seshia, A.: Ma-nipulating vibration energy confinement in electrically coupled microelectromechanical resonator arrays, J. Microelectromech. S., 20, 157–164, 2011.
Xie, J., Hao, Y., Shen, Q., Chang, H., and Yuan, W.: A dicing-free SOI process for MEMS devices based on the lag ef-fect, J. Micromech. Microeng., 23, 125033, doi:10.1088/0960-1317/23/12/125033, 2013.
Zhang, H., Huang, J., Yuan, W., and Chang, H.: A High-Sensitivity Micromechanical Electrometer Based on Mode Localization of Two Degree-of-Freedom Weakly Coupled Resonators, J. Micro-electromech. S., 25, 937–946, 2016a.
Zhang, H., Li, B., Yuan, W., Kraft, M., and Chang, H.: An ac-celeration sensing method based on the mode localization of weakly coupled resonators, J. Microelectromech. S., 25, 286– 296, 2016b.
Zhao, C., Wood, G., Xie, J., Chang, H., Pu, S., and Kraft, M.: Comparative study of different output metrics for a three weakly coupled resonator sensor, in: Solid-State Sen-sors, Actuators and Microsystems (TRANSDUCERS), 2015 Transducers-2015 18th International Conference on, 2196– 2199, IEEE, doi:10.1109/TRANSDUCERS.2015.7181396, 21– 25 June 2015a.
Zhao, C., Wood, G. S., Xie, J., Chang, H., Pu, S. H., and Kraft, M.: A force sensor based on three weakly coupled resonators with ultrahigh sensitivity, Sensor. Actuat. A-Phys., 232, 151– 162, doi:10.1016/j.sna.2015.05.011, 2015b.