Quality by Design (QbD) based process
optimisation to develop functionalised
particles with modified release properties
using novel dry particle coating technique
Eman Z. Dahmash, Ali Al-khattawiID*, Affiong Iyire, Hamad Al-Yami, Thomas J. Dennison, Afzal R. Mohammed*
Aston School of Pharmacy, Aston University, Birmingham, United Kingdom
*[email protected](ARM);[email protected](AA)
Abstract
Quality by Design (QbD), a current trend employed to develop and optimise various critical pharmaceutical processes, is a systematic approach based on the ethos that quality should be designed into the product itself, not just end tested after manufacture. The present work details a step-wise application of QbD principles to optimise process parameters for produc-tion of particles with modified funcproduc-tionalities, using dry particle coating technology. Initial risk assessment identified speed, air pressure, processing time and batch size (independent factors) as having high-to-medium impact on the dry coating process. A design of experi-ments (DOE) using MODDE software employed a D-optimal design to determine the effect of variations in these factors on identified responses (content uniformity, dissolution rate, particle size and intensity of Fourier transform infrared (FTIR) C = O spectrum). Results showed that batch size had the most significant effect on dissolution rate, particle size and FTIR; with an increase in batch size enhancing dissolution rate, decreasing particle size (depicting absence of coated particles) and increasing the FTIR intensity. While content uni-formity was affected by various interaction terms, with speed and batch size having the high-est negative effect. Optimal design space for producing functionalised particles with optimal properties required maximum air pressure (40psi), low batch size (6g), speed between 850 to 1500 rpm and processing times between 15 to 60 minutes. The validity and predictive ability of the revised model demonstrated reliability for all experiments. Overall, QbD was demonstrated to provide an expedient and cost effective tool for developing and optimising processes in the pharmaceutical industry.
Introduction
Quality in the pharmaceutical industry has traditionally been assured via quality by testing (QbT), where failure results in whole batches being discarded at significant cost. In this approach, a lack of understanding of the critical process parameters (CPPs) renders manufacturing issues difficult to diagnose and can lead to substantial losses [1,2]. Alterna-tively, quality by design (QbD) provides a unique opportunity for the pharmaceutical industry a1111111111 a1111111111 a1111111111 a1111111111 a1111111111 OPEN ACCESS
Citation: Dahmash EZ, khattawi A, Iyire A,
Al-Yami H, Dennison TJ, Mohammed AR (2018) Quality by Design (QbD) based process optimisation to develop functionalised particles with modified release properties using novel dry particle coating technique. PLoS ONE 13(11): e0206651.https://doi.org/10.1371/journal. pone.0206651
Editor: Anne C. Moore, University College Cork,
IRELAND
Received: July 26, 2017
Accepted: October 17, 2018
Published: November 1, 2018
Copyright:©2018 Dahmash et al. This is an open access article distributed under the terms of the
Creative Commons Attribution License, which permits unrestricted use, distribution, and reproduction in any medium, provided the original author and source are credited.
Data Availability Statement: All relevant data are
within the paper and its Supporting Information files.
Funding: The work was funded by Aston University
to dramatically enhance product quality via utilising a systematic risk based approach [3]. This can offer significant advantages over QbT via allowing control of the manufacturing process to ensure consistent production of a quality product, without the need of extensive quality testing [4]. The use of QbD is becoming an integral part of the development and optimisation of novel manufacturing processes as the industry and regulatory authorities move together towards an agile system for pharmaceutical product development.
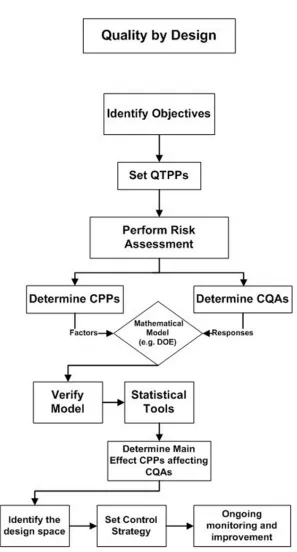
QbD provides a step-wise approach for process optimisation with elements that once estab-lished, will help product features to be recognized and origins of inconsistency identified [5]. An outline of this approach is depicted inFig 1. Briefly, the quality target product profile (QTPP) must first be defined and inclusive of requirements for quality, safety and efficacy. These form the basis for product design and should be reproduced constantly to deliver the intended benefits [3,6,7]. Subsequently, risk management, as detailed in ICH Q9, is applied to identify CPPs in a product’s manufacturing process that directly impact the product’s critical quality attributes (CQAs). The latter could comprise the physical, chemical, biological or microbiological features/specifications that are required in a suitable limit to achieve desired product quality [7,8]. Using risk-assessment tools, CPPs and CQAs are determined for inclu-sion and investigation via design of experiment (DOE) studies. DOE is a tool by which systems and processes can be investigated to give an understanding of the main and interaction effects of various CPPs and provide flexibility by predicting the extent of these interactions [9,10].
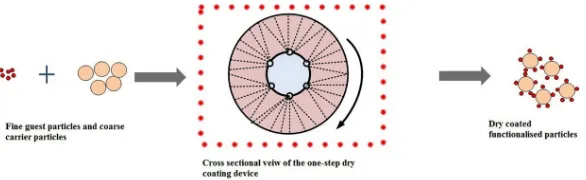
A process that benefits from optimisation via a QbD approach is dry particle coating. This novel process enables the production of functionalised modified release particles (FP). It involves fine particles (guest, e.g. drug that requires modification of release kinetics) adherence on to the surface of coarse particles (carrier) through the application of high mechanical and impaction forces without the use of heat or solvents (Fig 2) [11–16]. In the process, the attrac-tion of guest to carrier particles is based on van der Waals forces, electrostatic forces and hydrogen bonding [17,18]. Dry coating requires initial de-agglomeration of the cohesive guest particles into primary particles prior to coating the carrier. The equipment was designed to supply sufficient G-force (force of acceleration of an object) from a rotating drum coupled with high nitrogen gas flow essential to break agglomerates and promote proximity between the guest and the carrier particles. However, the cohesive nature of fine guest particles results in difficulty to disperse them and therefore, obtaining a uniform mix is challenging [19]. A plethora of factors in the dry coating process may contribute to the optimum product perfor-mance including blending speed, time, air flow rate and batch size. Elucidating the effect of the individual process variables as well as their interactions, therefore, is crucial to facilitate the development of future products using this technique.
This paper aims to optimise the process parameters of a dry particle coating technology via applying a step-wise QbD approach. Specifically, the work is comprised of screening studies to generate initial understanding of the process variables that influence the operation of the tech-nique and development of functionalised particles with modified release properties. These studies were focused mainly on assessing powder homogeneity/content uniformity, release profile using dissolution studies and the extent of interaction between the guest and carrier particles via particle size analysis and FTIR techniques. Risk assessment was then performed following both compendial and initial screening studies to identify CPPs that have the highest impact on CQAs. Those were subsequently incorporated into an optimisation DOE study based on a four-factor, multi-level quantitative D-optimal design plan. Response surface model (RSM) was applied in this study to evaluate the effect of varying interactive terms among CPPs (processing speed, time, airflow and batch size) on four CQAs (drug release, blend homogeneity and degree of attraction of guest to carrier particles). Finally the model was utilised to establish the design space of the process.
Research grant from Saudi Arabian Government, in particular Najran University for Hamad Al-Yami. The funders played no role in study design, data collection and analysis, decision to publish, or preparation of the manuscript.
Competing interests: The authors have declared
Materials and methods
Materials
Ibuprofen was purchased from Discovery Fine Chemicals (Dorset, UK), whereas microcrystalline cellulose (MCC) Avicel PH-200 was donated by FMC BioPolymer Europe (Brussels, Belgium).
Fig 1. Flow chart outlining the elements of QbD (QTPP: Quality targeted product profile, CPPs: Critical process parameters, CQAs: Critical quality attributes, DOE: Design of experiments).
Methods
Preparation of FP using dry particle coating process. FP were produced using a dry
par-ticle coating process, where a model binary mix comprising of ibuprofen fine guest parpar-ticles and MCC as coarse model insoluble carrier was chosen. The required particle size ranges were obtained by sieving. MCC particle size was 180–250μm and ibuprofen particle size was 38– 53μm (collecting the fraction of powder retained above sieve with pore size 38μm and below sieve with pore size 53μm). Both the carrier and the guest materials (10% w/w guest concen-tration, 5g) were added to the dry particle coating device chamber, (prototype developed by the research group at Aston University, UK) as shown inFig 2. The mixing process parameters in terms of speed, processing time and nitrogen gas pressure for the optimisation study was carried out according the parameters set by the MODDE design worksheet. At the end of each run, resultant powder was collected into a glass container and assayed for dissolution profile, content uniformity, particle size distribution and Fourier Transform Infrared (FTIR). For screening experiments, the resultant composite powders were tested against physical mixtures (control) made of the same components that were mixed manually in a 30mL glass vial with cap for 5 minutes (manual vigorous shaking).
Dissolution studies. Dissolution studies were carried out according to the USP apparatus
I compendia basket method [20]. Sample size was an equivalent of 100 mg of ibuprofen (1 g of the blend). The amount of the released ibuprofen was determined by UV spectrophotometry set at wavelength of 272 nm (Jenway 6305, Staffordshire, UK). All experiments were performed in triplicates.
Content uniformity. Samples of the blend containing an equivalent of 50 mg of ibuprofen
were accurately weighed, added to a flask and dissolved in 100 ml of phosphate buffer (pH 7.2). Ibuprofen content was assessed using UV spectrophotometry at 272nm. The degree of homogeneity of the mixture was measured by the relative standard deviation (RSD) usingEq 1
[21].
RSD¼
ffiffiffiffiffiffiffiffiffiffiffiffiffiffiffiffiffiffiffiffiffi Pn
i¼1
ðxi �xÞ2 n 1
q
�
x Eqð1Þ
Wherexiisthe ibuprofen content in percentage in the sample,x�is the average concentra-tion over all samples andnis the number of samples. All samples were made in triplicates.
Particle size analysis (PSA). PSA was carried out using laser diffraction particle size
ana-lyser Sympatec HELOS (Helium–Neon Laser Optical System/ RODOS). A3 lenses were employed with working range of 0.5–175μm. The equipment disperses particles into their pri-mary component using dry disperser (RODOS) with compressed air set at 3 bars. 1 g was placed over the feeding tray of VIBRI, which in turn transferred the sample into RODOS.
Fig 2. Schematic showing dry coating process and device. Fine agglomerated guest particles and coarse carrier
particles are added to the high G-force processing vessel coupled with nitrogen gas flow to produce dry coated FP in a one step process.
Parameters like volume mean diameter (VMD) (average diameter of the particles that has the same volume), X10, X50and X90were obtained. The X10X50and X90values represent the
parti-cle dimension corresponding to 10%, 50% and 90% of the blend in the cumulative undersize distribution respectively. All samples were performed in triplicate.
Fourier transform infrared (FTIR). FTIR spectra were recorded on solid samples using
Thermo Scientific Nicolet iS5 FTIR spectrometer (Hertfordshire, UK), coupled with Thermo Scientific OMNIC software (Nicolet, Madison, WI) to operate and treat FTIR spectra. Samples of approximately 10–20 mg were loaded on the iD5 ATR Diamond sample holder and tripli-cate scans were obtained over the range of 500–4000 cm-1with a resolution of 2 cm-1.
Statistical analysis. Statistical comparison in screening studies for dissolution profiles for
various formulations was done using t-test (two-tails) whereas; comparisons between several profiles were carried out using two-way analysis of variance (ANOVA). All studies were car-ried out in triplicate and the mean with standard deviation was reported throughout screening experiments.
Elements of QbD. CQAs were identified based on the initial screening studies and
litera-ture review. Risk assessment was then employed during development to identify possibly high risk input and process parameters to conclude the required variables that would be investi-gated. Risk ranking was determined based on the screening studies, current knowledge and the ICH Q9 risk management guidelines [8]. The CPPs were assessed against CQAs using risk assessment tool. For each input and process attribute a risk rank was made based on the impact on the final product quality. Identification of CQAs of the final product were determined also according to risk assessment anticipating a failure of the product if CQAs were not met. Risk ranking was categorised as low, medium and high. Risks ranked as low were not included as independent factor, while those with medium and high risk rank were considered as indepen-dent factors and used in the DOE study [6,8].
Design of experiment (DOE). DOE was statistically designed using MODDE software
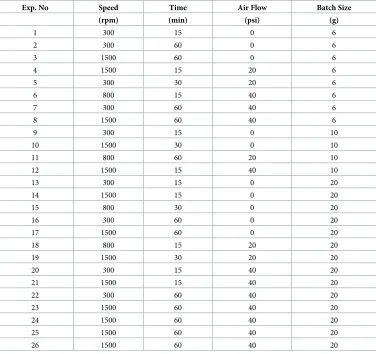
version 8.2 (Umetrics Inc., NJ, USA). A D-optimal design was selected to account for the asymmetry in the settings of critical process parameters, namely process speed and airflow. The asymmetric nature of the selected D-optimal design suggests that sometimes reproducibil-ity (i.e. variation of response under the same conditions, pure error) could be tested at levels other than middle values [10]. Hence reproducibility runs were set at the high level values by the software. The chance for error during the model design was minimized through ensuring that both G-efficiency (measure of model efficiency) and condition number (measure of model sphericity) were at their optimal levels of 85.15% (recommended>60–70%) and 10.55 respectively [22]. The model was quadratic polynomial fitted using partial least squares (PLS) method. Response surface modelling (RSM) was applied to estimate the non-linear multidi-mensional relationship between the independent factors and CQAs. To fit the quadratic model with D-optimal design, 26 runs were generated of which four of these were replicated to esti-mate the pure error for the study (Table 1). The randomization of the order of the experiments was carried out. Further,Table 2summarises the independent factors used in the design.
DOE model analysis. After model fitting, model verification was carried out to ensure its
validity and reproducibility through sequential elimination of the insignificant runs using distance to model plots while evaluating the effect of the elimination on the model using lack of fit plots. Furthermore, the model terms were reviewed individually and those with no statistical signifi-cance were eliminated because their influence on the values of CQAs was negligibly small [10]. Two eliminations were carried out; the insignificant runs and the insignificant model terms.
while the model error or lack of fit was set at a value of bigger than 0.05 indicating the insignif-icance of the model error.
A statistical model comprising both interaction and polynomial terms was used to evaluate the responses and it was displayed according toEq 2for each response [10,23]:
y¼β0þβ1x1þβ2x2þβ3x3þβ11x 2 1þβ22x
2
2þβ12x1x2þβ13x1x3þβ23x2x3. . .þεEqð2Þ
Where (y) is the modelled response,B0is the arithmetic mean response of the runs;β1,β2,β3, β11,β22,β12,β13,β23are the estimated coefficients for the main effects (x1,x2,x3); the
polyno-mial terms (x12,x22) and the interaction terms (x1x2,x1x3andx2x3) respectively.εis a constant
Table 2. List of independent variables with their feasible investigational ranges that were used in optimisation DOEs.
Independent variable Level
High level Medium level Low level
Processing vessel speed (rpm) 1500 800 300
Processing time (min) 60 30 15
Air pressure (psi) 40 20 0
Batch Size (g) 20 10 6
https://doi.org/10.1371/journal.pone.0206651.t002
Table 1. The D-optimal design worksheet with CPPs and the total number of runs.
Exp. No Speed Time Air Flow Batch Size
(rpm) (min) (psi) (g)
1 300 15 0 6
2 300 60 0 6
3 1500 60 0 6
4 1500 15 20 6
5 300 30 20 6
6 800 15 40 6
7 300 60 40 6
8 1500 60 40 6
9 300 15 0 10
10 1500 30 0 10
11 800 60 20 10
12 1500 15 40 10
13 300 15 0 20
14 1500 15 0 20
15 800 30 0 20
16 300 60 0 20
17 1500 60 0 20
18 800 15 20 20
19 1500 30 20 20
20 300 15 40 20
21 1500 15 40 20
22 300 60 40 20
23 1500 60 40 20
24 1500 60 40 20
25 1500 60 40 20
26 1500 60 40 20
[24,25]. The final regression model equations were determined upon the evaluation of individ-ual terms and elimination of all insignificant terms. Once the model was significant, evaluation and prediction tools were used to identify the effect of individual or interaction CPPs on CQAs and the results used to predict design space.
Results and discussion
Initial screening studies targeted the identification of CPPs and CQAs that will be further opti-mised using QbD. Therefore, following the initial screening experiments, the tree diagram (Fig 1) served as a template for the development of an optimisation model for the dry particle coat-ing process. The study discusses the risk assessment (criticality) carried out for CPPs and CQAs followed by DOE model verification, ANOVA and main/interaction effects on CQAs. Finally, the prediction part where the design space meets the requirements of CQAs was set.
Screening studies
Ibuprofen was selected as a model active pharmaceutical ingredient (API) owing to its low sol-ubility (21 mg/L) and availability as a cohesive powder with small mean particle size [26]. MCC was chosen as model carrier particle as it is a widely-used excipient and is available in a range of particle sizes. Dry particle coating process requires an initial de-agglomeration of the cohesive powder’s guest particles into their primary particles via the application of external forces (convection, diffusion and shear forces), producing a homogenous blend. To obtain FP where the fine guest particles were attracted to the surface of the carrier, additional shear forces need to be introduced into the blending system using the dry coating device. MCC particles were dry coated with 10%w/w ibuprofen, followed by assessment of the blend for dissolution.
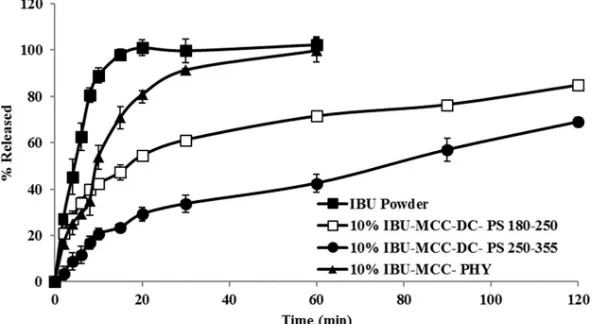
Fig 3shows the dissolution profile of the dry coated powder, physical mixture and ibuprofen powder. The results revealed a significant difference in the release profile (one way ANOVA, p<0.0001) between the dry coated powder and the physical mixture particularly after 15 min-utes. The physical mixture showed dissolution rate that was slower than that of the powder alone (more than 90% within 30 minutes), whereas the dry coated blend took 2 hours to reach 85% release. The initial fast dissolution of particles from the dry coated blend was possibly due to the existence of dispersed ibuprofen particles within the system that were not attached to
Fig 3. Comparison of dissolution profile of 10% w/w (▲) ibuprofen (IBU) with MCC physical mixture (PHY), dry coated particles (DC) with different carrier particle size (PS) (□) 180–250μm and (●) 250–355μm, and (■) ibuprofen (IBU) powder determined using USP Basket Method at 50 rpm measured in phosphate buffer pH 7.2 at 37˚C, (mean±SD, n = 3).
the carrier surface (i.e., non-adsorbed particles) which result in immediate dissolution due to the large surface area whereas the dry coated particles account for the sustained release pattern. The slow release from the dry coated blend compared to physical mixture, could be attributed to the strong adhesion of the ibuprofen particles to the insoluble carrier, whereas the release of ibuprofen from the physical mixture was similar to those of interactive mixture which showed higher dissolution rate than that of dry coated mixture [27–30].
Increasing the carrier particle size (250–355μm) resulted in further reduction in the release rate of ibuprofen. The efficiency of powder coating increased with the increase in the ratio between the carrier and guest particle size [17]. The dissolution data showed a statistically sig-nificant reduction in dissolution rate over the period of 2 hours compared to that of smaller car-rier particle size (180–250μm) (one-way ANOVA, p<0.0001). These results were consistent with previously reported results that the particle size of the guest and carrier plays a vital role in dry coating process. According to those studies, the attraction force between guest and carrier increases with the increase in the ratio between the size of guest to carrier particles [30–32].
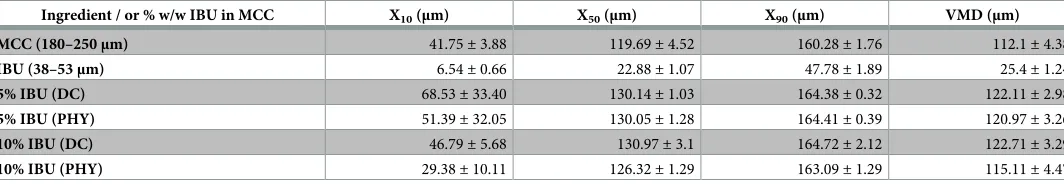
PSA results. The results of PSA as depicted inTable 3showed that the VMD for ibupro-fen was 25.4±1.24μm and median (X50) was 22.88±1.07μm. 90% of the ibuprofen particles
were below 47.78±1.89μm and hence the largest proportion of the powder mix was made of fine powder.
As for MCC with particle size ranging between 180–250μm obtained from sieving, laser diffraction particle size analyser results produced an incomplete distribution curve as the pow-der contained particles with size exceeding the 200μm limit (limitations of the equipment). However, this process was used to assess the fines within the powder and for MCC (180– 250μm) less than 10% of the powder had particle size smaller than 41.75±3.88μm. The laser diffraction method produces high air jet aided by compressed air that results in dispersion of the sample and therefore, it is expected that the agglomerates originating from fine powder were dispersed into primary particles and the percentage of fine is a true representation of non-dry coated drug particles. Similar results were reported [33].
On further characterisation of the powder mixtures for both dry coated and physical mix, the results of analyses demonstrated that dry coated mixtures with 5% w/w and 10% w/w ibu-profen load had less fines compared to physical mix indicating the adherence of ibuibu-profen fine powder onto the surface of MCC. The use of this test as a quick qualitative indication of the formation of coated particles was further investigated in the optimisation study.
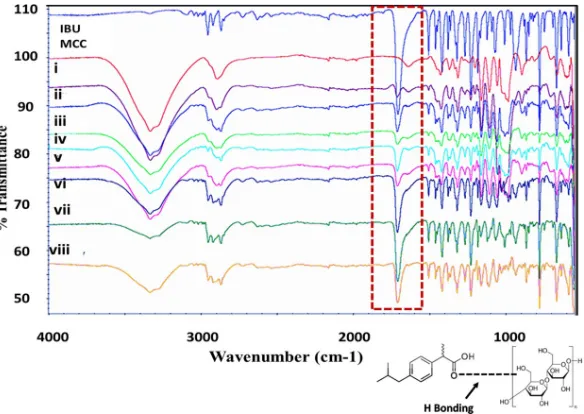
FTIR results. FTIR of ibuprofen powder showed absorption peaks that tally with the
fre-quencies of vibrations between the bonds within the molecule. The peak size in each spectrum is a direct indication of the amount of the material available within the sample. Further, hydro-gen bonding can be identified by studying the differences in the extent of absorbance [21]. The FTIR spectra of ibuprofen (Fig 4) shows band at 2954.24 cm−1which can be assigned to CH3
asymmetric stretching. Similarly, peaks with very high intensities were recorded at 1708.27
Table 3. Particle size distribution parameters for ibuprofen (IBU), MCC and the various mixtures (Dry coated (DC) and Physical (PHY)) using laser diffraction technique, (mean±SD, n = 3).
Ingredient / or % w/w IBU in MCC X10(μm) X50(μm) X90(μm) VMD (μm)
MCC (180–250μm) 41.75±3.88 119.69±4.52 160.28±1.76 112.1±4.38
IBU (38–53μm) 6.54±0.66 22.88±1.07 47.78±1.89 25.4±1.24
5% IBU (DC) 68.53±33.40 130.14±1.03 164.38±0.32 122.11±2.98
5% IBU (PHY) 51.39±32.05 130.05±1.28 164.41±0.39 120.97±3.26
10% IBU (DC) 46.79±5.68 130.97±3.1 164.72±2.12 122.71±3.29
10% IBU (PHY) 29.38±10.11 126.32±1.29 163.09±1.29 115.11±4.47
cm−1and 1230 cm−1owing to C = O stretching and C-C stretching respectively. Another band was observed at 779 cm−1which was attributed to CH2vibration. The above bands represent
the main bands providing the finger print for ibuprofen [34,35]. The FTIR spectra for MCC (Fig 4) showed two strong bands at 3301 cm-1and at 1644 cm-1corresponding to stretching and bending of the surface hydroxyl groups. An additional strong peak was shown at 2895 cm
-1
due to the asymmetric stretching vibration of C-H of the pyranoid ring [36,37].
The FTIR spectra of the dry coated particles and physical mixtures at various concentra-tions of ibuprofen ranging from 2%w/w to 20%w/w are depicted inFig 4. From the spectra, it can be noted that there was no change to the main peaks associated with ibuprofen or MCC with both dry coated and physical mixtures at all concentrations. The trough at wave number 1708 cm-1of ibuprofen that is attributed to C = O stretching was present in all mixtures and did not change its position. On the other hand, a reduction in the intensity in carbonyl band of ibuprofen dry coated mixtures compared to physical mixtures was observed. It is possible that the change in intensity was due to the formation of hydrogen bonding between the carbonyl group of ibuprofen and the hydroxyl group of MCC (seeFig 4). Similar findings were reported by [34] who investigated the use of FTIR to study the formation of hydrogen bonding between carbonyl group of acrylic esters and OH groups of hexanols and cresols, where the intensity of spectra representing carbonyl group (C = O) was reduced due to the formation of hydrogen bonding between the hydroxyl (OH) and (C = O) groups.
Ibuprofen is available as a cohesive powder where every crystal unit is made of four ibupro-fen molecules that are attached with hydrogen bonding (two) leaving two remaining carbox-ylic–groups ready for further hydrogen bonding with adjacent neighbouring units [38]. As MCC has multiple OH groups, it is possible that hydrogen bonding has formed between the H of the OH group of MCC and the carbonyl O of ibuprofen (see diagram inFig 4). FTIR spectra revealed no shift in any of the peaks that correspond to ibuprofen or MCC. There was merging
Fig 4. FTIR spectra from top to bottom of ibuprofen (IBU) powder, MCC powder, (i) 2%w/w IBU in MCC coated mixture, (ii) 2%w/w IBU in MCC before coating, (iii) 5%w/w IBU in MCC coated mixture, (iv) 5%w/w IBU in MCC before coating, (v)10%w/w IBU in MCC coated mixture, (vi) 10%w/w IBU in MCC before coating and (vii) 20%w/w IBU in MCC coated mixture, (viii) 20%w/w IBU in MCC before coating highlighting the reduction in the intensity of the peak at wave number 1708 cm-1(labelled with red rectangle) of ibuprofen that is attributed to
C = O due to the formation of hydrogen bonding between the hydroxyl (OH) and (C = O) groups. Lower diagram
highlighting the hydrogen bonding formation between ibuprofen and MCC.
of the troughs related to IBU (2954- CH3 group) and the MCC (3301- OH group) as they appear at almost the same wave number range. However, since the intensity of the peak is related to quantity of the material, additional reference peak was considered (the trough at 1230 cm−1owing to C-C stretching). The intensity of this trough (at 1230 cm-1) was divided by the intensity of the trough at 1708.27 cm−1and the ratio was obtained. Results showed that there was a reduction in the ratio when dry coated particles were compared to the physical mixture, thus confirming that the change was not related to the quantity of ibuprofen.
Pfeffer and colleagues presented changes in FTIR spectra as a mean to identify mechano-chemical surface reaction between cellulose or corn starch and silica (used as guest). The absorbance in the -OH region was reduced due to the interaction of cellulose with the OH group in silica with loss of a water molecule [31].
Process optimisation
Based on the screening results, the main process variables to be optimised were processing speed, gas pressure, processing time and batch size. The CQAs obtained from the screening experiments were content uniformity, API release at 60 minutes, X10following PSA and the
intensity of the FTIR spectrum at 1708 cm-1of ibuprofen. Process optimisation included mul-tiple steps namely; setting the specifications of the CQAs, followed by risk assessment and DOE study.
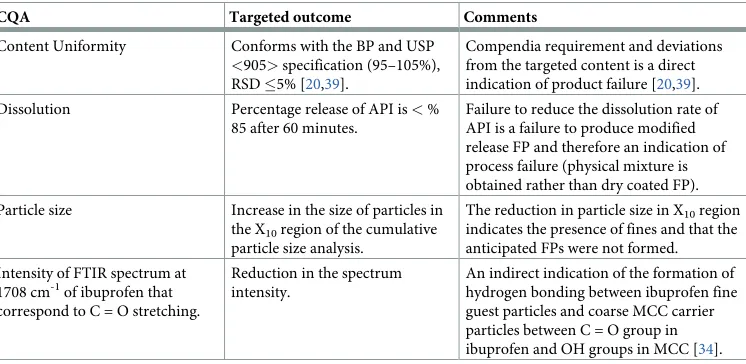
CQAs. CQAs of dry coated particles were identified based on literature, compendia
requirements and initial screening experiments [6,8].Table 4lists the CQAs were identified from the QTPP based on the impact of each parameter on the production of modified release FP.
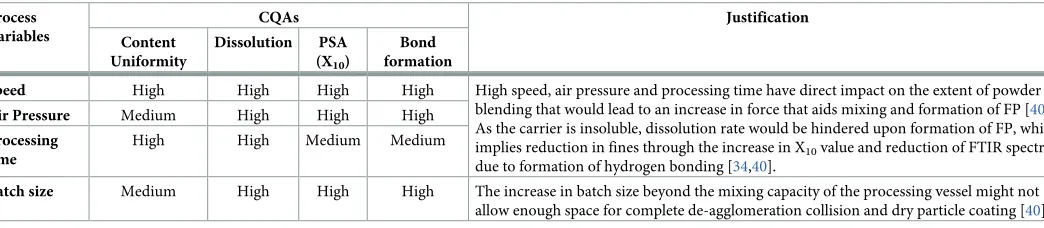
Risk assessment for CQAs and process variables. Risk assessment looked at the effect of
every input and process parameter on individual CQA which would enable the determination of independent factors (process variables)) that were used in the DOE experimental design (Table 5). Risk ranking was based on either compendia requirement, initial screening results or literature. Process parameters with risk ranking ranging between medium and high were taken as the factors in the DOE.
Design model creation. Once the process variables and responses (CQAs) were
estab-lished, the software developed the candidate model as the D-optimal with 26 experiments that
Table 4. CQAs of the final powder dry coated blend.
CQA Targeted outcome Comments
Content Uniformity Conforms with the BP and USP <905>specification (95–105%), RSD�5% [20,39].
Compendia requirement and deviations from the targeted content is a direct indication of product failure [20,39]. Dissolution Percentage release of API is<%
85 after 60 minutes.
Failure to reduce the dissolution rate of API is a failure to produce modified release FP and therefore an indication of process failure (physical mixture is obtained rather than dry coated FP).
Particle size Increase in the size of particles in the X10region of the cumulative particle size analysis.
The reduction in particle size in X10region indicates the presence of fines and that the anticipated FPs were not formed. Intensity of FTIR spectrum at
1708 cm-1of ibuprofen that correspond to C = O stretching.
Reduction in the spectrum intensity.
An indirect indication of the formation of hydrogen bonding between ibuprofen fine guest particles and coarse MCC carrier particles between C = O group in ibuprofen and OH groups in MCC [34].
were carried out according to the randomisation order set by the software, of which 4 experi-ments represented replicates necessary to ensure model reproducibility. The compiled work-sheet was then fitted into the D-optimal model. Once the model was fitted, model verification and regressions equations to enable understanding of the effect of process variables on CQAs were conducted. All insignificant model terms were removed from the model equation.
Model verification. Model verification was carried out using distance to model plot (Fig 5I–5III). A total of 22 included and 4 excluded runs: initially, run 4 (Fig 5I) was the farthest from the model followed by run 11 (Fig 5II) then finally the last two run 5 and run 15 (Fig 5III) were removed.
Once the insignificant runs were excluded, the model fitness was investigated using the lack of fit plot (Fig 5IV) that is denoted by three bars for each CQA. The first bar (A) represents the standard deviation of the lack of fit that is related to the model error. The second bar (B) repre-sents the pure error. The third bar (C) is the standard deviation of the pure error multiplied by the critical F-value at the 95% confidence interval. To assess lack of fit, the standard deviation
Table 5. Risk assessment of the input and process parameters against the CQAs with relevant justification to produce FP with extended release profile.
Process Variables
CQAs Justification
Content Uniformity
Dissolution PSA
(X10)
Bond formation
Speed High High High High High speed, air pressure and processing time have direct impact on the extent of powder
blending that would lead to an increase in force that aids mixing and formation of FP [40]. As the carrier is insoluble, dissolution rate would be hindered upon formation of FP, which implies reduction in fines through the increase in X10value and reduction of FTIR spectra due to formation of hydrogen bonding [34,40].
Air Pressure Medium High High High
Processing time
High High Medium Medium
Batch size Medium High High High The increase in batch size beyond the mixing capacity of the processing vessel might not
allow enough space for complete de-agglomeration collision and dry particle coating [40].
https://doi.org/10.1371/journal.pone.0206651.t005
Fig 5. (I,II &III) Distance to model (Y) plot of individual runs to identify insignificant runs (highlighted with circles). Note that the distance to model changes upon removal of the furthest run. (IV) Lack of Fit plot showing
standard deviation (SD) due to lack of fit (A), SD of pure error (B) and SD of pure error�critical F-value (C) for the four responses. If A�C, the model shows no lack of fit.
due to lack of fit (A) was compared with the standard deviation bar�F-value (C). As shown in
Fig 4, for all responses, the value of standard deviation due to lack of fit (A) was below the stan-dard deviation�F-value (C) which confirms model validity.
The quadratic model was then fitted using the 12 terms for each response including; con-stant, 4 single terms (speed, time, air pressure and batch size), one quadratic term (speed2) and six interaction terms (speed�time, speed�air pressure, speed�batch size, time�air pressure, time�batch size and air pressure�batch size).
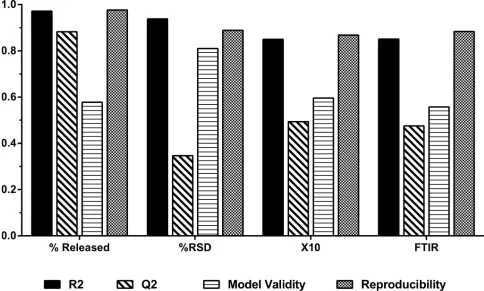
The results of every response are depicted inFig 6. R2 and Q2 values gives the best estimate to the fitting of the model with R2 is the percentage of variation of the response and the degree of how the data fits the model. Q2 represents the prediction ability of the model (how well the model will predict new data). Overall the model fitted well all the four responses with high R2 value of 0.973 for dissolution, 0.944 for content uniformity, 0.851 of PSA and 0.859 for FTIR. The predictive power varied among responses; for dissolution, almost 88.2% of the 97.3% fit-ting, could be predicted. In an optimisation process, high Q2 of responses is expected as the ultimate purpose is to optimise and predict the model behaviour. The model showed that the predictive power of content uniformity was at the acceptable range (>0.25). Out of 94.4% of fitted results, 34.6% could be predicted while any noise responsible for reducing Q2 could be attributed to the sampling process. As for particle size, the model fitted with 85.1% accuracy (very good model) of which, 49.4% could be predicted. The more FP produced, the lower the amount of fine and hence the larger the particle size at the X10region. FTIR spectrum
trans-mittance intensity for ibuprofen at C = O link represents good fitting in the model with 47.5% out of 85.9% of the results could be predicted. As for validity, all responses were valid as they
Fig 6. Summary plot of the four responses (CQAs) of fit showing model Fit (R2), predictability (Q2), model validity and reproducibility. Model
fitted with PLS.
exceeded the threshold of 0.25 (16). Validity values ranged from the lowest for 0.577 (FTIR), 0.591 (dissolution), 0.598 (PSA) to the highest value for content uniformity (0.837). Reproduc-ibility was very high for all responses (>0.5 threshold) indicating good control over experi-ment and low pure error. The reproducibility ranged from 0.976 for dissolution, 0.889 for content uniformity, 0.868 for PSD, to 0.883 for FTIR.
Analysis of variance (ANOVA) results. Table 6summarises the results obtained from ANOVA analysis, where in the current investigation, the p value was<0.05 for all CQAs sug-gesting that the regression model is statistically significant for all responses. Secondly, the model error due to lack of fit was insignificant as the p value was more than 0.05 for all the responses.
Regression model equations for CQAs. Once the significance of the CQAs within the
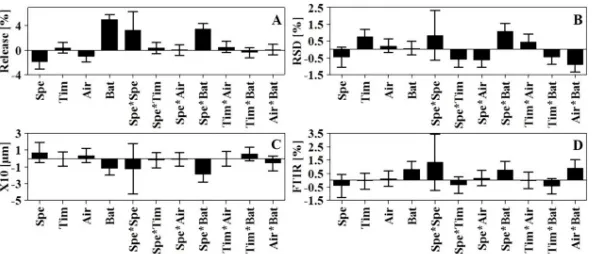
model was established; the regression coefficients for all the model terms were investigated to identify the significant model terms per CQA using regression coefficients plot (Fig 7). The size of the coefficient (the length of the bar) indicates the effect of the factor on the response whereas direction of the coefficient represents the negative or positive impact on the response. The coefficient will be considered significant when the confidence intervals do not cross zero. The first four coefficients (the linear terms) disclose the main effect of the each CPPs. The ones that follow, also called interaction terms, reveal interactions (if any) within the factors. The size of the coefficient is the real effect while the confidence interval represents the noise [10]. For example, the most significant factors affecting dissolution were batch size followed by
Fig 7. Regression coefficient plot of dry particle coating process model terms for each CQA (response). (A) %
release in 60 minutes, (B) %RSD, (C) X10value (μm) and (D) FTIR spectrum.
https://doi.org/10.1371/journal.pone.0206651.g007
Table 6. Summary of results obtained from ANOVA of the four responses to test model validity.Pis probability and R2 is the regression coefficient.
P R2
Dissolution
Regression <0.00001 0.97
Lack of Fit 0.195
Content Uniformity
Regression <0.00001 0.944
Lack of Fit 0.522
PSA
Regression 0.007 0.851
Lack of Fit 0.201
FTIR
Regression 0.006 0.859
Lack of Fit 0.184
speed then air pressure whereas speed�batch size was the most significant interaction term. The quadratic term speed�speed had high significance.
The proposed regression model for every CQA was then built based on the significant cor-relation coefficients for each independent factor (Fig 6) and the effects they had. For each response, the quadratic model entailing 12 model terms was fitted, only those with significance were included in the regression equations. The fitted equations for all responses are displayed in (Eq 3–6).
Y1¼92:15 4:23X1 1:92X3þ10:83X4þ6:92X2
1þ7:78X1X4 Eqð3Þ
Y2¼1:85þ1:54X2 1:08X1X2 1:4X1X3þ2:47X1X4þ0:93X2X3 1:18X2X4
2:06X3X4: Eqð4Þ
Y3¼19:86 2:58X4 4:31X1X4 Eqð5Þ
Y4¼13:59þ1:81X4þ1:82X1X4þ2:0X3X4 Eqð6Þ
From the equations, Y1is the dissolution results (percentage released after 60 minutes), Y2
is the content uniformity measured as relative standard deviation (RSD), Y3is the results from
PSA expressed as the particle size at the X10region and Y4is the FTIR results presented as
intensity of the spectra at 1708 cm-1. X1is the speed (rpm), X2is processing time (min), X3is
air pressure (psi) and X4is the batch size (g). The value of each coefficient indicates the impact;
the higher the value the more the effect. The sign of the coefficient provides information on the effect being positive or negative. Positive sign with batch size for example of (10.83) has a positive effect on dissolution rate. Whereas speed (-4.23) demonstrated the most significant negative impact factor where increasing the speed resulted in a reduction of dissolution rate.
Effect of independent factors on CQAs. There is a close association between dissolution,
PSA and FTIR results. Theoretically successful FP should result in reduction of dissolution rate, increase in the particle size at the X10region of the powder mix and finally and reduction
in the intensity of FTIR spectra at 1708 cm-1due to the formation of hydrogen bonding. As such, the effect plots for this group will be discussed concurrently.
Effect on dissolution, PSA and FTIR. The most significant single model factor affecting
production of FP was batch size (Fig 8). The collective effect on the three responses (dissolu-tion, PSA and FTIR) showed a negative impact on the formation of particles. The increase in batch size resulted in an increase in dissolution, reduction of X10fraction of particle size
analy-sis and an increase in the FTIR spectrum intensity (1708 cm-1).
The analysis (Eqs3,5and6) also showed that speed and batch size interaction term had an antagonistic effect on dissolution (Fig 9A). When increasing the speed, the dissolution profile was reduced. However, the influence of speed was greater when the batch size was set to its lowest level. The increase in speed resulted in higher shear force and hence production of FP with reduced dissolution rate. However, when the batch size exceeded 10 g, an antagonistic effect on dissolution with a dissolution rate reaching 100% within 60 minutes resembling the physical mix obtained at 300 rpm was noted. The interaction predictive model showed that the effect of speed was further enhanced when the rotational speed exceeded 800 rpm.
The interaction between speed and batch size was the most significant on PSA as evident from the regression model (Eq 5) with coefficient factor of -4.31. FromFig 9B, a small batch size with high speed resulted in larger particles. The fine guest particles got strongly attracted to the coarse carrier particles as evidenced by an increase in the X10particle size. This was
particles to large carrier particles) [33,40] but also hydrogen bonding between hydrogen of the MCC and the C = O of ibuprofen which was evident from the reduction in the intensity of the FTIR spectra at 1708 cm-1. However, with the increase in batch size, the effect of speed declined resulting in an increase in the fines.
Likewise, speed and batch size as interaction model terms had an effect on FTIR (Fig 9C) that even clearly demonstrated fromFig 10showing the interaction region on the RSM plot. At low speed, FTIR spectrum intensity was at its maximum due to absence of any hydrogen bonding. At low speed, the batch size had no influence on FTIR and the device was possibly working as a powder blender. However, with the increase in speed and reduction in batch size, there was a significant reduction in the intensity of the FTIR spectrum suggesting the forma-tion of hydrogen bonds with the resultant particles.
Interestingly, the effect of the quadratic term (speed2) on dissolution rate showed a positive value (Eq 3). The positive sign indicates a convex curve [41]. It was therefore assumed from the model that initially, with the increase of speed, the force produced in the system resulted in the formation of FP which negatively impacted dissolution. However, beyond a limit, the increase in speed may result in rapid collision of particles above the limit of attract ion which could result in detachment of the guest particles from the surface of the host particles resulting in attrition and could possibly enhance the dissolution rate.
Effect on content uniformity. Low RSD in content uniformity studies is an indication of
blend homogeneity once the content is within the established range of 95–105%. Based on the regression equation (Eq 4) RSD was affected by many interaction terms however, speed and batch size had the highest negative impact (regression coefficient +2.47) with a positive sign
Fig 8. Main effect plot of batch size on the dissolution, PSA and FTIR spectrum when other factors maintained at their middle values. Note the D-optimal design has no centre points and hence were not displayed.
https://doi.org/10.1371/journal.pone.0206651.g008
Fig 9. Interaction effect plot of speed with increasing batch size on (A) dissolution rate (B) PSA and (C) FTIR
spectrum while the other factors were maintained at their middle values.
indicating an increase in RSD. At low to moderate speed the increase in batch size has limited effect on content uniformity of the mixture. Contrary to that, at high speed the smaller the batch size the lower the RSD and hence the better the homogeneity. This could be attributed to the effect of shear force resulting in de-agglomeration and proper dispersion of the fine powder within the mixture. The RSM plot (Fig 11A) shows the extent of interaction between speed and batch size and enables the prediction of the best working space, where homogenous mixture with RSD<2% was obtained with speeds exceeding 800 rpm while maintaining the batch size below 10 g. As the target of this experiment was to identify the optimal process parameters to produce FP while maintaining homogeneity, the optimal working parameters selected for FP production will result in a homogenous mixture with RSD far below the proposed 5%. The interaction between speed and processing time (Fig 11B) showed that the RSD was reduced with the increase in speed and reduction in time. Zheng and colleagues [42] reported that mix-ing for extended duration may undesirably affect the content uniformity of the mixture. How-ever, as the effect of processing time was decreased with the increase in speed, above 500 rpm the RSD was far below 1%. At a speed of 1500 rpm set for the maximum processing time of 60 minutes, the resultant RSD was 1.4% whereas reduction of processing time to 15 minutes pro-duced RSD less than 0.5%.
FromEq 4, the second most significant interaction term affecting content uniformity was batch size and air pressure. Low RSD was best obtained when working at the low limits of both batch size and air pressure, nevertheless, increasing air flow produced a lower RSD with batch size set at its maximum limit. In all cases the change in RSD did not exceed 2%. Since FP were best obtained at lower batch size with moderate to high air pressure, such working conditions could be identified throughFig 12.
Speed of mixing enhanced homogeneity when mixing occurred at lower air pressure. The antagonistic effect of air flow was observed when the speed was at its low limit (Fig 13A). This
Fig 10. Response Surface Model (RSM) Plot of the effect of speed and batch size on the FTIR of the powder mixture while maintaining air flow and time at their middle values (mid-region highlighted the interaction effect of both factors).
could be attributed to induction of turbulence in the system by air flow that might cause fine particles to adhere to the surface of the container particularly if the force produced (diffusion and convection currents) was not enough to de-agglomerate the cohesive ibuprofen particles and adhere it over the carrier particles [42].
Processing time with increasing batch size was an interaction type of relationship; at low processing time the mixture was more homogenous with a lower RSD when the batch size was set within the small range. Interestingly this occurred when the speed and air flow were set at their average. This could be attributed to the formation of FP. It was expected that the blend of FP aids homogeneity and as discussed earlier the smaller the batch size the higher the possi-bility of producing a hybrid mixture. However, it is worth mentioning for these two factors that the highest RSD obtained did not exceed 4% (Fig 13B).
Setting the optimal zones. Based on the results obtained from RSM plots throughout the
study, the optimal operable zones within the CPPs that reveal the space that could result in optimal CQAs (dissolution rate of<85% and blend with RSD<5%), are illustrated inFig 14. From the graph, the area (A) represents the design space with CPPs (speed and processing time) that could result in desired responses for both dissolution rate and content uniformity.
Fig 11. Response Surface Model (RSM) Plot of the (A) effect of speed and Batch size on the content uniformity of
ibuprofen in the powder mixture while maintaining processing time and air flow at their middle values, (B) the effect of speed and processing time on the content uniformity of ibuprofen in the powder mixture while maintaining air flow and batch size at their middle values.
https://doi.org/10.1371/journal.pone.0206651.g011
Fig 12. Interaction effect plot of batch size with increasing air flow on content uniformity while other factors were maintained at their middles values.
The zones marked with (B) and (C) represent areas the CPPs (speed and processing time) meet the criteria for content uniformity alone, whereas, the white zone represents the CPPs when none of the criteria is met. The maximum operable space was obtained when the air pressure was set at its maximum range of 40 psi, the batch size was set at its lowest range of 6 g and the speed can be varied from 850 rpm to 1500 rpm with processing time ranging from 15 to 60 minutes.
Conclusion
The application of QbD principles accompanied by the multifactorial design of experimental analysis enabled the proper understanding of process parameters, particularly those with direct impact on targeted outcomes or CQAs. The initial screening studies identified speed, air pres-sure, processing time and batch size as key process parameters; while content uniformity, dis-solution rate, particle size and FTIR C = O intensity were identified as CQAs. These were employed for the optimisation study. Based on created models design space bordered by high pressure, low batch size, and a range of speeds and processing times was identified, and work-ing within this space produced dry coated particles with targeted functionalities. In conclusion, the systematic application of QbD principles served two broad aims in this work. Firstly, to identify the influence of variations and interactions of the chosen factor on targeted quality attributes; and secondly to optimise the system to determine the factor combinations to yield the desired FP.
Fig 13. Interaction effect plot of (A) air flow with increasing speed (B) batch size with increasing processing time on
content uniformity while other factors were maintained at their middle values.
https://doi.org/10.1371/journal.pone.0206651.g013
Supporting information
S1 Data. Design of experiments worksheet that operates with MODDE software.
(MIP)
Author Contributions
Conceptualization: Eman Z. Dahmash, Afzal R. Mohammed.
Formal analysis: Eman Z. Dahmash, Ali Al-khattawi, Affiong Iyire, Afzal R. Mohammed.
Methodology: Eman Z. Dahmash, Afzal R. Mohammed.
Software: Eman Z. Dahmash.
Writing – original draft: Eman Z. Dahmash, Ali Al-khattawi, Affiong Iyire, Hamad Al-Yami,
Thomas J. Dennison, Afzal R. Mohammed.
Writing – review & editing: Eman Z. Dahmash, Ali Al-khattawi, Affiong Iyire, Afzal R.
Mohammed.
References
1. Lawrence XY. Pharmaceutical quality by design: product and process development, understanding, and control. Pharm Res 2008; 25:781–91.https://doi.org/10.1007/s11095-007-9511-1PMID:
18185986
2. Yu LX, Amidon G, Khan MA, Hoag SW, Polli J, Raju GK, et al. Understanding Pharmaceutical Quality by Design. J Am Assoc Pharm Sci 2014; 16:771–83.https://doi.org/10.1208/s12248-014-9598-3PMID:
24854893
3. ICH. International Conference on Harmonisation of Technical Requirements for Registration of Pharma-ceuticals for Human Use, Pharmaceutical Development, Q8(R2). 2009.
4. ICH. International Conference on Harmonisation of Technical Requirements for Registration of Pharma-ceuticals for Human Use, Pharmaceutical Quality Systems, Q10. 2008.
5. Lionberger RA, Lee SL, Lee L, Raw A, Lawrence XY. Quality by design: concepts for ANDAs. AAPS J 2008; 10:268–76.https://doi.org/10.1208/s12248-008-9026-7PMID:18465252
6. FDA. Pharmaceutical Development Report- Example QbD for IR Generic Drugs. 2012.www.fda.gov/
. . ./Drugs/DevelopmentApprovalProcess/HowDrugsareDev. (accessed September 9, 2016).
7. Yu LX, Raw A, Lionberger R, Rajagopalan R, Lee LM, Holcombe F, et al. US FDA question-based review for generic drugs: A new pharmaceutical quality assessment system. J Generic Med 2007; 4:239–46.
8. ICH. International Conference on Harmonisation of Technical Requirements for Registration of Pharma-ceuticals for Human Use, Quality Risk Management, Q9. 2005.
9. Anderson MJ WP. Design of experiments. Wiley Online Library; 1974.
10. Eriksson L. Design of experiments: principles and applications: MKS Umetrics AB; 2008.
11. Hersey JA. Ordered mixing: a new concept in powder mixing practice. Powder Technol 1975; 11:41–4.
12. Yip CW, Hersey JA. Perfect powder mixtures. Powder Technol 1977; 16:189–92.
13. Ishizaka T, Honda H, Ikawa K, Kizu N, Yano K, Koishi M. Complexation of aspirin with potato starch and improvement of dissolution rate by dry mixing. Chem Pharm Bull 1988; 36:2562–9. PMID:3240477
14. Ishizaka T, Honda H, Kikuchi Y, Ono K, Katano T, Koishi M. Preparation of drug-diluent hybrid powders by dry processing. J Pharm Pharmacol 1989; 41:361–8. PMID:2570829
15. Honda H, Kimura M, Honda F, Matsuno T, Koishi M. Preparation of monolayer particle coated powder by the dry impact blending process utilizing mechanochemical treatment. Colloids Surfaces A Physico-chem Eng Asp 1994; 82:117–28.
16. Saharan VA, Kukkar V, Kataria M, Kharb V, Choudhury P. Ordered mixing: mechanism, process and applications in pharmaceutical formulations. Asian J Pharm Sci 2008; 3:240–59.
18. Al-Khattawi A, Iyire A, Dennison T, Dahmash E, Bailey CJ, Smith J, et al. Systematic screening of com-pressed ODT excipients: Cellulosic versus non-cellulosic. Curr Drug Deliv 2014; 11.
19. Ghoroi C, Han X, To D, Jallo L, Gurumurthy L, Dave´ RN. Dispersion of fine and ultrafine powders through surface modification and rapid expansion. Chem Eng Sci 2013; 85:11–24.
20. USP. The United States pharmacopeia: the National Formulary: USP 29 NF 23. Washington, D.C. Rockville: USP, C. (2008). The United States Pharmacopeia. National Formulary.; 2008.
21. Watson DG, Edrada-Ebel R. Pharmaceutical analysis: a textbook for pharmacy students and pharma-ceutical chemists. Edinburgh: Churchill Livingstone, 2012.; 2012.
22. Triefenbach F. Design of experiments: the D-optimal approach and its implementation as a computer algorithm. Bachelor’s Thesis Inf Commun Technol 2008.
23. Montgomery D. Design and analysis of experiments. 6th ed. New York: Wiley; 2005.
24. AlHusban F, ElShaer AM, Kansara JH, Smith AM, Grover LM, Perrie Y, et al. Investigation of formula-tion and process of lyophilised orally disintegrating tablet (ODT) using novel amino acid combinaformula-tion. Pharmaceutics 2010; 2:1–17.https://doi.org/10.3390/pharmaceutics2010001PMID:27721339
25. Gohel M, Patel M, Amin A, Agrawal R, Dave R, Bariya N. Formulation design and optimization of mouth dissolve tablets of nimesulide using vacuum drying technique. AAPs PharmSciTech 2004; 5:10–5.
26. Drug Bank. Ibuprofen. Online Data Base 2016.https://www.drugbank.ca/drugs/DB01050. (accessed October 17, 2016).
27. Stewart P, Alway B. Aggregation during the dissolution of diazepam in interactive mixtures. Part Sci Technol 1995; 13:213–26.
28. Supabphol R, Stewart PJ. Aggregation during the dissolution of diazepam in interactive and granulated mixtures. Pharm Pharmacol Commun 1996; 2:233–6.
29. Allahham A, Stewart PJ. Enhancement of the dissolution of indomethacin in interactive mixtures using added fine lactose. Eur J Pharm Biopharm 2007; 67:732–42.https://doi.org/10.1016/j.ejpb.2007.04.013
PMID:17540551
30. Saharan V, Choudhury P. Dissolution rate enhancement of gliclazide by ordered mixing. Acta Pharm 2011; 61:323–34.https://doi.org/10.2478/v10007-011-0021-7PMID:21945911
31. Pfeffer R, Dave RN, Wei D, Ramlakhan M. Synthesis of engineered particulates with tailored properties using dry particle coating. Powder Technol 2001; 117:40–67.
32. Yang J, Sliva A, Banerjee A, Dave RN, Pfeffer R. Dry particle coating for improving the flowability of cohesive powders. Powder Technol 2005; 158:21–33.
33. Jallo LJ, Ghoroi C, Gurumurthy L, Patel U, Dave´ RN. Improvement of flow and bulk density of pharma-ceutical powders using surface modification. Int J Pharm 2012; 423:213–25.https://doi.org/10.1016/j. ijpharm.2011.12.012PMID:22197769
34. Khan F, Sivagurunathan P, Asghar J. FTIR study of hydrogen bonding interactions between alkyl esters and hexanol, p-cresol in carbon tetrachloride 2008.
35. Ramukutty S, Ramachandran E. Growth, spectral and thermal studies of ibuprofen crystals. Cryst Res Technol 2012; 47:31–8.
36. Jia N, Li S-M, Ma M-G, Zhu J-F, Sun R-C. Synthesis and characterization of cellulose-silica composite fiber in ethanol/water mixed solvents. BioResources 2011; 6:1186–95.
37. Terinte N, Ibbett R, Schuster KC. Overview on native cellulose and microcrystalline cellulose I structure studied by X-ray diffraction (WAXD): Comparison between measurement techniques. Lenzinger Ber-ichte 2011; 89:118–31.
38. Romero AJ, Savastano L, Rhodes CT. Monitoring crystal modifications in systems containing ibuprofen. Int J Pharm 1993; 99:125–34.
39. BP. The British pharmacopoeia 2012. London Stationary Office: 2012.
40. Bridgwater J. Mixing of powders and granular materials by mechanical means—a perspective. Parti-cuology 2012; 10:397–427.
41. UCLA. How do I interpret the sign of the quadratic term in a polynomial regression? 2013.