http://www.sciencepublishinggroup.com/j/ijdst doi: 10.11648/j.ijdst.20190501.14
ISSN: 2472-2200 (Print); ISSN: 2472-2235 (Online)
Fluctuation Analysis to Sequence of Ore-forming Element
Based on Fractal-Jump Model
Lai Simin
1, Wan Li
1, 2, *, Zeng Xiangjian
11
School of Mathematics and Information Science, Guangzhou University, Guangzhou, China
2
Key Laboratory of Mathematics and Interdisciplinary Sciences of Guangdong Higher Education Institutes, Guangzhou University, Guangzhou, China
Email address:
*
Corresponding author
To cite this article:
Lai Simin, Wan Li, Zeng Xiangjian. Fluctuation Analysis to Sequence of Ore-forming Element Based on Fractal-Jump Model. International Journal on Data Science and Technology. Vol. 5, No. 1, 2019, pp. 29-34. doi: 10.11648/j.ijdst.20190501.14
Received: April 11, 2019; Accepted: May 20, 2019; Published: May 23, 2019
Abstract:
The self-similarity of ore-forming elements is caused by long-term, multi-period characteristics and the abnormal fluctuation induced by emergency in geological process. In this study, the fractal jump model referred as a combination of fractional Brownian motion and Poisson distributed jumps was built to depict the fluctuation pattern of ore-forming elements and simulate the distribution of Au sequence for three different mineralization intensities in Dayingezhuang gold deposit in the Jiaodong gold province, China. By calculating the fitting error and drawing the comparison diagram between the simulated data and the actual data, the applicability and advantages of the model were verified. The results showed that the fractal jump model can be considered as a reliable and computationally efficient method through the comparison of the statistical characteristics between simulated and real data. In addition, this model can well depict the change of the Au element content sequence, and better simulation was achieved when the intensity of mineralization was higher. The present work provides a new insight on the prediction of mineralized levels in concealed orebody.Keywords: Ore-Forming Elements, Fractional Brownian Motion, Poisson Distribution
1. Introduction
With the deepening of prospecting, the exploration of the law of ore-forming elements and the prediction of ore deposits in concealed orebody has become a top priority for geological researchers. The ore-forming process is a process in which the ore-forming materials dispersed in the medium are activated, migrated and aggregated to form a deposit under geological conditions [1]. The metallogenic system evolves from disorder to ordered state, and continuously exchanges matter and energy with the external environment. As a result, the spatial distribution of ore-forming elements has strong randomness and nonlinear characteristics [2-4]. Therefore, combining nonlinear dynamic analysis methods with modern techniques is more helpful to reveal its characteristics and mechanisms.
The content of ore-forming elements is an effective indicator for the quantitative evaluation of mineral resources, and it is also an important reference for understanding the
it is not advisable to remove outliers in statistical analysis. He in reference [11] proposed a stable distribution model to analyze the empirical data sets containing outliers. But this model is rarely applied in geosciences, because the stable distribution is based on the central limit theorem, and the specific forms of the density function and the distribution function are difficult to manifest, which is difficult to implement in practical operations. Cheng et al [12] pointed out that the normal values of ore-forming elements follow normal distribution or lognormal distribution, while the abnormal values follow fractal distribution. The traditional statistical model has certain limitations. Neither the normal distribution of continuous random variables nor Poisson distribution of discrete random variables can describe the self-similarity of element distribution. The fractional Brownian motion model is one of the effective models to describe the self-similarity. However, for the model is based on Gaussian process, its edge is normal distribution, which makes it can not describe the non-Gaussian behavior. Based on this, this paper considers the combination of fractional Brownian motion and Poisson jump model to establish a jump fractal model that can effectively describe the fluctuation law of ore-forming element content. Through the simulation of gold elements in Dayingezhuang gold deposit and the comparison of the simulation data with actual observation data, the effectiveness of the model is verified. The aim is to provide a new method for revealing the enrichment law of ore-forming materials.
2. Fractal-Jump Model
2.1. Model Establishment
Due to the non-uniformity of the medium or the cascading process, Peng et al. [13] pointed out that the ore-forming element content sequence {X(s)} follows Brownian motion or fractional Brownian motion in a certain scale. For this reason, first consider a Brownian motion or fractional Brownian process. Driven Dynamics Model below
0
d ( )X s =
µ
BX s s( )d +σ
BX s B( )d H,X(0)=X >0 (1)Where X(0), µBandσB are constants respectively; the
fractional Brownian motion BH(s) is a Gauss process with zero
mean, and the covariance function is
2 2 2
1
[ ( ) ( )] ( | | ), , 0
2
H H H
H H
E B s B τ = s +τ − −s τ sτ > (2)
Here, BH is a self-similar process with fractal features.
That’s to any a>0, { H ( ), 0}
H
a− B as s> and{BH( ),s s>0}
have the same distribution; The scope of H is from 0 to 1, when H=0.5, BH is the standard Brownian motion, and
0.5
dB ( )s = s zd , dz~N(0,1).
In addition, due to the influence of material sources in the deep part of the earth, some unexpected events will occur, resulting in local aggregation or content anomalies in random sequences, that is called jumping phenomena [14]. Therefore, considering the fluctuation of ore-forming element content, it is characterized by fractional Brownian process. At the same time, the Poisson process is introduced to describe the jump variation factor, and a model of the stochastic fluctuation of ore-forming elements is described by a mixing process of a fractional Brownian process and a Poisson process:
d lnX s( )=
µ
Bds+σ
BdBH +J qd (3)Here, ~ ( , 2)
J J
J N µ σ , J describes the amplitude of the jump; q is the Poisson counting process with the intensity λ, which satisfies the condition: P(dq=1)=λds, P(dq=0)=1-λds, and dq and dBH are independent of each other. Therefore, equation (3) contains a class of processes that have both long-term memory and jumps. Such processes have the conditions to characterize two important characteristics of self-similarity and jump-property of ore-forming element content data.
2.2. Model Parameter Estimation
Let the delay be τ, then discretize the equation (3),
1
In ( ) In ( )
[ ( ) ( )]
Q
B B H H i
i
X s X s
u B s B s J
τ
τ σ τ
= + −
= + + − +
∑
(4)Where Q is the number of jump points in the interval [s,
s+τ], which satisfies the follow condition,
Pr ( )
!
λλ −
= =e q
ob Q q
q (5)
2
( ) ( )~ (0, H)
H H H
B B s τ B s N τ
∆ = + − (6)
2
~ ( , )
i J J
J N µ σ (7)
Written as lnX s( + −
τ
) lnX s Y( )~ s+τ,s∈[0, ]S .1 , 0 , 1 Q s q q X Q Y
X J Q
τ + = = = + ≥
∑
(8)The log maximum likelihood function is
2
2 2 2
( )
2( ) 2 2 2
0 0
1 ( , ) In
! 2 ( )
s B J H B J Y q q Q S q H
s q B J
e
L Y e
q q τ µ τ µ λ σ τ σ λ π σ τ σ + − − − − + = = Θ = ⋅ +
Let ∂ ΘL( , )Y =0
∂Θ , we get the nonlinear equations about the
parameters, then by using MATLAB to program and do numerical calculation to estimate the parameter Θ (Θ =(
µ σ λ µ σ
B, B, , J, J,H)).3. Application Analysis
3.1. Geological Background and Data Acquisition
The Dayingezhuang ore deposit is located in the middle segment of the Zhaoping fault zone in Jiaodong Peninsula, China (Figure 1). Gold deposits in the northwestern part of the jiaodong peninsula are divided into quartz vein type and altered rock type, and the altered rock type is mainly dominant in this place [15]. Quartz vein type ore bodies have smaller reserves and higher grade; while altered rock type ore bodies have larger reserves and lower grade. Deng et al. [16] pointed out that the altered gold deposit is mainly controlled by the primary fault, and the quartz vein is mainly controlled by the
secondary fault, which occurs at a certain distance from the main fault. The gold ore body is 3,000 meters long and 30 meters to 140 meters wide. In addition, the gold deposits in Dayingezhuang has more than 100 tons of reserves and the annual output exceeds 2.6 tons [17, 18].
Wall rock alteration is the main process of gold mineralization, including sericitization, K-feldspar alteration, chloritization, sericite-quartzalteration, carbonatization [19]. The gold ore body of altered rock type is mainly developed in the pyrite-sericite-quartz alteration zone which is under the Zhaoping fault zone [20]. In the Zhaoping fracture zone, there has more than 20 different sizes of alteration zones were collected in the lower part of the deposit, in where that the No. I and No. II altered zone are the largest. The No. II altered zone is located between drift 64 and drift 89 in the northern part of the deposit, including 73 ore bodies, in which the No. II-1 ore body is the largest [21]. Samples were taken from the No. II-1 ore body and its surrounding alteration zone, and the grade data of different elements in the ore body are obtained to analysis.
Figure 1. Generalized geological map of gold deposits in the northwestern Jiaodong Peninsula.
3.2. Case Analysis and Discussion
We selected the Au element channel samples grade sequence of the Dayingezhuang gold deposit in Shandong province as the research object, with sampling interval of 1 m and length of more than 100 m, to verify the validity and applicability of the fractal-jump model.
Variation of gold grades in different drifts reflects structural variations such as the size and abundance of fractures or microfractures at different locations within the fault system. Based on variation in mineralization density, the mineralization intensity of the exploration line is divided into three rank: barely mineralized drifts (KH1), in which the proportion of gold grades is greater than 2g/t and lower than
20%, and the ore bodies are barely developed; moderately mineralized drifts (KH2), in which the proportion of gold grades is greater than 2 g/t and between 30% and 60%, and the mineralization is relatively intermittent and thin; intensely mineralized drifts (KH3), in which the proportion of gold grades is not less than 2 g/t and larger than 60%, and the mineralization is very thick [22].
Let the boundary grade as the jump threshold to determine the number and amplitude of the Au element jumps with different mineralization grades, and then use the maximum likelihood method to estimate the parameter set
(µ σ λ µ σB, B, , J, J,H)
Table 1. Estimation results of the parameters of the jump fractal model.
sample µB σB λ µJ σJ H
KH1 0.0213 0.5214 0.081 0.0012 0.0018 0.6132
KH2 0.2029 0.6098 0.227 0.017 0.1239 0.5046
KH3 0.3806 0.7316 0.3368 0.3576 0.6912 0.746
It can be seen from Table 1 that the λ value of KH3 is greater than KH2, and the λ value of KH1 is close to zero, indicating that the jump range of the Au element in the strongly mineralized section is greater than that in the weakly mineralized section, while there is almost no jump in the non-mineralized segment. The Hurst values of the three samples are all greater than 0.5, and the Hurst value of KH2 is close to 0.5, which is close to the random walk, and the Hurst value of KH3 is the largest, indicating that the randomness of medium mineralization sequence is stronger than that of weak mineralization and strong mineralization.
The estimated parameter values were substituted into the jump fractal model to simulate the generation of Au element sequences, which were simulated for 10 times. The
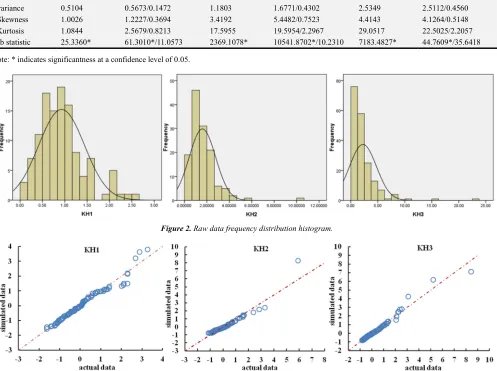
characteristic statistics of the simulated data and the original data were compared in Table 2. It can be seen that the basic statistics of element data and simulated data are relatively close. At the confidence level of 5%, the normal test was carried out on the original data and the simulated data, and the results showed that the Au element grade sequence of the selected exploration line presented a non-normal distribution, in which the element content distribution of KH2 and KH3 Au element content showed obvious spikes and asymmetric right-skewed distribution, and the histogram was shown in Figure 2. Therefore, the traditional statistical method based on the assumption of normal distribution is difficult to accurately describe the nonlinear complexity.
Table 2. Basic statistics of raw data and simulated data.
sample
KH1 KH2 KH3
original Analog/average
absolute error original
Analog/average
absolute error original
Analog/average absolute error
Mean 0.9282 1.1024/0.5041 1.6019 1.6292/0.4501 2.2834 2.1931/0.3823
variance 0.5104 0.5673/0.1472 1.1803 1.6771/0.4302 2.5349 2.5112/0.4560
Skewness 1.0026 1.2227/0.3694 3.4192 5.4482/0.7523 4.4143 4.1264/0.5148
Kurtosis 1.0844 2.5679/0.8213 17.5955 19.5954/2.2967 29.0517 22.5025/2.2057
Jb statistic 25.3360* 61.3010*/11.0573 2369.1078* 10541.8702*/10.2310 7183.4827* 44.7609*/35.6418
Note: * indicates significantness at a confidence level of 0.05.
Figure 2. Raw data frequency distribution histogram.
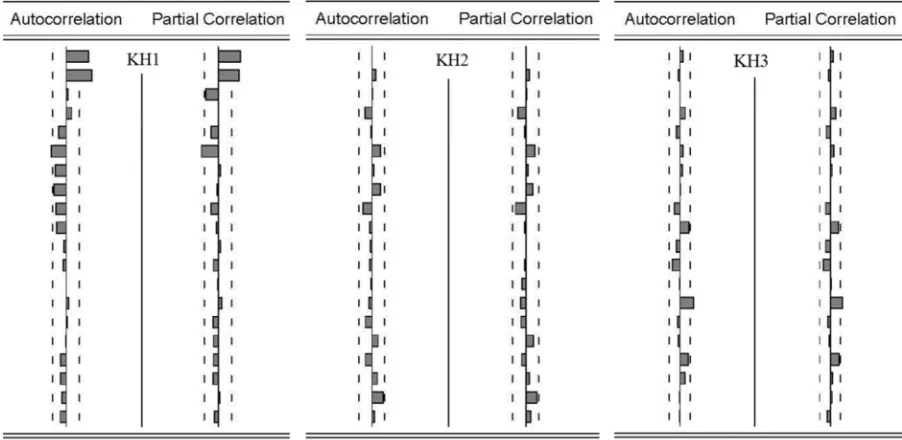
Figure 4. Autocorrelation function and partial correlation function of simulated data and actual data error.
Figure 3 shows the comparison graph and Q - Q graph of simulated data and actual data. It can be seen that the data points are basically around the diagonals, and only a few points deviating from the diagonals at the high grade, indicating that the distribution of mineralization element data simulated by the fractal jump model is basically consistent with the real data. By further calculating the autocorrelation function and partial correlation function of the difference between the simulated value and the actual value, as shown in Figure 4. It is found that the error term of KH1 mainly falls after the second order, and all the error terms of KH2 and KH3 fall into the random interval, which belongs to the random error. Therefore, it is effective to simulate the fluctuation change of Au element by using jump fractal model. Among them, KH2 and KH3 have better simulation effect than KH1.
4. Conclusion
On the one hand, due to the long-term and multi-stage nature of geological processes, the mineralization process tends to be multi-stage repetitive ore-forming, which makes the element content have self-similar characteristics in space; On the other hand, the unexpected events in geological processes can cause abnormal fluctuations in element content. Therefore, it is of practical significance to find a suitable model to describe the content sequence of ore-forming elements. We proposed the jump fractal model to simulate the sequence of Au elements in three different mineralization strengths in Dayingezhuang, Shandong province. By comparing the statistics of the simulated value with the actual value, Q-Q graph and the autocorrelation function. The results showed that the fractal-jump model has good simulation effect to the elements Au mineralization, and the higher the degree of mineralization, the better fitting effect, which provides an important theoretical basis for further predicting the fluctuation law of ore-forming elements in concealed ore
body.
Acknowledgements
Thanks to the editor for reviewing this paper and making detailed suggestions to help me improve the quality of the work. This work was supported by the National Natural Science Foundation of China (Grant No. 41872246, 41172295); Innovation Research for the postgraduate of Guangzhou University (2018GDJC-D27).
References
[1] C. Yu. “Fractal Growth of Ore-forming Dynamical Systems at the Edge of Chaos-A Tentative New Metallogeny”, Eleventh V M Goldschmidt Conference., Vol 3, 2017, pp. 12-16. [2] Q. M. Cheng. “Mapping singularities with stream sediment
geochemical data for prediction of undiscovered mineral deposits in Gejiu, Yunnan Province, China”, Ore Geol. Rev., Vol. 32, No. 1-2, 2007, pp. 23-37.
[3] J. Deng, Q. F. Wang, L. Q. Yang, et al. “Delineation and exploration of geochemical anomalies using fractal models in the Heqing area, Yunnan Province, China”, Geochem. Explore., Vol. 105, 2010, No. 3, pp. 3-18.
[4] J. Deng, Q. Wang, G. Li, et al. “Cenozoic tectono-magmatic and metallogenic processes in the Sanjiang region, southwestern China”, Earth-Science Reviews., Vol. 138, 2014, pp. 268-299.
[5] E. Inam, S. Khantotong, K. W. Kim, et al. “Geochemical distribution of trace element concentrations in the vicinity of Boroo gold mine, Selenge Province, Mongolia”, Environ Geochem Health., Vol. 33, No. 1, 2011, pp. 57-69.
[7] Hu F F, H. R. Fan, X. H. Jiang, et al. “Fluid inclusions at different depths in the Sanshandao gold deposit, Jiaodong Peninsula, China”, Geofluids., Vol. 13, No. 4, 2013, pp. 528-541.
[8] L. Wan, D. Y. Xie, X. C. Deng. “Correlation Analysis of Elimination Trend of Metallogenic Elements in Shangzhuang Gold Deposit, Jiaodong”, Journal of Guangzhou University., Vol. 13, No. 1, 2014, pp. 21-36.
[9] L. Wan, X. Y. Hu, X. C. Deng. “Analysis of ore body mineralization intensity based on wave function—Taking the Dayingezhuang gold deposit in Shandong as an example”, Journal of Guangzhou University., Vol. 11, 2012, pp. 105-111. [10] Z. Y. Zhu, S. Y. Jiang, R Mathur, et al. “Iron isotope behavior
during fluid/rock interaction in K-feldspar alteration zone - A model for pyrite in gold deposits from the Jiaodong Peninsula, East China”, Geochimica Et Cosmochimica Acta., 2018, pp. 222.
[11] B. B. Mandelbort. “The Fractals Geometry of Nature”, New York: Freeman., 1982, pp. 156-200.
[12] Q. M. Cheng. “Multidimensional fractal theory and distribution of geochemical elements”, Earth Science., Vol. 25, No. 3, 2000, pp. 311-318.
[13] B. Peng, F. Peng. “Pricing of Extended Option under Jumping Fractal Process”, Journal of East China Normal University (Natural Science Edition)., vol. 3, 2012, pp. 30-40.
[14] Y. Achdou, O. Pironneau. “Computational methods for option pricing”, Cambridge: Cambridge University Press., 2005, pp. 123-256.
[15] J. L. Xue, S. R. Li, W. Y. Sun, et al. “Characteristics of the genetic mineralogy of pyrite and its significance for
prospecting in the Dayingezhuang gold deposit, Jiaodong Peninsula, China”, Science China Earth Science., Vol. 57, 2014, pp. 644-661.
[16] J. Deng, Q. Wang, L. Wan, et al. “A multifractal analysis of mineralization characteristics of the Dayingezhuang disseminated-veinlet gold deposit in the Jiaodong gold province of China”, Ore Geology Reviews., Vol. 40, No. 1, 2011, pp. 54-64.
[17] L. Zhang, L. Q. Yang, Y. Wang, et al. “Thermochronologic constrains on the processes of formation and exhumation of the Xinli orogenic gold deposit, Jiaodong Peninsula, eastern China”, Ore Geology Reviews., Vol. 81, 2017, pp. 140-153. [18] W. D. Ma, D. X. Zhang, Z. L. Wang, et al. “Comparative
Study on Mineralization Characteristics of Dayingezhuang Gold Deposit and Xiadian Gold Deposit in Jiaodong”, Bulletin of Mineralogy, Geochemistry., Vol. 34, No. 1, 2015, pp. 191-200.
[19] B. L. Zhang, W. Shan, D. P. Li, et al. “The hydrothermal alteration of the Dayingezhuang gold deposit in Jiaodong”, Acta Petrologica Sinica., Vol. 33, 2017, pp. 2256-2272. [20] L. Q. Yang, J. Deng, Z. L. Wang, et al. “The Mesozoic gold
mineralization system in Jiaodong”, Chinese Journal of Rock., Vol. 30, 2014, pp. 9-15.
[21] G. X. Lü, Q. D. Huo, Y. L. Yuan, et al. “The intracontinental tectono-magmatic igneous uplift of the Jiaodong gold deposit-demolition and erosion-included mineralization”, Earth Science Frontier., Vol. 24, 2017, pp. 95-103.