Available online at GSC Online Press Directory
GSC Biological and Pharmaceutical Sciences
e-ISSN: 2581-3250, CODEN (USA): GBPSC2
Journal homepage: https://www.gsconlinepress.com/journals/gscbps
Corresponding author
E-mail address:
Copyright © 2019 Author(s) retain the copyright of this article. This article is published under the terms of the Creative Commons Attribution Liscense 4.0 (RESEARCH ARTICLE)
Analytical method validation for metformin quantification in dissolution medium
Bogantes-Molina Joselyn 1, Madrigal-Redondo German Leonardo 1, 2, *, Berrocal-Barrantes Lorena 1, 2,
Chavarría-Rojas Marianela 1, Acuña-Amador Daniel Alejandro 1, 2 and Vargas-Zúñiga Rolando 1, 2
1 Pharmacy School, Universidad Latina of Costa Rica, San José, Costa Rica. 2 Faculty of Pharmacy, University of Costa Rica, San José, Costa Rica.
Publication history: Received on 25 March 2019; revised on 16 April 2019; accepted on 20 April 2019
Article DOI: https://doi.org/10.30574/gscbps.2019.7.2.0049
Abstract
Metformin hydrochloride is a hypoglycemic agent used for type II Diabetes Mellitus treatment, and one of the most used to manage it. The objective of the present work was the development and validation of an analytical method to quantify metformin hydrochloride in the dissolution medium by UV spectrophotometry. Linearity and range, accuracy and precision were the validation process parameters. Validation process results showed the analytical method was easy, quick, secure and, furthermore, a linear, accurate and precise method in the studied concentrations range. Therefore, it is a reliable analytical method
.
Keywords: Metformin hydrochloride; Validation; Analytical method; Quantification; Dissolution; Spectrophotometry
1 Introduction
Metformin hydrochloride is an oral hypoglycemic drug used in type II Diabetes mellitus (DM2) treatment, it is one of the most popular drugs used this disease management. Metformin is the only agent in the biguanide group, it reduces the plasmatic glucose levels both basal and postmeal, and is used either as monotherapy or in combination with other antidiabetic agents, such as alpha-glucosidase inhibitors, sulphonylureas, insulin, DPP-4 inhibitors, thiazolidinediones and GLP-1 agonists [1].
Analytical method validation is a process to establish, through systematic laboratory studies and documentary evidence, that the analytical characteristics are conform with the requirements to the intended use of the analytical results [2]. The analytical characteristics to be considered in the validation processes may change according to the analytical determination objective. Conventional analytical characteristics used in method validation are accuracy, precision, specificity, detection limit, quantitation limit, linearity, range and robustness [3].
The analytical method for dissolved metformin quantification belongs to Category III methods according to USP 40 classification [2]. Therefore, a precision study is absolutely necessary, while the other parameters are only necessary according to the specific nature of the assay. The “Reglamento Técnico Centroamericano” 11.03.39:06 states that Quality Control laboratories who use official analytical methods should test the system linearity and precision. It is the case, metformin hydrochloride quantification was carried out under official USP 40 monography specifications, therefore linearity, range, accuracy and precision were the parameters studied for the method validation process.
44 the analytical procedure is applied to multiple samplings of a homogeneous sample repeatedly [2]. Finally, the parameters of repeatability, intermediate precision and reproducibility are used to evaluate the precision of an analytical method. The main objective of this work was the development and validation of an analytical method to quantify metformin hydrochloride by UV spectrophotometry. Linearity, range, accuracy and precision parameters were evaluated.
2 Material and methods
2.1 Standard curve preparation
An equivalent amount of metformin hydrochloride secondary standard was accurately weighed and transferred into a volumetric flask. It was dissolved using a phosphate buffer solution (pH 6.8 ± 0.05) to obtain a 50 µg/mL metformin hydrochloride standard solution. The standard curve was prepared by taking 1, 2, 3, 4, 5, 6, 7 mL aliquots and transferred them into a volumetric flask to obtain solutions into 2 to 14 µg/mL concentrations interval
2.2 System linearity
Three metformin hydrochloride standard curves were prepared using three different metformin hydrochloride standard solutions (the standard curves and standard solutions preparation is described in the subsection 2.1 Standard curve preparation). The standard curves absorbance was measured at maximum wavelength absorption (233 nm). The regression line equation and the correlation coefficient were calculated. An analysis of variance and the residuals analysis was also done.
2.3 System precision
2.3.1 System repeatability
Standard solutions of 4, 8 y 12 µg/mL in three replicates of metformin hydrochloride were prepared by means of a 50 µg/mL metformin hydrochloride standard solution. Absorbance was measured at maximum wavelength absorption, then, relative standard deviation and relative error were calculated and analyzed.
2.3.2 System intermediate precision
Standard solutions of 4, 8 y 12 µg/mL of metformin hydrochloride were prepared by means of a 50 µg/mL metformin hydrochloride standard solution. This preparation of the 4, 8 and 12 µg/mL solutions was done every day during three consecutive days. The solutions absorbance was measured at maximum wavelength absorption, then, relative standard deviation and relative error were calculated and analyzed
2.4 Method linearity
Three metformin hydrochloride solutions were prepared using pulverized tablets, the solutions concentration was 50 µg/mL equivalent in metformin hydrochloride. From these solutions by means of standard addition method, it was prepared different solutions with concentrations between 2 and 14 µg/mL. The solutions absorbance was measured at maximum wavelength absorption (233 nm). The regression line equation and the correlation coefficient were calculated. An analysis of variance and the residuals analysis was also done.
2.5 Method accuracy
Method accuracy was done by means of standard addition method. Solutions with 4, 8 y 12 µg/mL concentrations of metformin hydrochloride were prepared. The solutions absorbance was measured at maximum wavelength absorption (233 nm), recovery percentage of the added amount of metformin hydrochloride standard in the sample was calculated and correlation coefficient and regression line equation were also calculated
.
2.6 Method precision
2.6.1 Method repeatability
45 2.6.2 Method intermediate precision
Six solutions with a concentration 8 µg/mL of metformin hydrochloride were prepared every day during two consecutive days by means of standard addition method, using a 50 µg/mL metformin hydrochloride standard solution and a 50 µg/mL metformin hydrochloride solution prepared from pulverized tablets. The solutions absorbance was measured at maximum wavelength absorption, then, relative standard deviation and relative error were calculated and analyzed.
2.7 Statistical analysis
Statistical analysis was done using Microsoft Office Excel 365 v. 1809 computer software
3 Results
3.1 System linearity
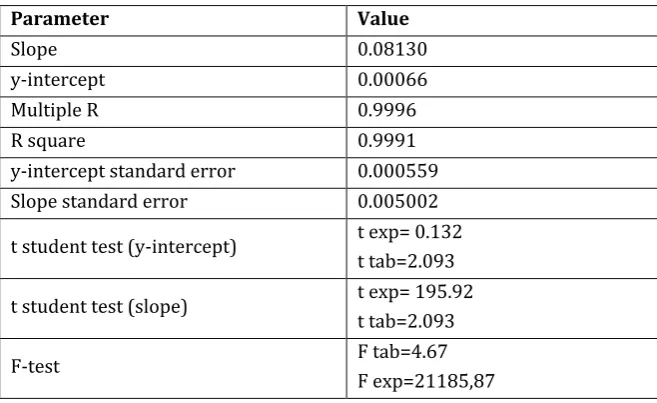
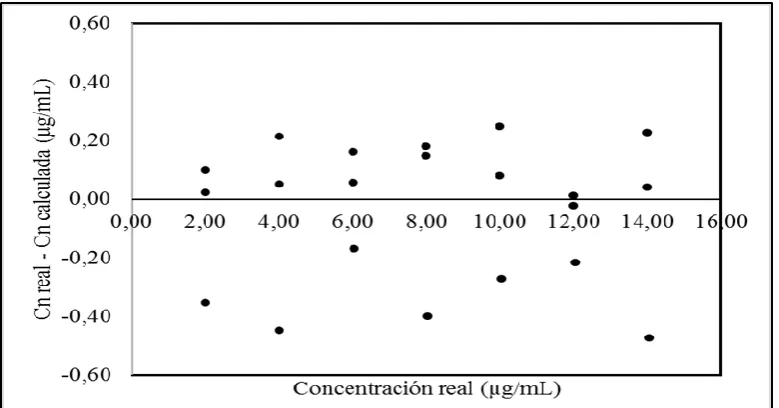
Figure 1 shows the linear relationship between absorbance and concentration in the evaluated range, the corresponding statistical analysis is observed in Table 1. The correlation coefficient met the acceptance criteria, that is higher than 0.995. Homoscedasticity was demonstrated using the Hartley’s test. According with F-test and ANOVA test, the dispersion among different concentrations data was not statistically significant. The slope and y-intercept were evaluated with the t-student test, demonstrating that y-intercept was statistically equal to 0 and the slope was statistically different to 0. Figure 2 shows the residual analysis, demonstrating the absence of any behavioral pattern. According to the data analysis, the analytical method met system linearity criteria
.
Figure 1 System linearity evaluation standard curve
Table 1 System linearity evaluation standard curve analysis
Parameter Value
Slope 0.08130
y-intercept 0.00066
Multiple R 0.9996
R square 0.9991
y-intercept standard error 0.000559
Slope standard error 0.005002
t student test (y-intercept) t exp= 0.132 t tab=2.093
t student test (slope) t exp= 195.92 t tab=2.093
F-test F tab=4.67
46 Figure 2 System residual analyses
3.2 System precision
3.2.1 System repeatability
The obtained results show a relative standard deviation and an error deviation lower than 2%, which met the acceptance criteria Table 2.
Table 2 System repeatability evaluation
Concentration
(µg/mL) Sample Absorbance
% Relative error
Mean of
absorbance Standard deviation
% Relative standard deviation
4
1 0.327 0.13
0.330 0.003 0.76
2 0.33 -0.79
3 0.332 -1.41
8
1 0.648 0.71
0.653 0.007 1.04
2 0.651 0.25
3 0.661 -1.29
12
1 0.970 0.80
0.970 0.002 0.21
2 0.968 1.01
3 0.972 0.60
3.2.2 System intermediate precision
47 Table 3 System intermediate precision evaluation
Concentration
(µg/mL) Sample Absorbance
% Relative error
Mean of
absorbance Standard deviation
% Relative standard deviation
4
1 0.329 -0.48
0.326 0.003 0.89
2 0.324 1.05
3 0.324 1.05
8
1 0.648 0.71
0.648 0.001 0.09
2 0.648 0.71
3 0.647 0.86
12
1 0.966 1.21
0.967 0.001 0.06
2 0.967 1.11
3 0.967 1.11
3.3 Method linearity
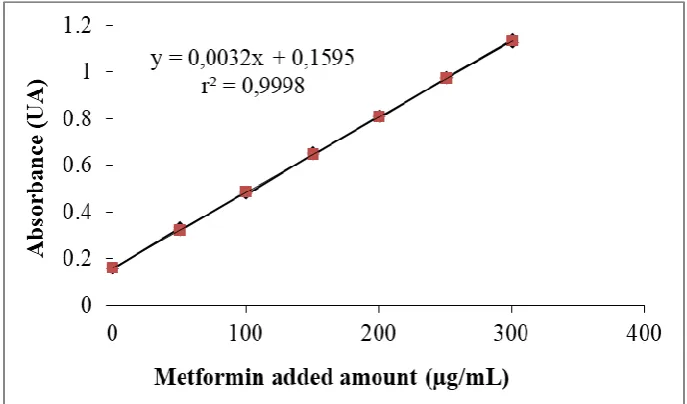
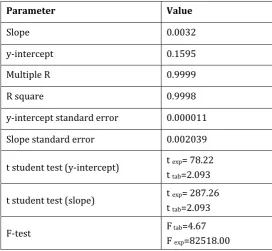
The linear relationship between absorbance and the standard added amount is observed in Figure 3 and the statistical analysis is shown in Table 4. The linear relationship was evaluated with the correlation coefficient, which is higher than 0,995 meeting the acceptance criteria. Hartley’s test results indicate homoscedasticity and, the F-test and ANOVA test results indicates that the dispersion among different concentrations data was not statistically significant. T-student test was used to evaluate the slope and y-intercept; according with the obtained results, y-intercept was statistically equal to 0 and the slope was statistically different to 0. The residual analysis demonstrated the absence of any behavioral pattern (Figure 4). The data analysis indicates that the analytical method met all method linearity criteria
48 Figure 4 Method residual analysis
Table 4 Method linearity evaluation standard curve analysis
Parameter Value
Slope 0.0032
y-intercept 0.1595
Multiple R 0.9999
R square 0.9998
y-intercept standard error 0.000011
Slope standard error 0.002039
t student test (y-intercept) t exp= 78.22 t tab=2.093
t student test (slope) t exp= 287.26 t tab=2.093
F-test F tab=4.67
F exp=82518.00
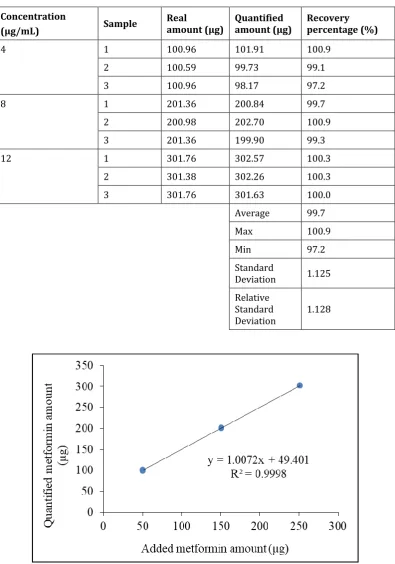
3.4 Method accuracy
49 Table 5 Method accuracy by standard addition method
Concentration
(µg/mL) Sample
Real
amount (µg) Quantified amount (µg) Recovery percentage (%)
4 1 100.96 101.91 100.9
2 100.59 99.73 99.1
3 100.96 98.17 97.2
8 1 201.36 200.84 99.7
2 200.98 202.70 100.9
3 201.36 199.90 99.3
12 1 301.76 302.57 100.3
2 301.38 302.26 100.3
3 301.76 301.63 100.0
Average 99.7
Max 100.9
Min 97.2
Standard
Deviation 1.125 Relative
Standard
Deviation 1.128
Figure 5 Relationship between quantified metformin amount and added metformin amount
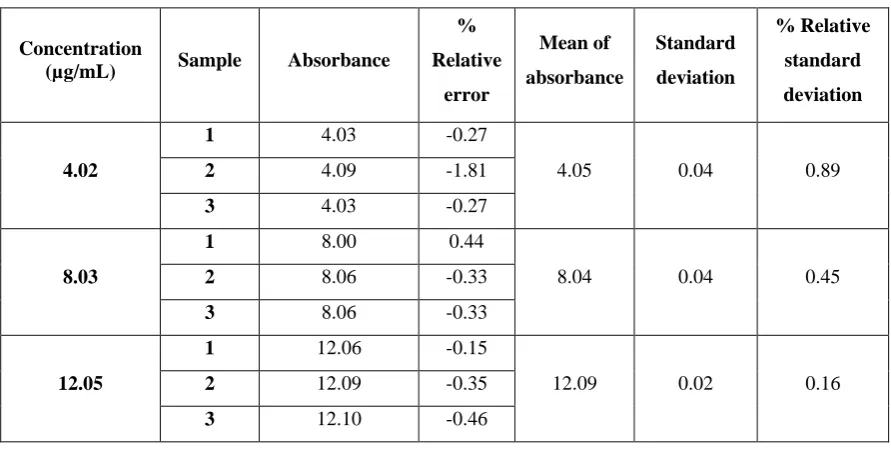
3.5 Method precision
3.5.1 Method repeatability
50 Table 6 Method repeatability evaluation
Concentration
(µg/mL) Sample Absorbance
%
Relative
error
Mean of
absorbance
Standard
deviation
% Relative
standard
deviation
4.02
1 4.03 -0.27
4.05 0.04 0.89
2 4.09 -1.81
3 4.03 -0.27
8.03
1 8.00 0.44
8.04 0.04 0.45
2 8.06 -0.33
3 8.06 -0.33
12.05
1 12.06 -0.15
12.09 0.02 0.16
2 12.09 -0.35
3 12.10 -0.46
3.5.2 Method intermediate precision
The results in Table 7 shows the data obtained in the analysis of intermediate precision. The statistical analysis indicates the parameter met the acceptance criteria
Table 7 Method intermediate precision evaluation
Sample
Day 1 Day 2
Quantified concentration
(µg/mL) Quantified (µg/mL) concentration
1 7.96 8.01
2 7.96 8.01
3 7.97 7.96
4 7.98 7.95
5 8.01 7.97
6 7.97 7.98
Mean 7.97 7.98
Relative Standard
Deviation 0.23 0.32
4 Conclusion
51
Compliance with ethical standards
Disclosure of conflict of interest
The authors hereby declare that we do not have any conflict of interest.
References
[1] Gong L, Goswami S, Giacomini K, Altman R and Klein T. (2012). Metformin pathways: pharmacokinetics and pharmacodynamics. Pharmacogenetics and Genomics, 2-13.
[2] United States Pharmacopoeia 40 (USP). (2017). United States Pharmacopoeia 40 (40 ed.). Rockville: U.S. Pharmacopoeial Convention.
[3] Wegscheider, W. (1996). Validation of Analytical Methods. In: H. Günzler, Accreditation and Quality Assurance in Analytical Chemistry, Berlin, 134-158
[4] COMIECO. (2006). Reglamento Técnico Centroamericano: Productos Farmacéuticos. Validación de Métodos Analíticos para la Evaluación de la Calidad de los Medicamentos. From http://asp.salud.gob.sv/regulacion/pdf/rtca/rtca_11_03_3906_productos_farmaceuticos_metodos_analiticos.p df
[5] Ministerio de Salud de Costa Rica. (s.f.). Guía de Validación de Métodos Analíticos. San José. From http://www.netsalud.sa.cr/ms/drc/pciudadano/guia_01.doc
[6] Food and Drugs Administration (FDA). (1996). Guidance for Industry: Q2B Validation of Analytical Procedures: Methodology. Rockville. From https://www.fda.gov/downloads/drugs/guidances/ucm073384.pdf
How to cite this article